
TEXTURE BASED DESCRIPTION OF MOVEMENTS FOR
ACTIVITY ANALYSIS
Kellokumpu Vili, Zhao Guoying and Pietikäinen Matti
Machine Vision Group,University of Oulu, P.O. Box 4500, Finland
Keywords: Activity analysis, texture, local binary pattern, temporal templates, hidden Markov models.
Abstract: Human motion can be seen as a type of moving texture pattern. In this paper, we propose a novel approach
for activity analysis by describing human activities with texture features. Our approach extracts spatially
enhanced local binary pattern (LBP) histograms from temporal templates (Motion History Images and
Motion Energy Images) and models their temporal behavior with hidden Markov models. The description is
useful for action modeling and is suitable for detecting and recognizing various kinds of activities. The
method is computationally simple. We perform tests on two published databases and clearly show the good
performance of our approach in classification and detection tasks. Furthermore, experimental results show
that the approach performs robustly against irregularities in data, such as limping and walking with a dog,
partial occlusions and low video quality.
1 INTRODUCTION
The detection and recognition of human activities
from video data have gained a lot of interest in
recent years. The potential application domains of
human activity analysis include advanced human-
computer interfaces, automated sign language
interpretation, surveillance applications etc. All
these domains have their own special demands, but
in general, the designed algorithms must be able to
detect and recognize various activities in real time.
They should also cope with spatial and temporal
differences in performance of actions as well as
handle variation in the observed data due to difficult
environment conditions.
Many approaches for human activity recognition
have been proposed in the literature (Moeslund et al.
2006, Gavrila 1999). Two typical approaches are to
use either human pose information (Elgammal et al.
2003, Kellokumpu et al. 2005) or motion
information (Efros et al. 2003).
The third common approach is to build templates
of activities. Bobick and Davis (Bobick and Davis
2001) used Motion Energy Images (MEI) and
Motion History Images (MHI) as temporal templates
to recognize aerobics movements. Matching was
done using seven Hu moments. 3D extension of the
temporal templates was proposed by Weinland et al.
(Weinland et al. 2006). They used multiple cameras
to build motion history volumes and performed
action classification using Fourier analysis in
cylindrical coordinates. Related 3D approaches have
been used by Blank et al. (Blank et al. 2005) and
Yilmaz and Shah (Yilmaz and Shah 2005) who
utilized time as the third dimension and built space-
time volumes in (x,y,t) space. Space time volumes
were matched using features from Poisson equations
and geometric surface properties, respectively.
Prior work with the temporal templates, motion
history volumes and space time volumes are based
on modeling the action as a whole. The choice of the
appropriate action duration parameter is crucial
because segmentation errors will lead to disastrous
classification. Also, in the case of temporal
templates and motion history volumes, actions that
occupy the same space at different times cannot be
modeled properly as the observed features will
overlap and new observations will erase old features.
Instead of modeling the activity with one
template we model the activities as a sequence of
templates. Furthermore, as the local properties of the
templates capture the essential information about
human movements, we propose to use texture
features for describing the templates. The local
binary pattern (LBP) gives a description of local
texture patterns and it has been successfully used in
various applications, ranging from texture
classification and segmentation to face recognition,
206
Vili K., Guoying Z. and Matti P. (2008).
TEXTURE BASED DESCRIPTION OF MOVEMENTS FOR ACTIVITY ANALYSIS.
In Proceedings of the Third International Conference on Computer Vision Theory and Applications, pages 206-213
DOI: 10.5220/0001075502060213
Copyright
c
SciTePress
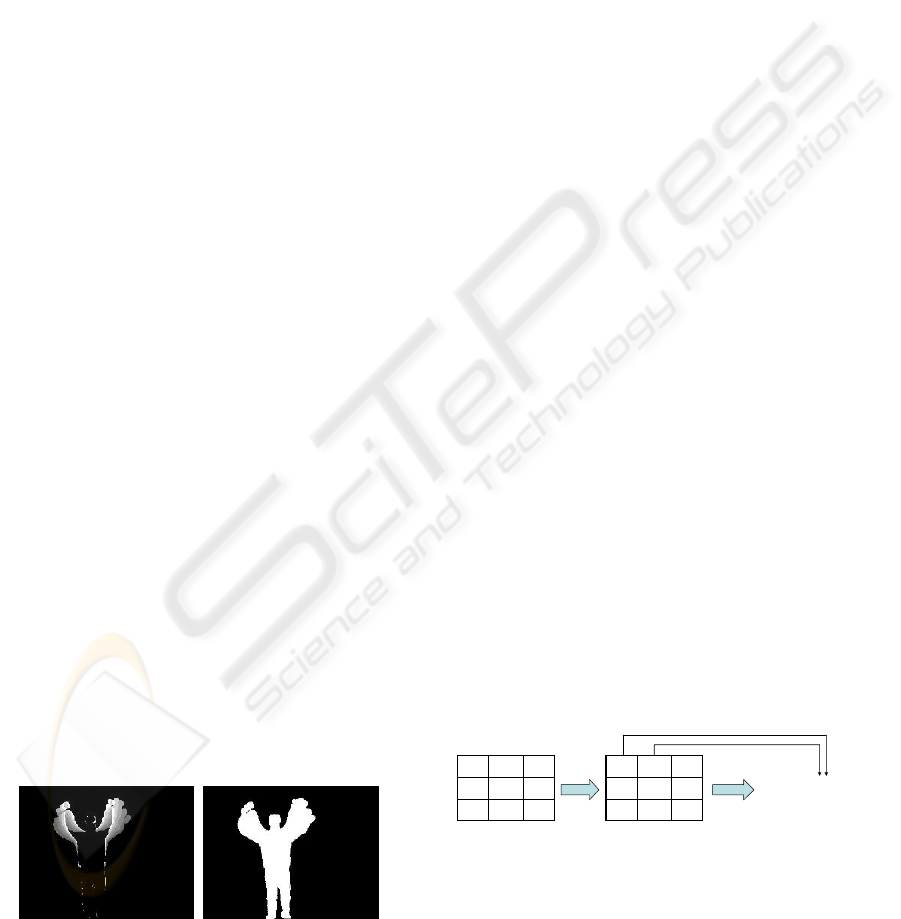
image retrieval and surface inspection. LBP features
are fast to compute so they have been found to be
suitable for real time applications.
In our method, we use the temporal templates as
a preprocessing stage for a texture based description
of human movements. We propose to extract
spatially enhanced LBP histograms from the
temporal templates to obtain our description. The
temporal modeling is done with hidden Markov
models (HMMs).
The proposed method describes human
movements on two levels. The texture description
calculated from MHI gives a good representation of
motion, whereas the MEI based description
characterizes shape information. One of the
advantages of the method is that the texture based
motion description is easy to compute compared to
optical flow estimation, for example. By using local
properties, our representation captures the essential
information of human movements and allows
variation in the performance of activities while still
preserving discriminativity.
Section 2 describes the methodology in detail
and Section 3 deals with experiments that illustrate
the accuracy and robustness of our method. Section
4 concludes the paper.
2 TEXTURE DESCRIPTION OF
MOVEMENTS
We introduce a new texture feature based
description of human movements. The method
employs temporal templates (Bobick and Davis
2001) as a preprocessing stage and uses LBP feature
representation that encodes both motion and shape
information of human movements. Finally, HMMs
are used for modeling temporal behavior.
2.1 Temporal Templates
Motion templates, MEI and MHI, were introduced to
describe motion information from images (Bobick
Figure 1: Illustration of the MHI (left) and MEI (right) in a
case where a person is raising both hands.
and Davis 2001). MEI describes where motion
occurred and MHI describes how the motion
occurred. MEI is a binary representation of the areas
of motion while MHI represents the history of
motion so that more recent movements are shown
with brighter values.
In our method, we use silhouettes as input for the
system. MHI can be calculated from the silhouette
representation as
⎩
⎨
⎧
−−
=
=
otherwise,)1)1,,(,0max(
1),,( if
),,(
tyxMHI
tyxD
tyxMHI
τ
τ
τ
(1)
where D is the silhouette difference between frames.
The MEI, on the other hand, can be calculated
directly from the silhouettes S:
U
τ
τ
0
),,(),,(
=
−=
i
ityxStyxMEI
(2)
The formulation is similar to that of Bobick and
Davis, but instead of silhouette difference, we chose
to use the silhouette representation for the MEI
calculation to get a better overall description of the
human shape.
The duration of τ is critical and varies from
activity to activity when MHI and MEI are used to
represent an activity as a whole. Since we model
movements as a sequence of templates, we can
choose a fixed τ to give a short term motion
representation. Figure 1 illustrates the templates.
2.2 Local Binary Pattern
LBP operator (Ojala et al. 2002) produces a binary
code that describes the local texture pattern, which is
built by thresholding a neighborhood of pixels by
the grey value of its center pixel. The original LBP
operator represents a 3x3 pixel neighborhood as a
binary number. Figure 2 illustrates the basic LBP
operator. When LBP operator is applied to an image,
the image texture can be described with a histogram
of the binary codes.
9119
61018
71323
9119
61018
71323
010
01
011
010
01
011
(10100011) =163
2
Figure 2: Illustration of basic LBP operator.
TEXTURE BASED DESCRIPTION OF MOVEMENTS FOR ACTIVITY ANALYSIS
207

Figure 3: Circular (8,2) neighborhood. If the sampling
point is not in the center of a pixel, the value at that point
is bilinearly interpolated from the nearest pixels.
The LBP operator has also been extended to
different kinds of neighborhoods. With a circular
neighborhood and bilinear interpolation of pixels,
any radius and number of sampling points in the
neighborhood can be used. Figure 3 shows an
example of the circular (8,2) neighborhood that has
8 sampling points and radius of 2.
We use the LBP description to characterize both
MHI and MEI. This gives us a new texture based
descriptor of human movements. From the definition
of the MHI and MEI it can be seen that the LBP
codes from MHI encode the information about the
direction of motion whereas the MEI based LBP
codes describe the combination of overall pose and
shape of motion.
As changes in the gray levels of the MHI encode
the motion, the outer edges of MHI may be
misleading as texture is considered. In these areas
there is no useful motion information and so the
non-moving pixels having zero value should not be
included in the calculation of the LBP codes.
Therefore, calculation of LBP features is restricted
to the nonmonotonous area within the MHI
template.
Also, the LBP description of an image only
contains information about the local spatial
structures and does not give any information about
the overall structure of motion. To preserve the
rough structure of motion the MHI is divided into
subregions. In our approach the division into four
regions is done through the centroid of the
silhouette. This division roughly separates the limbs.
For many activities seen from the side view, for
example sitting down, the division does not have any
clear interpretation but it preserves the essential
information about the movements. Our choice of
division may not be optimal, and by choosing a
more specified division scheme, one could increase
the resolution of the description and model more
specific activities.
w
w
w
w
1
2
3
4
w
w
w
w
1
2
3
4
Figure 4: Illustration of the formation of the feature
histogram. In this frame the top two subimages in MHI
have high weights compared to the bottom two.
In many cases some of the MHI subimages
contain much more motion than the others and thus
provide more information. To give more focus on
more meaningful areas of the images, we can
perform spatial enhancement by assigning different
weights to the subimages. Instead of using prior
weights, we give weights online based on the
relative amount of motion the subimage contains.
The weights are given as the ratio of the area of
nonzero pixels that the MHI subimage contains to
the area of nonzero pixels in the whole image:
∑
=
j
j
i
i
Rarea
Rarea
w
)(
)(
(3)
Considering the texture of MEI images, it is easy
to see that only the area around the boundaries gives
meaningful description. The calculation of LBP
features from MEI is performed only on these non-
monotonous areas. Also, all subimage histograms
are given equal weights.
All the MHI and MEI LBP features are
concatenated into one histogram and normalized so
that the sum of the histogram equals one. This is our
description of the templates in each frame. Figure 4
illustrates the MHI and MEI, their division into
subimages and the formation of LBP histograms.
2.3 Hidden Markov Models
The previously introduced LBP feature histograms
are used to describe the human motion in every
frame. The temporal modeling of the features is
done by using HMMs. Our models are briefly
described next but see tutorial (Rabiner 1989) for
more details on HMMs. In our approach a HMM
that has N states Q={q
1
,q
2
,...,q
N
} is defined with the
triplet λ = (A,π,H). Let the state at time step t be s
t
,
now the NxN state transition matrix A is
)}|(|{
1 itjtijij
qsqsPaa ====
+
A ,
(4)
VISAPP 2008 - International Conference on Computer Vision Theory and Applications
208

aa a
aa
11
12
22
23
33
h
hh
123
aa a
aa
11
12
22
23
33
h
hh
123
Figure 5: Illustration of a HMM. This example shows a 3
state left-to-right HMM with 8-bin feature histograms.
the initial state distribution vector π is
)}(|{
1 iii
qsP ===
π
π
π
(5)
and the H is the set of output histograms. The
probability of observing an LBP histogram h
obs
is the
texture similarity between the observation and the
model histograms. Histogram intersection was
chosen as the similarity measure as it satisfies the
probabilistic constraints. Thus, the probability of
observing h
obs
in state i is given as:
∑
== ),min()|(
iobsitobs
hhqshP ,
(6)
where the summation is done over the bins. Figure 5
illustrates a simple left-to-right HMM. HMMs can
be used for activity classification by training a
HMM for each action class. A new observed
unknown feature sequence H
obs
={h
obs1
,h
obs2
,…h
obsT
}
can be classified as belonging to the class of the
model that maximizes P(H
obs
| λ), the probability of
observing H
obs
from the model λ. The model training
is done using EM algorithm and the calculation of
model probabilities can be done using forward
algorithm.
3 EXPERIMENTS AND RESULTS
We use two different published databases for testing
our method. The first database (Kellokumpu et al.
2005) contains 15 activities and the second database
(Blank et al. 2005) 10 activities.
For the first database the original training
material was not available so we used the leave one
out strategy for the subjects in the test set. The
comparisons of the results are only indicative but
show that our method performs robustly. For the
second database the input silhouettes are the same as
the ones used in the original study.
Figure 6: Illustration of the activity classes in the first
database. Starting from the top left the activities are:
Raising one hand, Waving one hand, Lowering one hand,
Raising both hands, Waving both hands, Lowering both
hands, Bending down, Getting up, Raising foot, Lowering
foot, Sitting down, Standing up, Squatting, Up from squat,
Jumping jack. Note that the MHI from the whole duration
of the activity is shown to clarify the movements.
Tests with continuous video sequences of five
persons performing 15 different activities were
reported by (Kellokumpu et al. 2005). The activities
in the database (later referred as ‘database A’) were:
Raising one hand, Waving one hand, Lowering one
hand, Raising both hands, Waving both hands,
Lowering both hands, Bending down, Getting up,
Raising foot, Lowering foot, Sitting down, Standing
up, Squatting, Up from squat, Jumping jack. Each
person performed the activities in different order
without intentional pauses in between activities. The
activities are illustrated using their MHIs in Figure
6.
The system (Kellokumpu et al 2005) used SVM
to classify human pose in each frame and modeled
activities with HMM as a sequence of postures.
They experimented on continuous video data of
human activities and reported results on activity
detection and recognition. We will use the same
silhouettes and compare results in subsection 3.3.
Blank et al. (Blank et al. 2005) reported tests on
an online database that consists of two different
parts. The first part (‘database B’) contains nine
individuals performing ten different actions. The
actions are temporally segmented, though the
number of repetitions varied from person to person
and from activity to activity. The actions in the
database are: Running, Walking, Jumping jack,
Jumping forward on two legs, Jumping in place,
Galloping sideways, Waving two hands, Waving one
hand, Bending and Skipping. The second part
(‘robustness database’) is designed to test the
robustness of an algorithm against high irregularities
in performance of activities. The silhouettes in both
parts of the database are of low resolution as the
height of the subjects is roughly 70 pixels. The
TEXTURE BASED DESCRIPTION OF MOVEMENTS FOR ACTIVITY ANALYSIS
209

silhouettes also contain leaks and intrusions because
of imperfect background subtraction, shadows and
color similarities with the background.
Blank et al. described human actions as three
dimensional space-time shapes. They built a 3D
representation of silhouettes in (x,y,t) space and
described such a volume with features derived from
the solution to Poisson equation. In practice, they do
activity classification by dividing an example of an
activity into overlapping space-time cubes of fixed
length, and classify each cube individually with
nearest neighbor procedure. The method uses
aligned silhouettes and silhouettes are readily
available in their database.
With these databases we were able to make four
different experiment scenarios. In the first scenario,
we show the proposed LBP-based features cluster
even without a powerful modeling method. In the
second scenario, we utilize the HMM modeling and
experiment activity classification with temporally
segmented data with databases A and B. We perform
the temporal segmentation manually for the database
A, whereas the database B consists of segmented
data. In the third scenario, we experiment on
continuous data and give activity detection and
recognition results. This is done with the data from
the database A. In the fourth scenario we use the
robustness database and test our method against
irregularities in the data such as walking in a skirt or
limping as well as partially occluded legs or walking
behind an occluding pole.
3.1 Feature Analysis
In this scenario we want to experiment on how the
features behave in a simple case without a heavy
modeling method. We first chose one sample from
each person performing each of the 15 activities in
database A. We calculated the LBP histogram
descriptions for these samples and removed the time
information by summing up the histograms over
time and normalized the sum into one. Then we
calculated the histogram intersection of these
samples to all the other samples. Figure 7 illustrates
the MHI based distances from sample to sample
with τ set to four and circular (8,2) LBP
neighborhood.
It can be seen that the samples clearly form
clusters that represent the activity classes. This
experiment was repeated with different template
durations τ and LBP kernels and the distances
always showed similar results. This scenario shows
0.2
0.3
0.4
0.5
0.6
0.7
0.8
Raise one hand
Wave one hand
Lower one hand
Raise both hands
Wave both hands
Lower both hands
Bend down
Get up
Raise foot
Lower foot
Sit down
Stand up
Squat
Up from squat
Jumping jack
Raise one hand
Wave one hand
Lower one hand
Raise both hands
Wave both hands
Lower both hands
Bend down
Get up
Raise foot
Lower foot
Sit down
Stand up
Squat
Up from squat
Jumping jack
Figure 7: Illustration of the dissimilarity of the movement
istances. Dark regions show high similarity and the
diagonal dark squares show clustering of the activity
classes.
that the proposed features are indeed very
powerful in describing human movements.
It should be noted that the MEI based features
will not behave well in this scenario as movements
like raising one hand and lowering one hand will
show exactly the same features when the time
information is not used. In the next subsections we
will also consider the temporal properties of the
features and we perform modelling using HMM.
3.2 Activity Classification
We run the activity classification tests for the A and
B databases using HMM modeling. For the database
A, we again chose one example from each person
performing each of the 15 activities. Using the leave
one out approach, we used the examples of all but
one person to train the models and used the one for
testing. This was repeated for all the subjects in the
database. The results presented here are achieved
with τ set to four and with a circular (8,2)-LBP
neighborhood.
The test was run with three different feature
combinations. The MHI and MEI based LBP
features were first used separately and then jointly.
Both feature types were found to be useful. When
using only MEI based features the classification
accuracy was 90%. With MHI based features the
classification accuracy was 99% as only one
example was misclassified.
When MHI and MEI features were concatenated
into one feature vector the description contained
both the movement and shape information. Using
these features all the examples were classified
correctly. Although the recognition rate only
VISAPP 2008 - International Conference on Computer Vision Theory and Applications
210
improved a little when the combination of features
was used, the gap between the two most probable
models also increased for examples that were
already classified correctly making the classification
more reliable. Result on this experiment scenario
was not reported by Kellokumpu et al. (Kellokumpu
et al. 2005) as they focused on continuous data. We
will give results for that case in the next subsection.
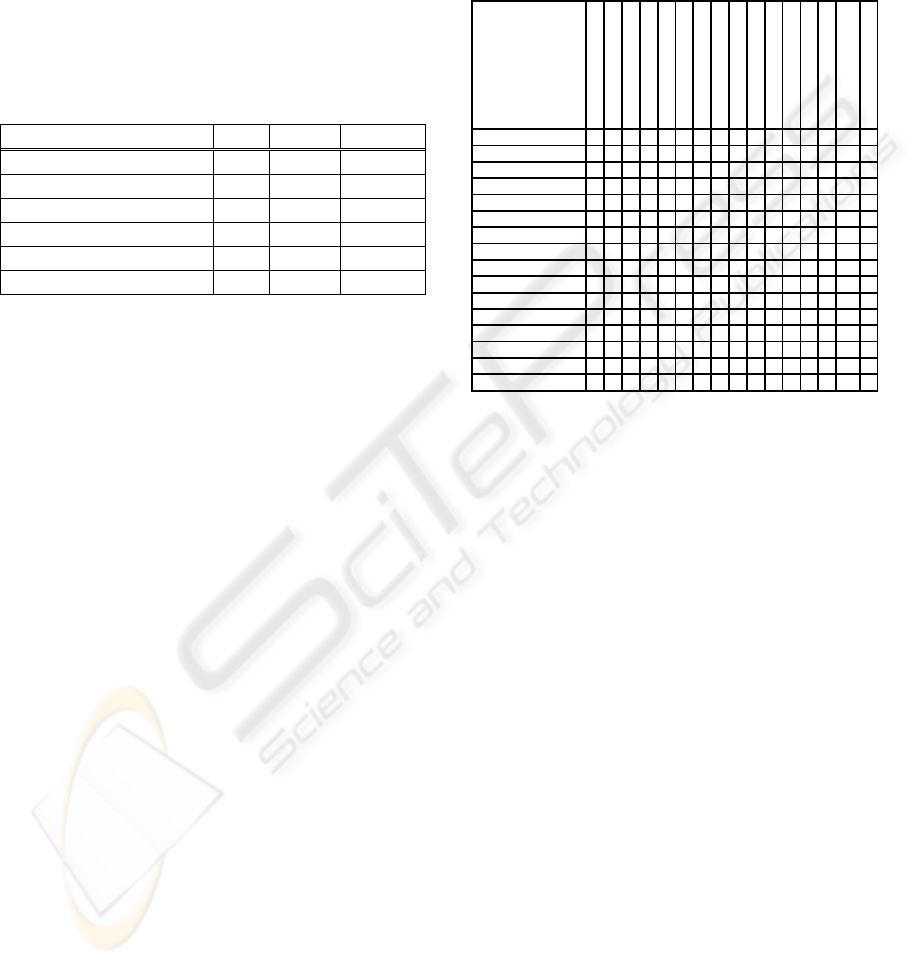
Table 1: Results reported in the literature for database B.
The first columns give the reference, number of classes,
total number of sequences used and finally the
classification result.
Ref. Act. Seq. Res.
Our method 10 90 97,8%
Wang and Suter 2007 10 90 97,8%
Boiman and Irani 2006 9 81 97,5%
Niebles et al 2007 9 83 72,8%
Ali et al. 2007 9 81 92,6%
Scovanner et al. 2007 10 92 82,6%
The same leave one out strategy was used when
the classification experiments were run on the
database B. This database contains nine individuals
performing ten different actions. As silhouettes in
this database are much smaller in size we chose a
smaller four point LBP neighborhood with radius of
one. By using the combination of MHI and MEI
based LBP features we were able to classify 88 out
of the 90 segments correctly.
It should be noted that our way of representing
the results is different from the way of Blank et al.
who performed the classification of activities
piecewise by partitioning each activity into many
overlapping space-time cubes and classified the
cubes with a nearest neighbor approach. Blank et al.
did not give results on the skipping action, so their
experiments consisted of 81 segments that were
divided into 549 cubes from which they reported to
misclassify only one space time cube.
Direct comparison of results to the original work
is ambiguous, but results on the same database have
been reported in the literature. Table 1 summarizes
the achieved classification results. We can see that
our method performs very well against various other
methods.
3.3 Activity Detection
To further illustrate the discriminativity of our
method, we performed the activity detection and
recognition tests for the database A. We used the
leave one out method on the test videos. We also
adopted the same windowing approach for temporal
segmentation as (Kellokumpu et al. 2005) This
resembles the exhaustive search used by Bobick and
Davis (Bobick and Davis 2001).
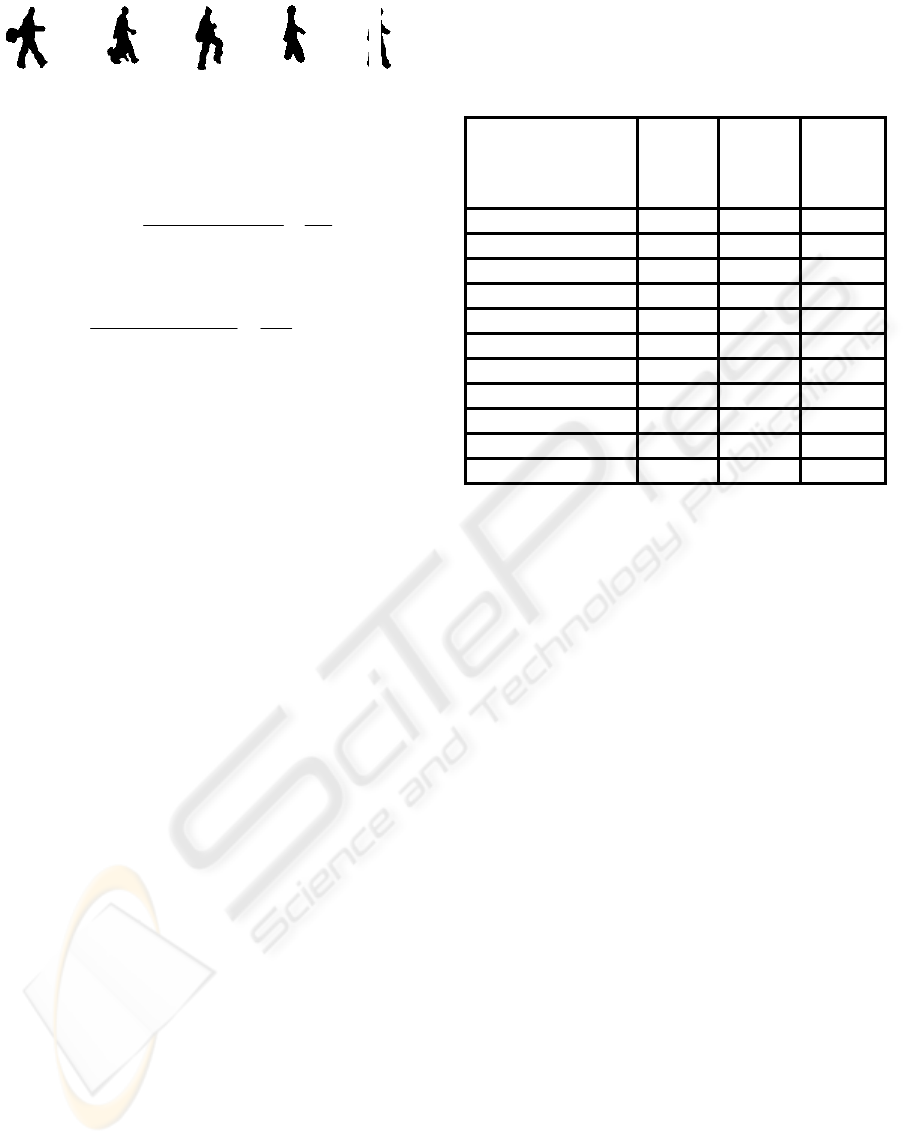
Table 2: Confusion matrix of the continuous data
experiment. The rows represent the detections and the
columns represent the ground truth for the detection.
Raising one hand
Waving one hand
Lowering one hand
Raising both hands
Waving both hands
Lowering both hand
s
Bending down
Getting up
Raising foot
Lowering foot
Sitting Down
Standing up
Squatting
Up from squat
Jumping jack
No movement
Raisin
g
one h 6 2
Wavin
g
one h 5 1
Lowerin
g
one h 1 5
Raisin
g
both h 6 1
Wavin
g
both h 3
Lowerin
g
both h 1 6 2
Bendin
g
down 5 2
Gettin
g
u
p
5
Raisin
g
foot 9
Lowerin
g
foot 8
Sittin
g
Down 5
Standin
g
u
p
5
S
q
uatin
g
6
U
p
from s
q
uat 6
Jum
p
in
g
j
ack 16
No detection 1 1 4 1
For this test scenario we used the combination of
MHI and MEI based LBP features as they provided
good classification results in the previous test
scenario. The MHI based features were also tried
alone, but the number of false alarms with this
segmentation approach was much higher than with
the combination of features. This shows that both
motion and shape have a significant role in detecting
and recognizing human activities.
The system described in (Kellokumpu et al.
2005) is invariant to handedness of performing
activities, for example, raising the left hand is
considered to be the same as raising the right hand.
In our approach these activities show different
features. As the database contains activities
performed in two ways, we have to train one model
for both cases. The training data on the second
model is the same as for the first but mirrored. We
did this for all actions where the handedness affects
the features, thus instead of trying to detect 15
activities, we actually have to try to detect 24
different activities.
It should be noted that our detections give more
information but we give the results in the same
format as the reference work. The results for the
tests are shown in Table 2. The number of activities
in the database was 101 and our method recognized
96 correctly with 106 detections. This gives the
TEXTURE BASED DESCRIPTION OF MOVEMENTS FOR ACTIVITY ANALYSIS
211
(a) (b) (c) (d) (e)
Figure 8: Example silhouettes from the robustness
experiments. (a) Swinging bag (b) walking with a dog (c)
knees up (d) occluded legs (e) walking behind pole.
%
95
101
96
dbin actions
detectionscorrect
rateon recogniti ===
(7)
and
%91
106
96
detections all
detectionscorrect
accuracy ===
.
(8)
A recognition rate of 90% and detection
accuracy of 83% was reported by Kellokumpu et al.
so our result is better.
It can be noticed from the confusion matrix in
Table 2 that many of the false alarms come when the
ground truth is waving one hand or both. Most of
these false alarms actually are from one subject
whose range of motion was much vaster than the
others. This results in false detections of raising and
lowering hand(s). Based on the training samples one
could argue that the detections could be interpreted
to be correct as well as the hands movement during
waving hand(s) was quite similar to repeating raising
and lowering hand(s) motions.
3.4 Robustness Experiments
We used the robustness database (Blank et al. 2005)
to test our approach against irregularities in the data.
The data used for training is the same that were used
in the classification experiments on the database B.
Some example silhouettes from the database are
illustrated in Figure 8.
The results along with results by (Wang and
Suter 2006) are given in Table 3. Our method can
classify nine out of eleven cases correctly and in the
two misclassified cases the correct class is the
second most probable class. Blank et al. did not
include the walking behind pole case and they were
able to classify nine out of ten correctly. It should
again be noted that Blank et al. partitioned the test
segments into space time cubes and in this case
made the classification based on median of test cube
distances to the most similar cubes in the training
data. This may help their classification as short
difficult parts of the test segment do not necessarily
affect the median value. In our experiment we used
the whole segments for classification.
Table 3: Classification results for the robustness test. The
first column describes the test scenario and the second
column shows our classification result. The label side
refers to the class Galloping sideways. The two last
columns show the result by two other methods.
Action Our 1
st
Rank o
f
walking
Wang an
d
Suter 2007
Rank o
f
walking
Blank e
t
al. 2005
N
ormal wal
k
walk 1 1
Walking in a skirt walk 1 1
Carrying briefcase side 1 1
Knees up side 1 1
Diagonal walk walk 2 1
Limping man walk 1 1
Occluded legs walk 1 1
Swinging bag walk 2 1
Sleepwalking walk >2 1
Walking with a dog walk >2 2
Walking behind pole walk - -
This test scenario clearly shows that our
approach can handle various kinds of difficult
conditions and still perform robustly. Even though
the matching strategy is different from the approach
of Blank et al., we can see that our method performs
very well and we can even classify correctly the
difficult walking behind pole case.
4 CONCLUSIONS
In this paper, we have proposed a novel approach for
human activity modeling that describes human
movements as a moving texture pattern. Temporal
templates are used as a preprocessing stage and their
local characteristics are described with LBP features.
Temporal aspects are modeled with HMMs. The
method is computationally simple and can run in
real time.
By using local properties, our representation
captures the essential information of human
movements and allows variation in the performance
of activities while still preserving discriminativity.
The new texture based description of movement is
robust and we have shown experiments and
comparison of results on activity recognition and
detection. The tests clearly show good performance.
We have also demonstrated that the method is robust
against irregularities in the data as well as partial
occlusions and low video quality.
Our representation encodes both shape and
motion. In the experiments the proposed method was
VISAPP 2008 - International Conference on Computer Vision Theory and Applications
212

used to model various kinds of activities with
excellent results. This shows that our texture based
description of movements is very useful for
modeling activities. Also, choosing the subimage
division scheme specifically for every action could
improve the description and enable the modeling of
very specific activities.
REFERENCES
Moeslund T. B.,Hilton A., Krüger V., 2006. A Survey of
Advances in Vision-based Human Motion Capture and
Analysis. Computer Vision and Image Understanding,
vol.104, issues 2-3, pp. 90 – 126,.
Gavrila D. M., 1999. The Visual Analysis of Human
Movement: A Survey. Computer Vision and Image
Understanding, vol. 73, no. 3, pp. 82 – 98.
Elgammal A., Shet V., Yacoob Y., Davis L. S., 2003.
Learning Dynamics for Exemplar-based Gesture
Recognition. In Proc. Computer Vision and Pattern
Recognition, vol. 1, pp. 571 – 578.
Kellokumpu V., Pietikäinen M., Heikkilä J., 2005. Human
Activity Recognition Using Sequences of Postures. In
Proc. Machine Vision Application, pp. 570 – 573,.
Efros A. A., Berg A. C., Mori G., Malik J., 2003.
Recognizing Action at a Distance. In Proc
International conference on Computer Vision, vol. 2,
pp. 726 – 733.
Bobick A., Davis J., 2001. The Recognition of Human
Movement Using Temporal Templates. IEEE
Transactions on Pattern Analysis and Machine
Intelligence, vol. 23, no. 3, pp. 257 – 267.
Weinland D., Ronfard R., Boyer E., 2006. Free Viewpoint
Action Recognition Using Motion History Volumes.
Computer Vision and Image Understanding, vol. 104,
issues 2-3, Pages 249-257.
Blank M., Gorelick L., Shechtman E., Irani M., Basri R.,
2005. Actions as Space-Time Shapes. In Proc.
International Conference on Computer Vision, vol. 2,
pp. 1395 – 1402.
Yilmaz A., Shah M., 2005. Action Sketch: a Novel Action
Representation. In Proc. Computer Vision and Pattern
Recognition, vol. 1, pp. 984 – 989.
Ojala T., Pietikäinen M., Mäenpää T., 2002.
Multiresolution Gray-Scale and Rotation Invariant
Texture Classification with Local Binary Patterns.
IEEE Transactions on Pattern Analysis and Machine
Intelligence, vol. 24, pp. 971 – 987.
Rabiner L.R., 1989. A Tutorial on Hidden Markov Models
and Selected Applications in Speech Recognition.
Proceedings of the IEEE, vol. 77, no. 2, pp. 257 – 285.
Niebles J. C., Fei-Fei L., 2007. A Hierarchical Model of
Shape and Appearance for Human Action
Classification, In Proc. Computer Vision and Pattern
Recognition, 8p.
Wang L., Suter D., 2007. Recognizing Human Activities
from Silhouettes: Motion Subspace and Factorial
Discriminative Graphical Model, In Proc. Computer
Vision and Pattern Recognition, 8p.
Boiman O., Irani M., 2006. Similarity by Composition,
Neural Information Processing Systems (NIPS).
Scovanner P., Ali S., Shah M., 2007. A 3-Dimensional
SIFT Descriptor and its Application to Action
Recognition. In Proc ACM Multimedia, pp. 357 – 360.
Ali S., Basharat A., Shah M., 2007. Chaotic Invariants for
Human Action Recognition. In proc International
Conference on Computer Vision, 8p.
TEXTURE BASED DESCRIPTION OF MOVEMENTS FOR ACTIVITY ANALYSIS
213
