
SCREENING OF OBSTRUCTIVE SLEEP APNEA BY RR INTERVAL
TIME SERIES USING A TIME SERIES NOVELTY DETECTION
TECHNIQUE
A. P. Lemos, C. J. Tierra-Criollo and W. M. Caminhas
Department of Electrical Engineering, Universidade Federal de Minas Gerais, Antonio Carlos Av., 6627, Belo Horizonte, Brazil
Keywords:
Obstructive sleep apnea, RR interval time series, Time series novelty detection.
Abstract:
This work proposes a methodology to screen obstructive sleep apnea (OSA) based on RR interval time series
using a time series novelty detection technique. Initially, the RR interval is modeled using an autoregressive
model. Next, for each data point of the time series, the model output, ˆx(t), is compared with the observed
value, x
t
, and the prediction error is generated. The prediction error is then processed in order to detect
novelties. Finally, the novelties detected are associated with apnea events. This methodology was applied to
the Computers in Cardiology sleep apnea test data and correctly classified 29 out of 30 cases (96.67%) of both
OSA and normal subjects, and correctly identified the presence of apnea events in 14078 out of 17268 minutes
(81.53%) of the test data set.
1 INTRODUCTION
Obstructive sleep apnea (OSA) is a sleep disorder
characterized by pauses in breathing during sleep with
a reported prevalence in 4% in adult men and 2% in
adult women (Young et al., 1993). Obstructive sleep
apnea is associated with increased risks of high blood
pressure, myocardial infarction, stroke, and with in-
creased mortality rates.
According to the (AASM, 1999) patients are diag-
nosed with OSA if they have 5 or more events of ap-
nea per hour of sleep during a full night sleep period.
Each event is characterized by a respiratory pause dur-
ing 10 seconds.
The definitive diagnosis of OSA is made by
polysomnography (PSG). PSG is a multi-parametric
test based on brain electrical activity (EEG), eye and
jaw muscle movement, leg muscle movement, air-
flow, respiratory effort (chest and abdominal excur-
sion), electrocardiography (ECG) and oxygen satura-
tion. This exam is expensive and requires the patient
to spend the night in the hospital.
In (Guilleminault et al., 1984) is reported that
OSA can be characterized by cyclical variations on
RR interval time series caused by progressive brady-
cardia, followed by abrupt tachycardia on resumption
of breathing. This eventsare highly nonlinear and non
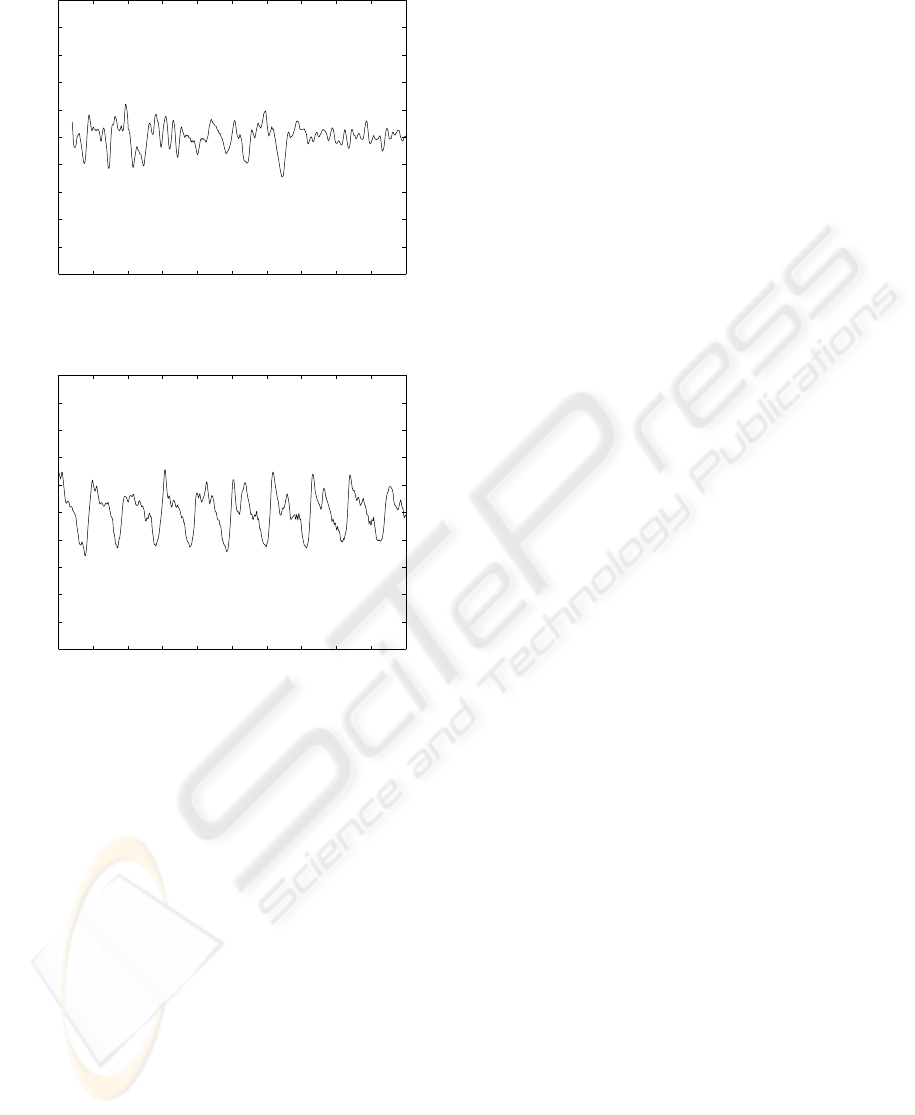
stationary. Figure 1 illustrates a RR interval time se-
ries in two distinct time intervals, the first one, with no
apnea events and, the second one, with these events.
If an automatic method is developed to screen the
pathology using ECG monitoring instead of PSG, this
can be done on basis of a portable and inexpensive
device from patient home.
This paper proposes a methodology to detect OSA
from RR interval time series based on a novelty detec-
tion technique. The normal behavior of a system can
be characterized by a series of observations through
the time. The problem of novelty detection consists
in finding time periods where some characteristic of
the monitored system has been changed.
An autoregressive model is used to model the
RR interval time series using a subset without ap-
nea events. For each data point of the time series,
the model output is compared with the observed value
and the prediction error is generated. The prediction
error is then processed in order to detect novelties. Fi-
nally, the novelties detected are associated with apnea
events, since based on informationgiven by (Guillem-
inault et al., 1984), this events are nonlinear and non
stationary.
This paper is divided as follows: in section 2 the
RR interval time series is preprocessed in order to be
modeled using an autoregressive model. Next, in sec-
tion 3 the time series novelty detection technique is
presented. In section 4 this technique is applied on
Computers in Cardiology sleep apnea dataset (Gold-
berger et al., 2000) in order to detect OSA. Finally,
section 5 presents conclusions and suggestions for
further research.
570
P. Lemos A., J. Tierra-Criollo C. and M. Caminhas W. (2008).
SCREENING OF OBSTRUCTIVE SLEEP APNEA BY RR INTERVAL TIME SERIES USING A TIME SERIES NOVELTY DETECTION TECHNIQUE.
In Proceedings of the First International Conference on Bio-inspired Systems and Signal Processing, pages 570-575
DOI: 10.5220/0001067505700575
Copyright
c
SciTePress
0 1 2 3 4 5 6 7 8 9 10
−0.5
−0.4
−0.3
−0.2
−0.1
0
0.1
0.2
0.3
0.4
0.5
Tempo (minutos)
RR (segundos)
(a) Normal
20 21 22 23 24 25 26 27 28 29 30
−0.5
−0.4
−0.3
−0.2
−0.1
0
0.1
0.2
0.3
0.4
0.5
Tempo (minutos)
RR (segundos)
(b) Apnea events
Figure 1: A RR interval time series with and without apnea
events.
2 RR INTERVAL TIME SERIES
PREPROCESSING
In order to model the RR interval time series using an
autoregressive model, the time series must be prepro-
cessed to become stationary.
The preprocessing technique used in this work is
similar with the one used on (Mietus et al., 2000) and
is performed by the following steps:
1. The RR interval time series is extracted from ECG
using an automated beat detection and classifica-
tion algorithm selecting only normal sinus beats
intervals in order to eliminate the effects of ec-
topic beats.
2. A moving average filter is applied to the signal
in order to remove noise caused by beat detection
and classification algorithm errors. For each set
of 41 RR intervals, a local mean is computed ex-
cluding the central value and those values which
lie outside the range of 0.4 to 2.0 sec. The cen-
tral values is considered to be an outlier and is
excluded if lies outside of 20% of the mean.
3. The signal is linearly resampled at 1 Hz.
4. The signal is smoothed. For each window of 5
points, the value of the central point is replaced
by the average value over the window.
5. The signal is detrended. For each window of 81
points, the slope of the regression line over the
window is calculated, and the value of this fit
at the central point is subtracted from the actual
value of this point.
Figure 2 illustrates a RR interval time series be-
fore and after the preprocessing.
3 TIME SERIES NOVELTY
DETECTION TECHNIQUE
In this section the time series novelty detection tech-
nique used to detect OSA will be presented. This
technique is based on a detector build on the variation
of an autoregressive model prediction error.
3.1 Autoregressive Model
An autoregressive model of order p, AR(p) estimates
the current value of a stochastic process as a linear
combinationof its last p values and a white noise. The
white noise process, a
t
, is assumed to be Gaussian, in-
dependent and identically distributed (i.i.d), with zero
mean and variance σ
2
a
. This model can be written as:
X
t
= φ
1
X
t−1
+ φ
2
X
t−2
+ ···+ φ
p
X
t−p
+ a
t
(1)
where φ = φ
1
, φ
2
, ··· , φ
p
and σ
2
a
are model parame-
ters.
Given a time series that can be described as a
stochastic process, to build a forecasting model for
this series using (1) initially it is necessary to estimate
the model parameters for several values of p and then
evaluate which is the most suitable value for p using
some statistical criterion.
The Maximum Likelihood Estimator for the model
parameters, φ = φ
1
, φ
2
, ··· , φ
p
and σ
2
a
, is defined as
(Box and Jenkins, 1990), (Davis and Vinter, 1985):
SCREENING OF OBSTRUCTIVE SLEEP APNEA BY RR INTERVAL TIME SERIES USING A TIME SERIES
NOVELTY DETECTION TECHNIQUE
571
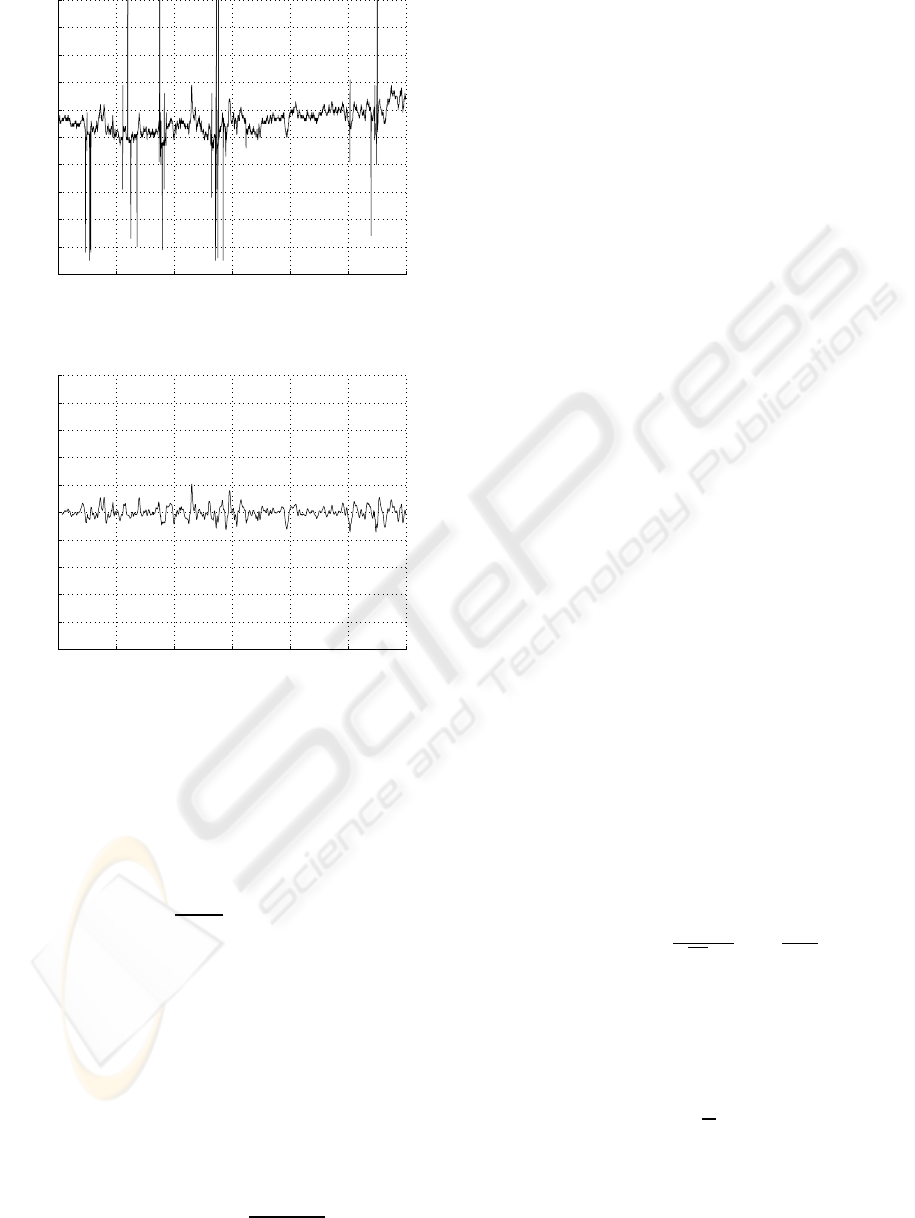
0 5 10 15 20 25 30
0.2
0.3
0.4
0.5
0.6
0.7
0.8
0.9
1
1.1
1.2
Tempo (minutos)
RR (segundos)
(a) Before
0 5 10 15 20 25 30
−0.5
−0.4
−0.3
−0.2
−0.1
0
0.1
0.2
0.3
0.4
0.5
Tempo (minutos)
RR (segundos)
(b) After
Figure 2: RR interval time series before and after prepro-
cessing.
ˆ
φ = (X
′
X)
−1
(X
′
Z) (2)
ˆ
σ
a
2
=
ˆ
τ
−1
=
1
N − p
(Z −X
ˆ
φ)(Z −X
ˆ
φ)
−1
where Z =
X
p+1
X
p+2
.
.
.
X
N
e X =
X
p
··· X
1
X
p−1
··· X
2
.
.
.
.
.
.
.
.
.
X
N−1
··· X
N−p
Once the parameters of several AR(p) models
have been calculated, the most suitable value of p
must be estimated. The Scharwaz’s Bayesian Infor-
mation Criterion (BIC) (Schwarz, 1978) is used to se-
lect the p value. The BIC is given by:
BIC = log(
ˆ
σ
a
2
) +
Mlog(N)
N
(3)
where M = p+1 and N is the length of the time series.
3.2 The Detector
For each time series data point, the detector must be
capable to distinguish between the following hypothe-
ses:
H
0
: x
t
is normal
H
1
: x
t
is a novelty
For a given input x
t
the detector must be capable
to classify the point as normal meaning that it can be
predicted by the forecasting model build for the time
series, or novelty, the point can not be predicted by
the model.
The detection probability P
D
is the probability of
the detector to classify the point as a novelty cor-
rectly, P(H
1
;H
1
). The false alarm probability P
FA
is
the probability of the detector to classify the point as a
novelty when the point is actually normal, P(H
1
;H
0
).
Initially, the forecasting model parameters are es-
timated using a dataset of the time series assumed as
normal. Then, for each new observed value of the
time series x
t
the statistical inference on the hypothe-
ses is performed by the following steps:
1. The predicted value ˆx
t
is calculated using p last
points of the time series.
2. The parameters of the predicted value distribution
are estimated and the thresholds of the interval are
calculated given a significance level α.
3. If the observed value of the time series x
t
is in-
side the prediction interval, the null hypothesis is
considered true.
The conditional probability density function of the
forecasting model output when the null hypothesis is
true, given the last p observations, is:
p(
ˆ
X
t
|x
t−1
, ···, x
t−p
;H
0
) =
1
√
2π
ˆ
σ
a
2
exp−
1
2
ˆ
σ
a
2
(
ˆ
X
t
−µ
t
)
2
(4)
where µ
t
= φ
1
x
t−1
+ ···+ φ
p
x
t−p
.
The thresholds of the prediction interval given a
significance level α is:
µ
t
±Q
−1
α
2
ˆ
σ
a
(5)
where Q(x) is the complementary cumulative dis-
tribution function of the normal distribution (Kay,
1993).
BIOSIGNALS 2008 - International Conference on Bio-inspired Systems and Signal Processing
572

The false alarm rate P
FA
is equal to the
prediction interval significance level α. How-
ever the conditional novelty probability distribution
P(
ˆ
X
t
|x
t−1
, ··· , x
t−p
;H
1
) it is not know, so it is not
possible to calculate the detection probability analyt-
ically.
3.3 Detector Output Processing
The detector classifies each point of the time series
as a novelty or normal. However, the novelty to be
detected, apnea events, is formed by a sequence of
points. So, in order to use this detector it is proposed
a technique to process the detector output using a slid-
ing window of size W.
Given N detector outputs related to N data points
of the time series, N −W + 1 windows are generated.
The first window is formed by the outputs on the in-
terval [1, W], the second on the interval [2, W + 1], and
so on:
c(1) c(2) ··· c(W)
c(2) c(3) ··· c(W + 1)
.
.
.
.
.
.
.
.
.
c(N −W + 1) c(N −W + 2) ··· c(N)
where c
i
is the detector output relative to the time se-
ries data point on time instant i and c
i
is equal to 0 if
the null hypothesis is true and 1 otherwise.
Each window is defined as an event E
W
(t) and its
1-norm is given by:
|E
W
(t)| =
i=W−1
∑
i=0
c(t + i) (6)
and measures how many novelties are found on the
event.
Assuming that the detector output is an identical
distributed Bernoulli variable, |E
W
(t)| will be a bino-
mial random variable:
p
|E
W
|
(|e
W
|) =
W
|e
W
|
!
q
|e
W
(t)|
(1−q)
n−|e
W
(t)|
if |e
W
(t)| = 0···W
0 otherwise
(7)
where q is the probability of occurrence of a novelty,
and it is given by q = α.
A unilateral confidence interval is built upon
p
|E
W
|
(|e
W
|) and if the value of |E
W
(t)| is bigger than
this interval, all the points present in this event (win-
dow W) are partially classified as novelties. The
threshold of this confidence interval is calculated find-
ing the smallest integer whose cumulativedistribution
function evaluated in this point is equal or exceeds the
value of α.
After this procedure, each point of the interval
[W, N −W + 1] will have W distinct partial classifi-
cations, since each one of these points appears on
W windows. On the other hand, the first points of
the interval [1, W1] will have i distinct classifications,
where i is its position on the interval. Finally the
points of the interval [N −W + 2, N] will have j clas-
sifications, where j = N −i.
The final result for each point is obtained defining
a percentage of partial novelties classifications that
each point must have to be finally classified as a nov-
elty. This constant is a parameter of the proposed al-
gorithm defined as k and is defined for the interval
(0, 1].
3.4 Parameters
The proposed time series novelty detection technique
has the following parameters:
• The significance level α used to build the AR(p)
prediction intervals and the p
|E
W
|
(|e
W
|) confi-
dence interval.
• The window size W used to process the detector
output.
• The percentage of partial novelty classifications k
that each point must have to be finally classified
as a novelty.
4 EXPERIMENTS
In this section the time series novelty detection tech-
nique is used to detect OSA on Computers in Cardi-
ology sleep apnea dataset.
4.1 Dataset
This dataset contains 70 records varying in length
from almost 7 hours to nearly 10 hours of continuous
digitized ECG signal and reference apnea annotations
for each minute performed by human experts on the
basis of simultaneously recorded respiration and re-
lated signals.
This dataset was used on a competition for devel-
opment and evaluation of ECG-based apnea detectors
(Penzel et al., 2002) and is divided in a learning set
of 35 records and a test set containing the remain-
ing records. All records were previously classified in
three groups: a first group (A) with clear evidence
SCREENING OF OBSTRUCTIVE SLEEP APNEA BY RR INTERVAL TIME SERIES USING A TIME SERIES
NOVELTY DETECTION TECHNIQUE
573

0 50 100 150 200 250 300 350 400 450 500
0
0.1
0.2
0.3
0.4
0.5
0.6
0.7
0.8
0.9
1
Time (minutes)
Resulting Annotations
Reference Annotations
Figure 3: Reference and detector resulting annotations for
each minute for the record a05 of the learning set.
of sleep apnea with more than 100 minutes of apnea
events; a second group (B) with some degree of ap-
nea, with 5 to 100 minutes of apnea events; and a third
group (C) of healthy patients with less than 5 minutes
of apnea events.
The competition consisted of two challenges. The
first challenge was to distinguish between healthy pa-
tients (group C) and patients with OSA (group A).
The second challenge was to label each minute of all
records as either containing apnea events or not.
4.2 Methods
For each record, the RR interval time series was ex-
tracted from the ECG signal and preprocessed using
the methodology described on section 2.
Next, 10 minutes of the resulting time series with-
out apnea events where used to estimate the AR(p)
model parameters. The order of the model was set to
p = 17, according to BIC.
Finally the time series novelty detection technique
was used to label each minute of the signal as contain-
ing apnea ( novelty ) or not ( normal). The parameters
of the algorithm were set to W = 240 points (4 min-
utes), α = 0.01 and k = 1.
The signal is sampled at 1 Hz, so in order to gen-
erate a label for each minute, if a window of 60 points
havemore than 10 points classified as novelty, the cor-
responding minute is labeled as apnea.
Figure 3 illustrates the detector resulting annota-
tions and reference annotations for the record a05 of
the learning set.
In order to distinguish between records of healthy
patients and patients with OSA, if the record contain
less than 50 minutes labeled as apnea the patient is
considered to be healthy.
4.3 Results
The technique proposed was able to correctly distin-
guish between healthy and OSA patients on 57 out of
60 records ( 95.00%), 29 out of 30 (96.67%) of the
learning set and 28 out of 30 (93.33%) from the test
set.
When used to label each minute of the records,
it correctly classified 28119 out of 34313 minutes
(81.95%), 14041 out of 17045 of the learning set
(82.38%) and 14078 out of 17268 (81.53%) of the
test set.
5 CONCLUSIONS AND FUTURE
WORK
Experiments shows that the technique proposed can
be used to screen OSA based on RR interval time
series. When compared with the 10 best results of
the Computers in Cardiology magazine competition
(Penzel et al., 2002), for the first challenge, the tech-
nique achieved similar results. For the second chal-
lenge, minute by minute apnea event annotations, the
results were slightly lower than the best results of the
competition. The techniquewas able to correctly clas-
sify 81.5% of the test set and the top 10 competition’s
techniques correctly classify 84.5% up to 96.2%.
Table 1 compares the results achieved by the
methodology proposed with the results achieved by
Physionet’s apdet tool (Mietus et al., 2003) for the
dataset described later.
Table 1: Comparison results.
Dataset Challenge Proposed Methodology apdet
Train
1 96.7% 86.6%
2 82.0% 82.1%
Test
1 93.3% 93.3%
2 81.5% 84.5%
The main advantage of the technique proposed is
the simplicity. The detection algorithm can be imple-
mented in linear time and space, so it can run on cheap
hardware. However, the main drawback of this tech-
nique is that it needs a dataset without apnea events
in order to train the model. This dataset has to be
achieved for each patient by a specialist or by another
automatic methodology.
In order to use an AR(p) model, the time series
must be stationary, what was assumed for the RR in-
terval time series preprocessed. However this is not
completely true, so this technique can be improved
using an adaptive autoregressive model.
BIOSIGNALS 2008 - International Conference on Bio-inspired Systems and Signal Processing
574

The time series novelty detection technique pre-
sented is general purpose and can be used for screen-
ing other anomalies. It has already been used to detect
ECG arrhythmias (Lemos et al., 2007).
The novelty detection technique proposed in this
work can be integrated on a physiological remote
monitoring system in order to reduce the amount of
data transmitted. Those systems are used to monitor
chronic patients biomedical signals ( ECG, breathing
frequency, temperature ). At patient’s location, some
sensors are used to read biomedical signals. These
signals are sent through a network to a remote station
where the data is stored and analysed by specialists
(Lin et al., 2004). The novelty detection technique
proposed can be used to filter the data that needs to be
sent to the remote station, where only data classified
as novelty is sent.
REFERENCES
AASM (1999). Sleep-related breathing disorders in adults:
recommendations for syndrome definition and mea-
surement techniques in clinical research. Sleep,
22:667–689. American Academy of Sleep Medicine
Task Force.
Box, G. E. P. and Jenkins, G. (1990). Time Series Analysis,
Forecasting and Control. Holden-Day, Incorporated.
Davis, M. and Vinter, R. (1985). Stochastic Modelling and
Control. Chapman Hall.
Goldberger, A. L., Amaral, L. A. N., Glass, L., Hausdorff,
J. M., Ivanov, P. C., Mark, R. G., Mietus, J. E., Moody,
G. B., Peng, C.-K., and Stanley, H. E. (2000). Phys-
ioBank, PhysioToolkit, and PhysioNet: Components
of a new research resource for complex physiologic
signals. Circulation, 101(23):e215–e220.
Guilleminault, C., Connolly, S., Winkle, R., Melvin, K., and
Tilkian, A. (1984). Cyclical variation of the heart rate
in sleep apnoea syndrome. mechanisms, and useful-
ness of 24 h electrocardiography as a screening tech-
nique. Lancet, 1:126–131.
Kay, S. M. (1993). Fundamentals of statistical signal pro-
cessing: detection theory. Prentice-Hall, Inc., Upper
Saddle River, NJ, USA.
Lemos, A. P., Tierra-Criollo, C. J., and Caminhas, W. M.
(2007). Ecg anomalies identification using a time se-
ries novelty detection technique. In IV Latin American
Congress on Biomedical Engineering.
Lin, Y.-H., Jan, I.-C., Ko, P., Chen, Y.-Y., Wong, J.-M., and
Jan, G.-J. (2004). A wireless pda-based physiological
monitoring system for patient transport. IEEE Trans-
actions on Information Technology in Biomedicine,
8(4):439–447.
Mietus, J. E., Peng, Ivanov, P., and Goldberger, A.
(2003). Hilbert transform based sleep apnea detec-
tion using a single lead electrocardiogram (apdet).
http://www.physionet.org/physiotools/apdet/.
Mietus, J. E., Peng, C. K., Ivanov, P. C., and Goldberger,
A. L. (2000). Detection of obstructive sleep apnea
from cardiac interbeat interval time series. Computers
in Cardiology, 27:753–756.
Penzel, T., McNames, J., de Chazal, P., Raymond, B., Mur-
ray, A., and Moody, G. (2002). Systematic compari-
son of different algorithms for apnoea detection based
on electrocardiogram recordings. Medical & Biologi-
cal Engineering & Computing, 40:402–407.
Schwarz, G. (1978). Estimating the dimension of a model.
The Annals of Statistics, 6:461–464.
Young, T., Palta, M., Dempsey, J., Skatrud, J., Weber,
S., and Badr, S. (1993). The occurence of sleep-
disordered breathing among middle-aged adults. New
England Journal of Medicine, 328:1230–1235.
SCREENING OF OBSTRUCTIVE SLEEP APNEA BY RR INTERVAL TIME SERIES USING A TIME SERIES
NOVELTY DETECTION TECHNIQUE
575
