
SUPPORTING GEOGRAPHICAL MEASURES THROUGH A
NEW VISUALIZATION METAPHOR IN SPATIAL OLAP
Sandro Bimonte, Anne Tchounikine
Laboratoire d'InfoRmatique en Images et Systèmes d'information UMR CNRS 5205
INSA, 7 avenue Capelle 69621 Villeurbanne Cedex, France
Sergio Di Martino, Filomena Ferrucci
Dipartimento di Matematica e Informatica
Università di Salerno, Via Ponte don Melillo 84084 Fisciano (SA) – Italy
Keywords: Spatial OLAP, Data Visualization, Spatial Decision Support Systems, Human Computer Interaction.
Abstract: Pivot tables are the de-facto standard paradigm for the visualization of data in the context of
multidimensional OLAP analysis. However it is recognized that they are not suited, in their original
definition, to support spatio-temporal data analysis (and in particular geographical measures). In this paper,
we propose the GeOlaPivot Table, a visual metaphor intended as an extension of the pivot tables
specifically conceived to assist decision makers in analyzing geographical measures in spatial data
warehouses. In order to show the analysis capabilities of our metaphor we describe it using an example
concerning the supervision of infectious diseases in Italy. This approach represents a first effort in adapting
advanced geovisualization techniques to SOLAP ones, in order to create a specific visual paradigm for
Spatial OLAP able to effectively support and fully exploit spatial multidimensional analysis process.
Moreover, we present an architecture for a web-based environment able to support geographical measures in
SOLAP analyses exploiting the GeOlaPivot Table visual metaphor.
1 INTRODUCTION
Nowadays organizations are collecting in Data
Warehouses even more and more heterogeneous
information, often containing precious but hidden
information. OLAP (OnLine Analytical Processing)
systems support the Decision Makers in discovering
this concealed information, by allowing him/her to
interactively explore the multidimensional database
through a visual interactive user interface.
Indeed, the main strength of these solutions is
the possibility to gain an insight into the data,
allowing the user to discover unknown phenomena,
patterns and data relationships without requiring
him/her to master neither the underlying
multidimensional structure of the database, nor
complex multidimensional query languages (Stolte
et al. 2002). For these reasons, OLAP solutions are
widely and successfully adopted in many business
contexts.
(Franklin, 1992) has shown that about 80% of
the data stored in databases integrates some kind of
spatial information. It is clear that a fully
exploitation of spatial data into decisional process
could add a lot of significance to the analytical
process. On the other hand, it is also clear that if the
spatial dimension is treated as any other descriptive
dimension, without consideration for the
cartographical component of the data, the resulting
analysis capabilities will be highly compromised.
However, current OLAP tools present serious
limitations when dealing with spatio-temporal
analysis: they lack of visual interactive maps, that,
revealing spatial trends or relationships and
stimulating user’s thinking process, represent the
main instruments to support a real and effective
spatio-temporal analysis process (MacEachren,
2001).
To overcome these limitations, previous
researches on integration of spatial information into
multidimensional models leaded to the definition of
the Spatial OLAP (or SOLAP) concept (Bedard,
19
Bimonte S., Tchounikine A., Di Martino S. and Ferrucci F. (2007).
SUPPORTING GEOGRAPHICAL MEASURES THROUGH A NEW VISUALIZATION METAPHOR IN SPATIAL OLAP.
In Proceedings of the Ninth International Conference on Enterprise Information Systems - HCI, pages 19-26
DOI: 10.5220/0002371100190026
Copyright
c
SciTePress
1997). SOLAP solutions usually lie on coupling
OLAP functionalities, used to provide
multidimensionality, and Geographic Information
Systems (GIS) functionalities, used to store and
visualize the spatial information (Rivest et al, 2005).
These solutions, thanks to a cartographic
representation of the multidimensional data, permit
to visualize measures on map and to discover
geographical correlations between facts and
members. It is worth pointing out that common GIS
techniques, such as Overlay or MultiMaps, are not
appropriate. This because the Overlay, even if
reveals spatial relations, hides the precious
information that a measure could belong to different
layers (a spatial measure could be associated to
different combination of level members), while
MultiMaps are conceived to emphasize thematic
relations rather than spatial ones.
Even if the numerous ongoing works
(Malinowski, E., and Zimányi 2005), (Bimonte et al
2006), (Kouba et al 2000) confirm the importance
and the innovating character of SOLAP, a detailed
analysis of capabilities of current SOLAP tools
reveals that many further enhancements are required
in their user interfaces. In particular, at best of our
knowledge, currently there are no SOLAP tools
offering the possibility to visually compare
geographical measures (for instance to compare
areas of two regions affected by some kind of
phenomenon). This is a crucial task in the analytical
process, since it can take advantage of human
abilities to perceive visual patterns and to interpret
them.
To address this issue, in this paper we propose a
new visualization metaphor, named GeOlaPivot
Table, especially suited to deal with spatial measures
in SOLAP environments. It exploits the concept of
Pivot Table, adding to it a 3
rd
dimension by using the
Space-Time Cube (Hägerstrand, 1970) 3D
representation. In this way, it is possible to overlap,
into a single and coherent visual representation,
different layers of information, thus permitting to
evaluate the relationships among the geographical
measures. To better explain the usefulness of the
proposal, we provide an example of application to a
real Spatial Data Warehouse concerning the
supervision of infectious diseases in Italy.
Moreover, we also propose a user interface and
an architecture for a web based SOLAP solution,
supporting the GeOlaPivot Table metaphor, starting
from existing (S)OLAP frameworks.
The remainder of the paper is structured as
follows. Section 2 describes the main OLAP and
SOLAP concepts and provides a panorama of
existing SOLAP tools. In Section 3 we describe our
GeOlaPivot Table visualization metaphor and the
case study. In Section 4 we introduce the
architecture and the user interface of a solap tool
supporting the GeOlaPivot Table methaphor
together with the main technical issues we deal with.
Some final remarks and future work conclude the
paper.
2 OLAP AND SOLAP
In Data Warehouse systems, data is usually
modelled conforming to the multidimensional model
(Immon, 1992): analysis axes are dimensions, that
can be organized into hierarchies, and the subject of
the analysis is a fact, described by several numerical
measures. This approach permits the Decision
Maker to explore the Data Warehouse at different
levels of details, from aggregated to detailed
measures. Typical OLAP operators are Slice
(selection of a part of the dataset), Dice (eliminate a
dimension), RollUp (moves up into a dimension
hierarchy) and DrillDown (reverse of RollUp).
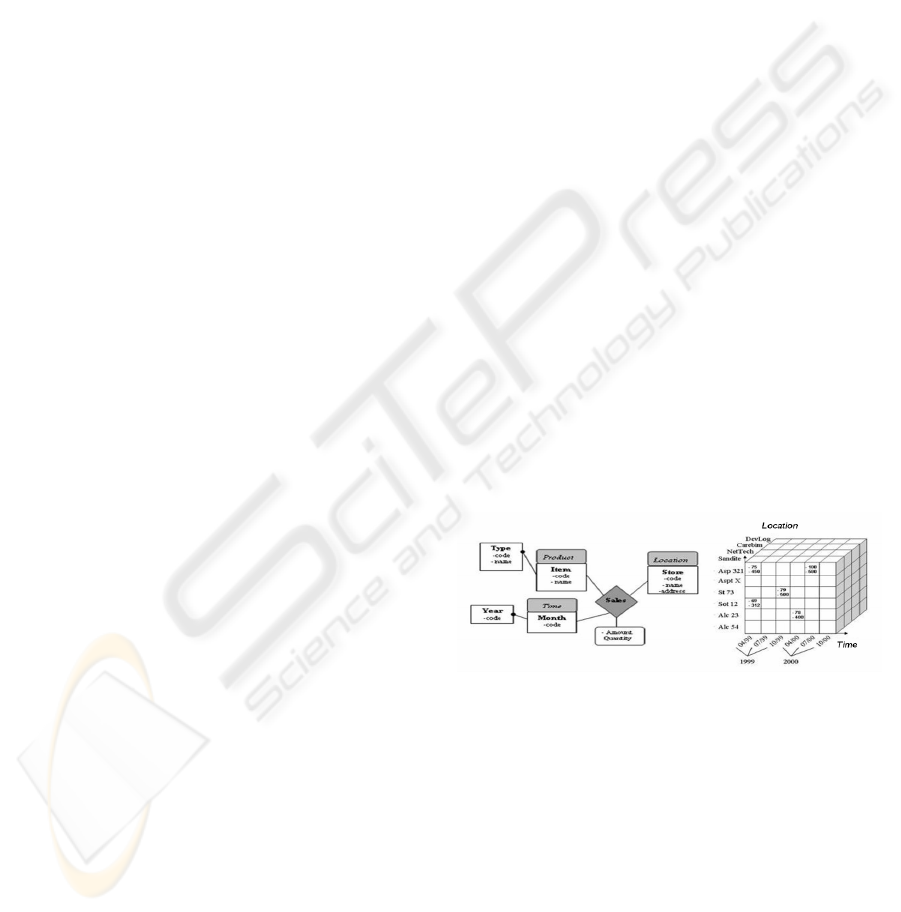
An example of OLAP multidimensional analysis
carrying on a fact “sales” of a stores chain can be
realized defining as measures “quantity” and
“amount” of sold products, and as dimensions
“Time” (Month<Year), “location”, and “product”
(Item<Type). Figure 1 represents the
multidimensional model for this application and its
measure values (the cells of the cube). Thus, an
OLAP query in our example can be: “What are the
volume and the amount for all the sold products Alc
54 in 1999 in the store Carebim?
Figure 1: “Sales” OLAP application: multidimensional
model and cube values.
OLAP decision making process is interactive
and iterative, so OLAP tools have to support the user
into this kind of particular decisional process by a
simple interaction with the user interface, translating
his/her actions into OLAP operators.
Integration of spatial data in OLAP systems
brings to two new concepts: spatial dimension
(Bedard et al, 2001) and geographical measure
(Bimonte et al 2005). The former is a hierarchy of
members with alphanumeric and spatial attributes,
while the latter extends the classical concept of
ICEIS 2007 - International Conference on Enterprise Information Systems
20

measure, being not only a numeric value but also a
set of alphanumeric and spatial inter-dependent
attributes having a meaning as whole, or in other
terms a geographical object.
2.1 (S)OLAP Visualization Issues
In order to effectively support OLAP analysis of
multidimensional databases, some specific
interaction metaphors are required to present and
browse data.
The Pivot Table is the most used visualization
paradigm for OLAP tools, due to its intrinsic
characteristics of incorporating the multidimensional
structure of the Data Warehouse and the visual
support for an easily measures’ comparison.
Basically, a Pivot Table is a 2D spreadsheet with
associated subtotals and totals that supports viewing
more complex data by nesting several dimensions on
the x- or y-axis and displaying data on multiple
pages. Pivot tables generally permit to interactively
select a subset of the data warehouse and change the
displayed level of detail.
As a result, Pivot Tables are a very powerful
interaction metaphor, to support the browsing of
alphanumerical Data Warehouses, and it is
implemented in almost all OLAP tools (Pende,
2005), (Thomsen and Pedersen, 2005). However the
Pivot Table, in its original formulation has the
inherent constraint to be limited to deal with
alphanumeric information, thus turning out to be
inadequate with spatial data.
It is worth pointing out that some OLAP
solutions (e.g. (Stolte et al., 2002)) have extended
the pivot table concept with graphic representations
and visual variables (shape, size, etc…). Following
this approach, cells of the pivot table are graphic
canvas which collapse using visual variables
members of a same hierarchy levels into a unique
visual description. The main advantage of this
approach is to effectively support the user in data
comparison.
2.2 SOLAP Tools
The introduction of cartographic data in the
(S)OLAP process implies a reformulation of
classical visualization paradigms, to support a
multidimensional analysis based on maps, tabular
and graphical data representation, that have a
different expressive power. Indeed a SOLAP user
interface has to support multidimensional analysis
using maps, tabular and graphical data
representation in a concerted, interactive and
synchronized way. Synchronization means that an
action (i.e. drill-down or roll-up) on one interface
widget (i.e. map) has to be replied on the other ones
(i.e. pivot table and graphic displays). Finally ad-hoc
semiology rules, or particular geovisualization
techniques as for example the choremes (Laurini et
al., 2006) for visualization of alphanumeric
measures on maps could improve the expressiveness
power of SOLAP tools.
In the following we will describe how these
problems have been tacked in the literature. Several
SOLAP tools have been developed until now. In the
following we focus on their visualization features.
(Rivest et al, 2005) describe a SOLAP tool which
supports pivot table and several different types of
diagrams and maps, composed by visual variables
and maps superimposed with graphical diagrams, for
supporting spatial dimensions, numeric measures
and spatial measure (result of topological and metric
operators on spatial dimension members. In (Scotch
and Parmanto, 2005) authors describe SOVAT, a
multidimensional spatial-numerical decision support
system. This tool permits to navigate into
multidimensional databases, and to analyze spatio-
temporal data using graphical displays, maps, and
tabular representation. SOVAT provides some
multidimensional and spatial data mining operators,
but allows user to analyse only numerical measures.
In (Voss et al, 2005) is presented CommonGIS, a
powerful tool for interactive visual geo-analytics,
extended to process hierarchical multidimensional
data from OLAP warehouses. This approach is very
different from the previous ones, since no tabular
representation of data is provided for the
multidimensional navigation, which is permitted by
means of some parametric geovisualization
techniques. Finally a commercial SOLAP tool (ESRI
2006) has been developed by ESRI and SAS,
providing a solution for spatial multidimensional
application using spatial dimensions
All these works try to introduce a link between
the cartographic representation of a dimension and
the corresponding tabular representation of the
multidimensional database, to achieve a
synchronized multidimensional navigation. Visual
representation of numeric measures on maps (spatial
dimensions) is sometime supported by
geovisualization techniques (i.e. multimaps). But
how geovisualization tools and visualization-based
techniques for exploratory analysis of spatio-
temporal data (Andrienko and Andrienko, 2005) can
be coupled for a more coherent analysis of
geographical measures and spatial dimensions rest
an open issue.
SUPPORTING GEOGRAPHICAL MEASURES THROUGH A NEW VISUALIZATION METAPHOR IN SPATIAL
OLAP
21
3 THE GEOLAPIVOT TABLE
As for numeric data, to answer the strong needing
for a visual technique suited to compare
geographical measures, according to different
members of the same hierarchy level, and to
effectively understand spatial/thematic relations
between measures, we propose the metaphor of
GeOlaPivot Table, intended as a 3-Dimensional
extension of the OLAP Pivot Table.
Our main idea is to exploit the 3
rd
dimension to
provide insight on how a spatial phenomenon
evolved in function of another factor (such as time,
or incidence), by overlapping data onto a map. To
this aim, we have combined the concept of Space-
Time Cube (Hägerstrand, 1970) (Gatalsky et al.,
2004) and Pivot Table giving rise to the notion of
GeOlaPivot Table. Indeed, cells of the Pivot Table
related to spatial data are cubes, representing into a
single, visual description measures associated to
different members of a same hierarchy level, like
previously described OLAP tools. A cube can be
rotated to obtain the best point of view, avoiding
screen and information cluttering. So, user can freely
rotate the cube on 3 axes, to analyze the dataset. The
base of the cube is associated to a spatial dimension
(if it exists) and its 3
rd
dimension to another
alphanumeric dimension. Spatial measures
associated to the same fact are depicted by the same
color. All the data that do not match the query
parameters, set by the user, are removed from the
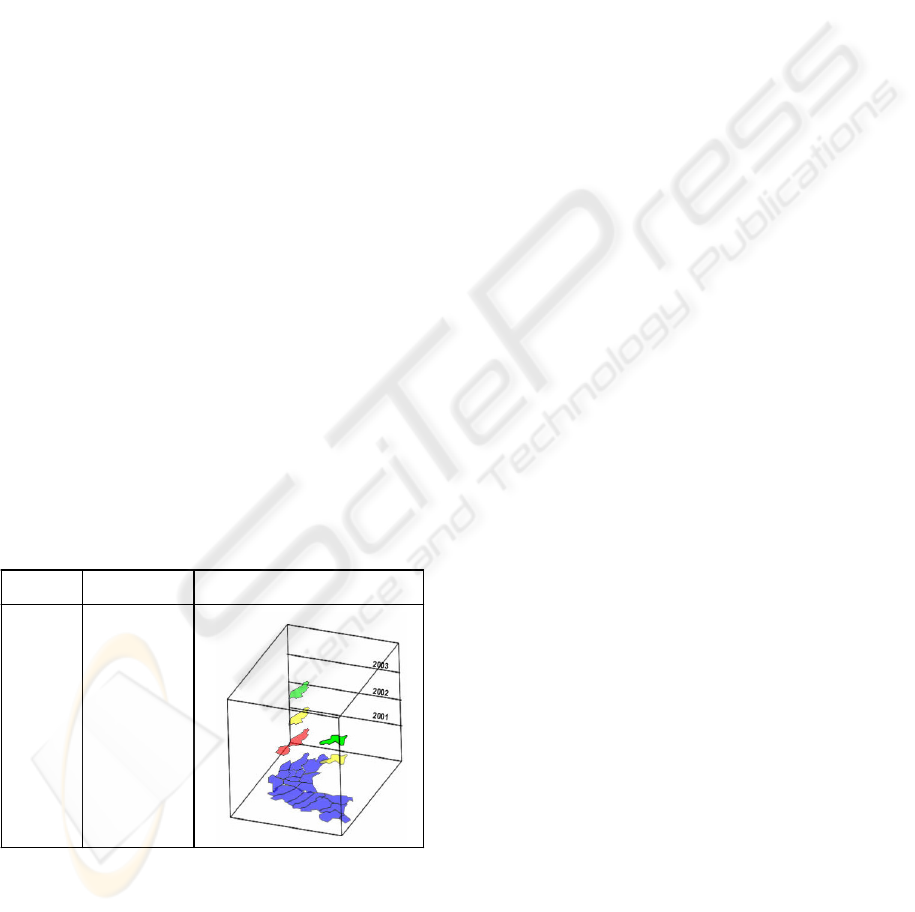
visualization cube. An example of GeOlaPivot Table
is reported in Figure 2, showing the district of the
Northern Italy affected by some infectious diseases
during the period 2001-2003.
+ Northern Italy>6.0
Time.All Time -DeptLocationIncidence
+ Northern Italy>6.0
Time.All Time -DeptLocationIncidence
Figure 2: Example of a GeOlaPivot Table.
In GeOlaPivot Table, geographical measures can
be associated to a spatial context that permits to
localize them in the space. In other terms a spatial
dimension can be present in a SOLAP application
with geographical measures. The cartographic
members of the spatial dimension will be the base of
the cube. Moreover, thematic attributes of
geographical data are necessary for an effective
decision-making process. For example, what
characterize a particular area can help decision-
maker to understand the causes of a particular
localization of a phenomenon.
As a result, the main characteristics a SOLAP
client tool based on GeOlaPivot Table are:
1. Visualization of spatial geometric dimension
and spatial measure at same time.
2. Adoption of a visualisation technique to
compare spatial and thematic relations between
measures associated to different members of a
same hierarchy level.
3. Explicit visualization of spatial relations
between measures and dimensions members.
4. Visual encapsulation of the structure of
multidimensional application.
5. Visual representation of OLAP operators
6. Display of thematic attributes of measures.
The main advantage of this approach is to
effectively support the user in data comparison. Our
proposal is an improvement of SOLAP solutions,
because it permits to coherently merge, in a single
visual environment, the key concepts of pivot tables
and Space-Time Cube. This allows us to represent
and effectively analyze geographical measures
according to spatial and alphanumeric dimensions.
3.1 A Case Study
In order to illustrate the fundamental characteristics
of the designed visualization tool, we describe a
scenario of use, exploiting data on infectious
diseases (as for example AIDS, tetanus, etc…) in
Italy. The complete dataset is freely available on the
web site of the Italian Health Institution “Istituto
Superiore di Sanità” (www.iss.it).
The multidimensional application presents as
dimension:
– Location: (Region, Nation) Spatial geometric
dimension, i.e. Lombardia, Italy.
– Time: (Year, 3 Years), i.e. 1991, 1990-1992
– Infectious Disease: (Disease, Class) A
classification of diseases according to the
International Classification of Disease, i.e. AIDS
– Incidence: (Rate) Rate of incidence of deaths by
population per 100000 inhabitants, i.e. 2,5-3,0
Districts are measures. A district is characterized
by some attributes, as the Name, the Geometry, the
Number of Hospitals and the Areaclass. The latter
one is a social-economic classification of the district,
ICEIS 2007 - International Conference on Enterprise Information Systems
22
such as “cities and services”. Aggregation functions
are spatial union for geometry, sum for the number
of hospitals and a ratio function for the areaclass. An
example of the fact table is presented in Table 1.
Table 1: Fact table of the Infectious Diseases Spatial Data
Warehouse.
Disease Time Incidence Location District
AIDS 2001 >6.0 Lombardia Piacenza
AIDS 2002 >6.0 Lombardia Brescia,
Piacenza
AIDS 2003 >6.0 Lombardia Lecco,
Piacenza
AIDS
2002 >6.0 Emilia-
Romagna
Ravenna
…
… … … …
In our case study we considered the years 2001,
2002 and 2003. If user wants to know what zone of
Italy has an incidence rate superior to 6.0 for AIDS
in the time period 2001-2003, the UI configuration
shown in figure 4 permits to answer to this question.
We notice the AIDS value in the Filter component of
the Cube Navigator and 3 Year in the Cube Axis
component. So, now the GeOlaPivot Table will
contain only one cell showing a cube which has as
base the cartographic representation of Italy, as
vertical axis the 2001-2003 time period, and a
geographical zone as internal value. It shows that the
highest incidence rate for AIDS from 2001 to 2003
regards at most north Italy districts. What
characterize this area? Answers could be found in
thematic attributes. Showing thematic attributes for
the new aggregated measure it can be noticed that
the areaclass for this area is classified as “cities and
services”.
Let us suppose that the user wishes to have a
more detailed insight of the application, and in
particular she/he wants to know what districts have
an incidence rate superior to 6.0 for AIDS for each
year.
He/she can apply the Drill-Down on the
Location dimension, by clicking on the ‘+‘ operator
at the left of Italy in the GeOlaPivot Table.
Then using the Cube Navigator he/she choices to
no more visualize measures for Italy, and through
the Cube Axis component he/she applies a drill
down operator in the Time dimension too. This
action changes the axis of the cube in the
GeOlaPivot Table, which now shows the districts
for each year. The UI configuration shown in figure
5 permits to answer to this question.
The GeOlaPivot Table permits to see that for the
region “Lombardia”, three districts are present and
in particular the district Piacenza is always present
from 2001 to 2003. Moreover these districts are all
neighboring. Changing year does not imply
changing of geographical area.
4 VIS
3
OLAP: A WEB BASED
SOLAP TOOL
We are currently developing a web-based system,
named VIS
3
OLAP, meant to provide SOLAP
features and to support geographical measures by
exploiting the GeOlaPivot Table. In this section we
present the software architecture of the system and
then we detail the mock-up of its user interface.
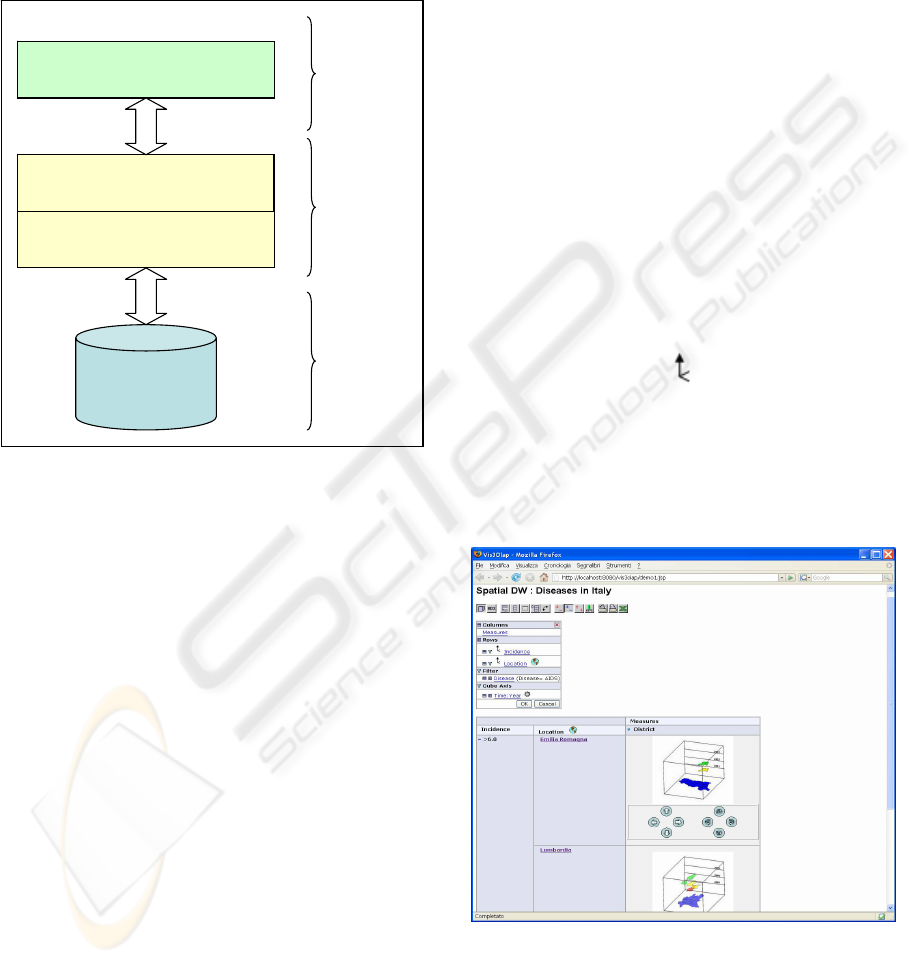
4.1 System Architecture
VIS
3
OLAP is based on a three tier architecture, as
shown in Figure 3. It consists of a DBMS able to
support spatial data, an OLAP Server, and a web
client providing the GeOlaPivot Table metaphor.
More in detail, Oracle 10g will be used to
implement the Data Warehouse tier, due both to its
native support of spatial data and to its Object-
Relational capabilities. Indeed, user-defined
aggregation functions and user defined types, which
are necessary when dealing with spatial data, can be
easily implemented over an Object-Relational
DBMS. Moreover Oracle’s native support for spatial
data ensures scalability and security to spatial
multidimensional applications.
For the OLAP tiers, two widely-adopted, free
tools for OLAP applications will be employed:
Mondrian (Mondrian 2006) and JPivot (JPivot,
2006).
The former is a software package designed to
provide OLAP functionalities in an open and
extensible framework, on the top of a relational
database. This is achieved by means of a set of
JAVA APIs, that can be used for writing
applications, such as a graphical interface, for
browsing the multidimensional database. These
APIs can also be invoked by JSP/Servlets, within a
web environment. Mondrian includes a Calculation
layer, that validates and executes MDX
(Multidimensional Expressions) queries, and an
Aggregation layer that controls data in memory and
request data that is not cached. MDX is a standard
language to query multidimensional databases, just
like SQL for the relational ones. In order to
guarantee the greatest flexibility, to interface the
relational data, an XML description of the
multidimensional application has to be written.
JPivot is a software package designed for
providing a web-based, graphical presentation layer
on top of Mondrian. It provides specific JSP tags for
SUPPORTING GEOGRAPHICAL MEASURES THROUGH A NEW VISUALIZATION METAPHOR IN SPATIAL
OLAP
23
easily building powerful graphical interfaces, suited
to explore the data warehouse.
In order to implement the visual metaphor of the
GeOlaPivot Table in this system, JPivot’s APIs
should be deeply modified, to generate on-demand,
within the cells, the 3D cube. Details about data
presentation are provided in the next section.
Spatial
Data
Warehouse
Calculation
Aggregation
Presentation
Mondrian
Oracle
Spatial
Modified
JPivot +
Ajax
Figure 3: The System Architecture.
4.2 The User Interface
In an environment like the one described in the
previous section, a Knowledge Engineer can query
the Spatial Data Warehouse by defining the analysis
dimensions and the level of detail to use, to get
insight on spatial relationships occurring among
data. In particular, a direct manipulation of both
attributes and depicted values is allowed. To this
aim, the interface should propose some widgets to
carefully select the information to deal with, which
will be rendered in 3D using the GeOlaPivot Table.
To clarify the main aspects of the GeOlaPivot
Table, we have developed a mock-up of the User
Interface (UI) of the visualization tool meant to
support the proposed metaphor (see figure 4 and 5).
This UI is aimed at providing an interactive
environment which graphically encapsulates the
structure of the multidimensional application and
translates interactions with the visual interface into
operators.
The UI is an extension of the standard one
provided by JPivot, and is composed by two main
blocks: the OLAP tool bar, and the GeOlaPivot
Table. The former set of controls provides
functionalities to navigate in the cube, affecting the
pivot table in several way: drill-down replace, drill-
down position, expand-all, drill-through.
The drill-down replace enables drilling from one
pointed member to its child members in the
dimension hierarchy, hiding the parents. drill-down
position enables drilling from one pointed member
to its child members, still showing the members of
the initial higher level in the table. The expand-all
operator enables drilling from all visible members in
the table to child members. Moreover the OLAP tool
bar permits through the Cube Navigator tool to
select dimensions, levels and members to display.
This browser is used by the user in order to map the
hierarchies on table axes and to express selection of
members to slice or dice the cube. Finally the Cube
Navigator permits to select the level’s members to
be used as vertical axes of our cube metaphor by the
icon:
The GeOlaPivot Table is used to show in 3D, at
an arbitrary detail level, the geographical data. It
allows for 6 Degree of Freedom, achieved through
some specific buttons placed at the bottom of the
cube.
Figure 4: Districts in GeOlaPivot Table.
ICEIS 2007 - International Conference on Enterprise Information Systems
24
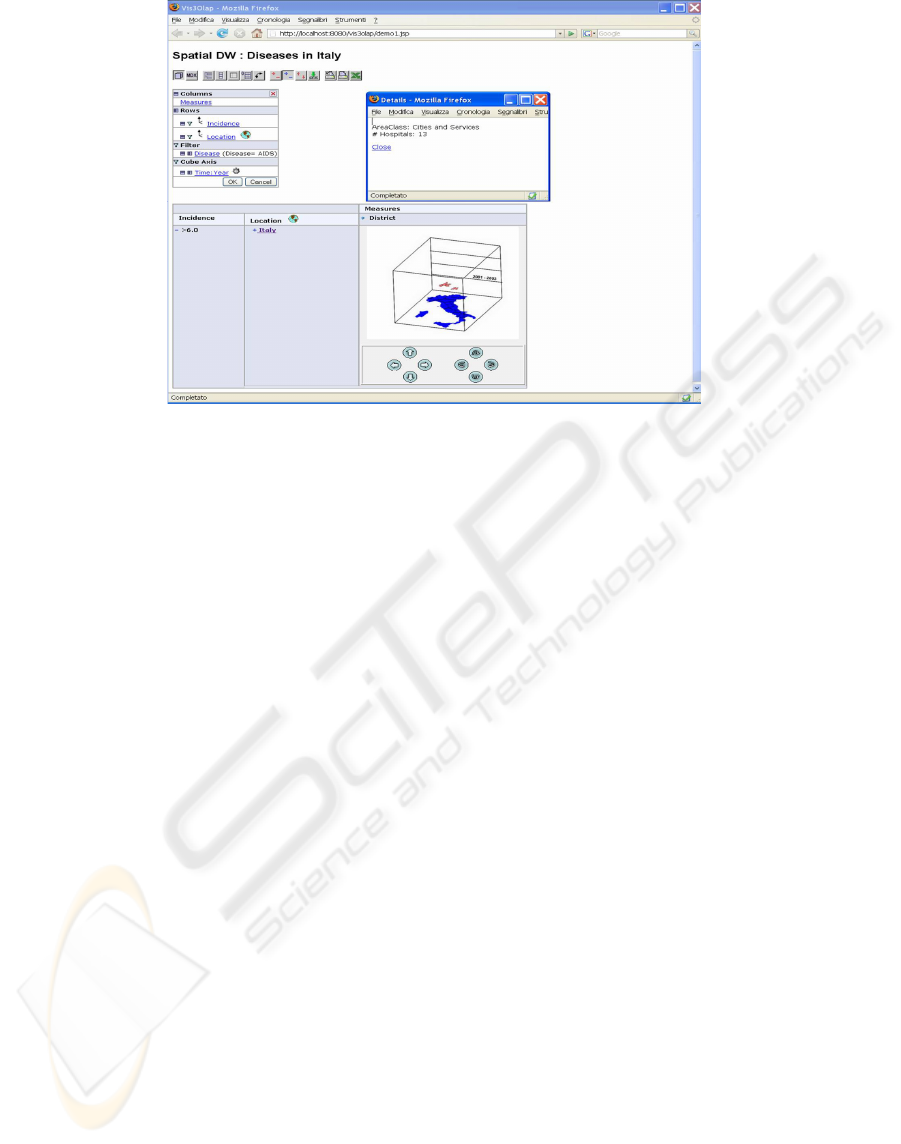
Figure 5: An example of User Interface with Aggregation of Districts in GeOlaPivot Table.
In our opinion, one of the most critical
implementation aspects could be the generation of
the 3D cubes with the underlying map, since it
requires (I) to rasterize the vectorial geographical
information provided by Oracle Spatial (this could
be achieved by many APIs), and (II) to project this
bitmap on the base of the cube, with the
corresponding perspective adjustments
5 CONCLUSIONS AND FUTURE
WORK
The growing amount of spatial information in Data
Warehouses leads to the formulation of the SOLAP
concept. Indeed, it is a key technology to take full
advantage of the knowledge concealed within
enterprise datasets, and many efforts are being
devoted in this field to provide Decision Makers
with powerful analysis tools. However, when
introducing geographical measures in the SOLAP
domain, many problems arise, mainly because there
isn’t a widely accepted interaction metaphor to
support comparisons of spatial measures.
In this paper, starting from an analysis of
existing SOLAP tools, revealing a lack in the
support of geographical measures, we have firstly
proposed the metaphor of GeOlaPivot Table, which
coherently merges, in a single visual environment,
the key concepts of Pivot Tables and Space-Time
Cube. This approach represents a first effort in
adapting advanced geovisualization techniques to
SOLAP ones, in order to create a specific visual
paradigm for Spatial OLAP able to effectively
support and fully exploit spatial multidimensional
analysis process.
A preliminary case study has been described,
presenting a possible application of our metaphor to
a spatial Data Warehouse concerning the supervision
of infectious diseases in Italy.
Then, we have illustrated the main issues about
the development of a web-based environment
exploiting the GeOlaPivot Table visual metaphor to
support geographical measures in SOLAP analyses
and a three tier architecture has been described.
Currently we are working on the implementation of
the proposed architecture. In particular, for the
development of the Graphical User Interface able to
present the 3D cube of the GeOlaPivot Table, we are
currently experimenting the use of AJAX
technology, in order to significantly reduce the
amount of network traffic, and consequently the
latency of the user interface. It is worth to remark
that the projection of raster maps within the cubes
could require significant programming efforts. Thus,
we plan to develop an API supporting this kind of
task.
About future work, we would like to extend the
GeOlaPivot Table with adequate graphic semiology
rules to visualize thematic attributes of spatial
dimensions and measures and by introducing
chorems in order to visualize spatial trends.
REFERENCES
Andrienko N., Andrienko G., 2005. Exploratory Analysis
of Spatial and Temporal Data A Systematic Approach
Approx. Springer-Verlag,
SUPPORTING GEOGRAPHICAL MEASURES THROUGH A NEW VISUALIZATION METAPHOR IN SPATIAL
OLAP
25

Bédard, Y. 1997. Spatial OLAP. 2ème Forum annuel sur
la R-D, Géomatique VI: Un monde accessible, 13-14
novembre 1997, Montréal, Conférencier invité
Bédard, Y., Merrett, T., and Han, 2001. Journal of
Fundaments of Spatial Data Warehousing for
Geographic Knowledge Discovery. Geographic Data
Mining and Knowledge Discovery. Taylor & Francis,
London, 53-73.
Bimonte S., Tchounikine A., Miquel M., 2005. Towards a
Spatial Multidimensional Model, In Proceedings of the
8th International Workshop on Data Warehousing and
OLAP (DOLAP 2005), ACM Press, New York, USA,
39-46.
Bimonte S.,Wehrle, P., Tchounikine, A., Miquel, M.
GeWOlap: a Web Based Spatial OLAP Proposal,
Second International Workshop on Semantic-based
Geographical Information Systems (SeBGIS'06),
Montpellier, France, 29-30 October, 2006
Brunet R., 1980. La composition des modèles dans
l'analyse spatiale». L'Espace géographique, 4, 253-
265.
Franklin, C., 1992 An Introduction to Geographic
Information Systems: Linking Maps to databases.
Database. 13-21.
ESRI 2006. Web site of
http://www.esri.com/software/arcgis/extensions/olap/a
bout/overview.html. Last visited on December, 07,
2006
Gatalsky P., Andrienko N., and Andrienko G., 2004.
Interactive Analysis of Event Data Using Space-Time
Hägerstrand T., 1970. What about people in regional
science? Papers, Regional Science Association, 24, 7-
21.
Hernandez, V. Voss A. Göhring, W. Hopmann, C. 2005.
Sustainable decision support by the use of multi-level
and multi-criteria spatial analysis on the Nicaragua
Development Gateway. In: From pharaohs to
geoinformatics Proceedings of FIG Working Week
2005 and 8th International Conference on the Global
Spatial Data Infrastructure, Cairo, Egypt,
Inmon W. H., 1992. Building the data warehouse. Edition
John Wiley and sons.
JPivot 2006. The JPivot Project web site:
http://jpivot.sourceforge.net/. Last visited on
December, 07, 2006
Kouba Z., Matoušek K., and Mikšovský P., 2000. On Data
Warehouse and GIS integration. In Proceedings of the
11th Int. Conf. and Workshop on Database and Expert
Systems Applications, Greenwich, UK.
Laurini R., Milleret-Raffort F., Lopez K. 2006. "A Primer
of Geographic Databases Based on Chorems". In
proceedings of the SebGIS Conference, Montpellier,
Published by Springer Verlag LNCS 4278.
MacEachren, A. M., 2001. An evolving cognitive-semiotic
approach to geographic visualization and knowledge
construction. Information Design Journal, 10(1), 26-
36, 2001
Malinowski, E., Zimányi, E. 2004. Representing spatiality
in a conceptual multidimensional model. In
Proceedings of the 12th annual ACM International
workshop on Geographic information systems.
(Washington DC, New York, USA, 2004), ACM
Press, 12-22.
Malinowsky, E. and E., 2005. Spatial Hierarchies and
Topological Relationships in SpatialMultiDimER
model. In Proceedings of the 22th British National
Conference on Databases (Sunderland UK, July 2005),
LNCS 3567, Springer, 17-28
Mondrian 2006. The Mondrian Project web site:
http://mondrian.pentaho.org/. Last visited on
December, 07, 2006
Pendse, 2005. http://www.survey.com/olap/
Rivest, S., Bédard Y., and Marchand P. 2001. Toward
Better Support for Spatial Decision Making: Defining
the Characteristics of Spatial On-Line Analytical
Processing (SOLAP). Geomatica, 55, 4 (2001), 539-
555.
Rivest, S., Y. Bédard, M.-J. Proulx, M. Nadeau, F. Hubert
& J. Pastor, 2005, SOLAP: Merging Business
Intelligence with Geospatial Technology for
Interactive Spatio-Temporal Exploration and Analysis
of Data, Journal of International Society for
Photogrammetry and Remote Sensing (ISPRS)
"Advances in spatio-temporal analysis and
representation, Vol. 60, No. 1, pp. 17-33
Scotch, M. and B. Parmanto, 2005. “SOVAT: Spatial
OLAP Visualization and Analysis Tool.” In
Proceedings of HICSS-38. Waikoloa, HI: IEEE.
Stefanovic, N., Han, J., and Koperski K., 2000. Object-
Based Selective Materialization for Efficient
Implementation of Spatial Data Cubes. IEEE TKDE,
12, 6 (2000), 938-958.
Stolte C., Tang D., Hanrahan P., 2002. Polaris: A System
for Query, Analysis and Visualization of Multi-
dimensional Relational Databases (extended paper)
IEEE Transactions on Visualization and Computer
Graphics, Vol. 8, No. 1, January 2002
Tchounikine, A., Miquel M., Laurini, E., Ahmed, T.,
Bimonte, S. and Baillot, V. 2005. Panorama de
travaux autour de l’intégration de données spatio-
temporelles dans les hypercubes. Revue des Nouvelles
Technologies de l'Information (RNTI), Editions
Cepaduès, numéro spécial.
Thomsen C., Torben B., 2005. A Survey of Open Source
Tools for Business Intelligence. DaWaK 2005: 74-84
ICEIS 2007 - International Conference on Enterprise Information Systems
26
