
KEXPLORATOR: A 2D MAP EXPLORATION USER INTERFACE
FOR RECOMMENDER SYSTEMS
Gulden Uchyigit, Keith Clark and Damien Coullon
Department of Computing, Imperial College, London SW7 2BZ
Keywords:
Recommender Systems, User Interfaces, Map Exploration.
Abstract:
Recommender systems have reached some maturity and are getting more widely used with the rise of online
social networks. However, research until now was mostly focused on improving the recommendation engines,
without really advancing the way the recommendations were brought to users. This paper concentrates on
improving the delivery of recommendations to users via a new algorithm to allow for generation and 2D
visualisation of similarity networks with an emphasis on map stability. An implementation with a connection
to the Amazon recommendation engine has been developed.
1 INTRODUCTION
Recommender systems can be defined as “any system
that guides the user in a personalised way through a
set of items”. The guidance can be explicit in the form
of personalised recommendations, but it can also take
the form of personalised browsing. Their domain of
application is very wide, ranging from the most obvi-
ous like culture discovery (books, music, movies) and
news personalisation to user segmentation and match
making or even group recommendation when a group
of people have to take a decision together, for exam-
ple which movie to watch as a group.
Recommender systems are divided into two main
categories: Content-based and Collaborative-based.
Content-based recommender systems (Pazzani and
Billsus, 1997), (Mladenic, 1996), (Balabanovic and
Shoham, 1995), (Armstrong et al., 1995) infer a user’s
profile from the contents of the items the user has seen
and rated, and recommends additional items of inter-
est according to this profile. In contrast, Collabora-
tive recommender systems (Kautz et al., 1997), (Her-
locker et al., 1999), (Goldberg et al., 1992), (Terveen
et al., 1997) make recommendations to the user by
collecting human judgements (known as ratings) for
items in a given domain and correlating people who
share the same information needs.
Over the past decade there has been a lot of de-
velopment in the area of recommender system algo-
rithms. But not much attention has been given to
the user interfaces of recommender systems (Sinha,
2002). Often recommendations are displayed to the
user as a simple ranked list. In this paper we present a
novel method of allowing users to explore recommen-
dations via an exploratory map, consisting of nodes
and arcs. The recommended items are the nodes and
the distance between the nodes, represented by the
arcs are the measure of similarity of the items. The
system uses a novel map placement algorithm. The
Kexplorator system is presented, which uses the new
map placement algorithm. The Kexplorator system
is a generic user interface system which can be used
with any recommender system engine. In this paper
we present Kexplorator working as a user interface to
Amazon’s recommendation engine.
2 OVERVIEW OF THE
KEXPLORATOR SYSTEM
The Kexplorator user interface (see Figure 1) is di-
vided into three parts the command centre, the map
viewer and the information centre. The command
centre consists of a control panel and a query zone.
The control panel allows for language selection and
item selection (e.g books, CDs, DVDs). The query
zone allows for query entry, such as entering a book ’s
223
Uchyigit G., Clark K. and Coullon D. (2007).
KEXPLORATOR: A 2D MAP EXPLORATION USER INTERFACE FOR RECOMMENDER SYSTEMS.
In Proceedings of the Ninth International Conference on Enterprise Information Systems - HCI, pages 223-228
DOI: 10.5220/0002365802230228
Copyright
c
SciTePress
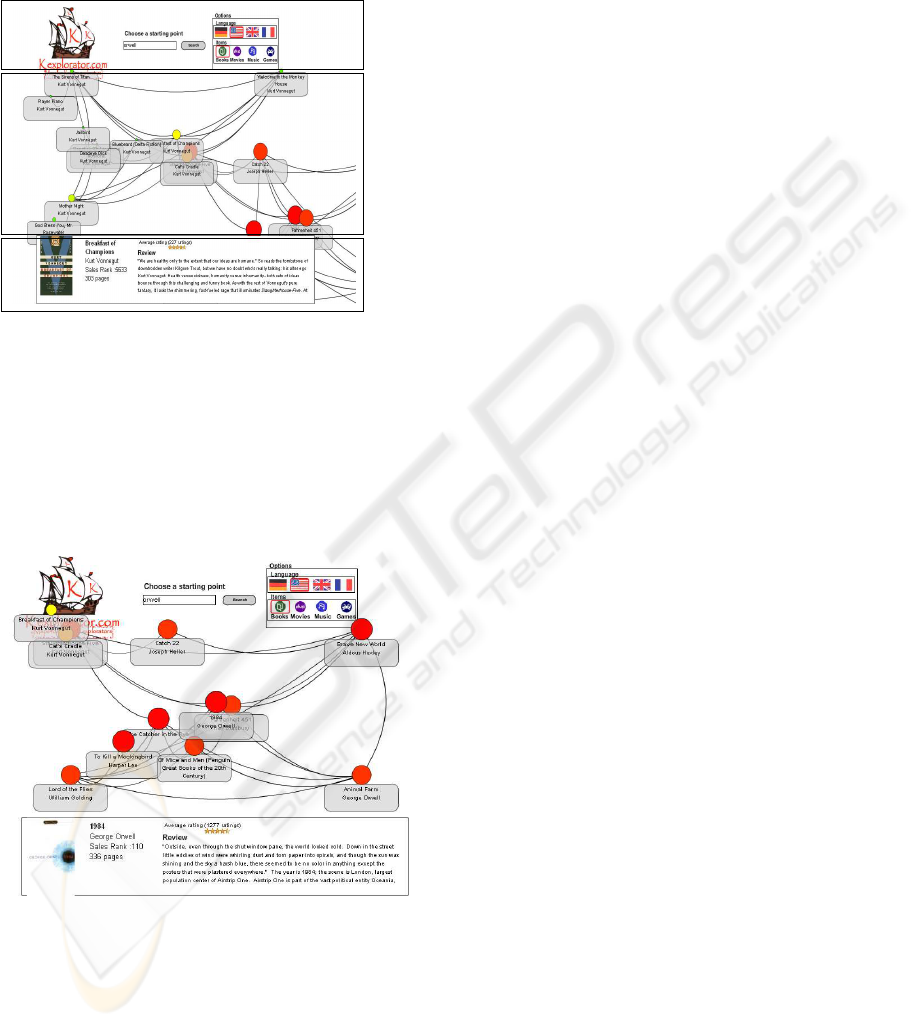
title or an author’s name, to begin the exploration pro-
cess. The map viewer holds the current exploration
map. The information centre displays additional in-
formation on the item currently selected.
Command
Centre
Exploratory
Map
Additional
Information
Centre
Figure 1: The Kexplorator User Interface.
To begin the exploration process and to generate
the exploration map (see Figure 2), the user needs to
enter a search query. The most highly recommended
item to the user’s search query acts as the starting
point of the exploration process and will be placed
at the centre of the map, a similarity network is then
generated around this item.
Figure 2: Exploratory Map created for the item Orwell.
The user can explore the recommendations by
clicking on the items (nodes). This causes the map to
smoothly translate so that the clicked item moves to
the centre of the map. The similarity network around
the clicked item is updated and the map is expanded.
The items discovered appear slowly with a fade in.
Smooth transition when expanding the map is neces-
sary to preserve the mental map for the user (P.Eades,
1995), this is especially important for a visual rep-
resentation of recommendations. The choice of al-
lowing map translation only for the clicked items has
been made to allow the system to collect user’s brows-
ing behaviour, by inciting the user to click on items
of interest, the user’s browsing trail can be collected.
One of our future works is to use the users brows-
ing behaviour on the map. For instance the width of
the arcs can be used to represent the number of users
which followed that path. This information can assist
the user in browsing the items.
At any time, the user can load another map by sim-
ply restarting the process with a new starting point
query.
The nodes on the map are different colours and
sizes. The size and colour of nodes convey extra in-
formation to the user, regarding the popularity of the
item. For instance, smaller nodes indicate that the
items are less popular than the items represented by
larger nodes.
Additional information such as sales rank (popu-
larity), reviews, average user rating, is given on the
last clicked item, in the information box.
3 THE MAP GENERATION
ALGORITHM
The algorithm is divided into two parts the generation
of the neighbourhood and generation of the map.
3.1 Neighbourhood Generation
An item’s neighbourhood is the collection of the clos-
est items to it. By closest we mean those items which
are similar. Similarity can differ in different recom-
mender systems. For instance a recommender sys-
tem which uses user ratings for the recommendations
the similarity may represent the similarity of the rat-
ings of the items and in a recommender system which
utilises the content of the items the similarity may rep-
resent the similarity of the content of the items. To
this end the similarity is different for different recom-
mender systems.
The idea of locality in a map is crucial in which
humans perceive data, we don’t look at the whole map
from a centralised point, but rather by navigating from
one point to the next. In Kexplorator, the concept of
the item neighbourhood is designed to resemble this
behaviour. The item neighbourhood is the iterative
process of making a limited number of requests about
the surrounding items.
At the start of the exploration phase a similarity
network is generated which is generally a sparse ma-
ICEIS 2007 - International Conference on Enterprise Information Systems
224

trix representing the similarity network for the start-
ing neighbourhood. Generation of the similarity net-
works is based on the idea of level browsing. At the
initial level there are the items which are similar to
the starting item, next level are the items which are
similar to those items and so on.
3.2 Transforming a Generic Similarity
Measure into a Visual Distance
To place points onto the map we need to transform
generic similarities into visual distances. To do this
we use our algorithm. The algorithm works provid-
ing the point to be placed has at least two links which
are already placed on the map. We compute the (x,y)
coordinates of point A (i.e the point to be placed) us-
ing the following formulae.
x =
∑
i∈Ω
(x
i
∗ s(A, i))
∑
i∈Ω
(s(A, i))
y =
∑
i∈Ω
(y
i
∗ s(A, i))
∑
i∈Ω
(s(A, i))
where, Ω is the set of the indices’s of the items
that are linked to the points that are already placed,
s(A, i) is the similarity of point A with point i, where
point i is already placed.
3.3 Optimising Arbitrary Item Selection
The order in which we select items has an impact on
the representation of the neighbourhood. A point can
be placed if:
• it has at least a link with two different points al-
ready placed, in which case, we use the algorithm
above to place the item.
• it has only one link to a single point, which is al-
ready placed and we place this point in the next
available arbitrary position near to the point al-
ready placed.
When we start the drawing of the map or whenever we
can’t place anymore items because of the sparseness
of the similarity matrix, we have to choose some items
to be placed arbitrarily. The simplest way of doing
this is by arbitrarily choosing the first item not yet
placed.
Each time we place an item arbitrarily, we in-
troduce some distortion in the representation of the
neighbourhood. We would then like to minimise the
number of times we do this. One way, would be to
select the item with the highest number of direct links
for arbitrary placement. This technique should be re-
fined by counting only the items not yet placed in the
number of direct links, since they are those who could
potentially cause us to select again an item to place
arbitrarily. Furthermore, we could only count links
to items not already placed that would become place-
able, which are the items that have at least one link
with one already placed item and items that have only
one link with the current item.
4 IMPLEMENTATION DETAILS
We used Flash 8.0 with ActionScript, for the imple-
mentation of the system. An emphasis was given to
the generality of the system, so that nearly any kind
of similarity measure and any recommender engine
could be connected to it. The first choice was to de-
fine an XML input interface. An XSLT style sheet
was designed to make sure the response of the rec-
ommender engine would conform itself to the pre-
vious schema. For this particular implementation,
we decided to make a connection to the Amazon E-
Commerce Web Service. There were a couple of other
possibilities for a connection with a recommendation
engine, like Last.fm, but Amazon had two key ad-
vantages: a proven history and support for this web-
service, as well as a huge database, available for many
kinds of items in different languages.
Once the similarity network is constructed, we
used the map placement algorithm, separating the
construction of the map in two phases: initial map
construction, then additional map redrawing. The
whole process was designed in order to be able to
switch from one recommendation engine to another
relatively quickly, as well as being able to add more
options during the implementation phase. We first
tried to make a working proof with a simple “book
only, Amazon.com only” connection.
5 EVALUATIONS
The system was evaluated by users using the system
and answering a set of questions. The questions were
designed to assess the quality of the recommendations
received by the user, the efficiency of the system and
the overall look and feel of the system.
5.1 Recommendations
The goal of this part of the test was to assess the qual-
ity of the recommendations that the users received
whilst using the system.
A hefty majority of users managed to find at least
one item that they didn’t previously experience, but
KEXPLORATOR - A 2D Map Exploration User Interface for Recommender Systems
225
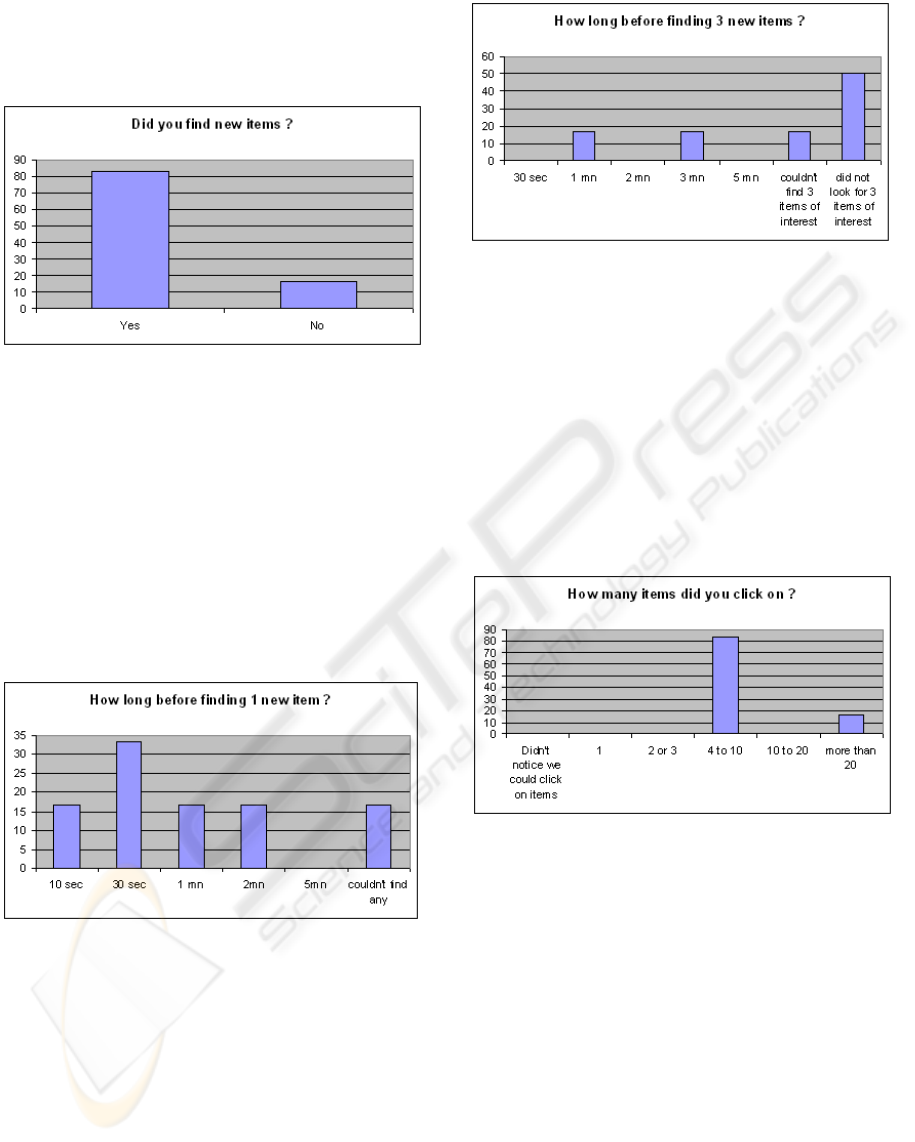
that they liked (see Figure 3). The provision of such
recommendation is the goal of the system, and this
means that one of its objectives has been fulfilled.
Figure 3: Ability to find useful recommendations, which
are items that they have not previously experienced, but that
they think they will probably appreciate.
Measuring the time needed by the user to get good
recommendations is important in order to assess its
efficiency (see Figure 4). With an average time of 1
minute, we can consider that the system is quite effec-
tive, although it might be improved on this point, for
example by accelerating familiarisation with the sys-
tem for new users. The efficiency is certainly better
for experienced users.
Figure 4: Time needed to find one useful recommendation.
Figure 5 shows the time needed to find three useful
recommendations.
This result is actually quite surprising. We didn’t
expect users to stop their search after just finding one
item, but some were satisfied with that. Here, the av-
erage time to discover three good recommendations
is 90 seconds for users that managed to find at least
three items, which amounts for less than half of the
total number of users. This average time is good, but
the fact that it was reached by less than half of the
testers was quite disappointing.
Figure 5: Time needed to find 3 useful recommendations.
Notice that many users were not even looking for 3 new
items.
5.2 Session
This section was focused on studying the behaviour
of users while using the system. The average dura-
tion of a session on Kexplorator was found to be over
6 minutes, with durations ranging between 1 and 15
minutes. This is inside the range of duration we were
expecting (see Figure 6).
Figure 6: Distribution on the number of items clicked per
session.
The number of items clicked is always higher than
one, which means that all the users quickly under-
stood the way they could navigate inside the map, and
felt the need to explore further. Most clicked on 4 to
10 different items, which is in line with our projec-
tions for short to average sessions. The sessions with
more than 20 clicks on items are the longest ones.
The average number of queries used is pretty dis-
appointing (see Figure 7), looking as though this fea-
ture was not completely exploited by our users. Only
50% of the users tried to make another query. For
those who tried to do more than one query, the aver-
age number of starting points tested is just over 3.5.
ICEIS 2007 - International Conference on Enterprise Information Systems
226
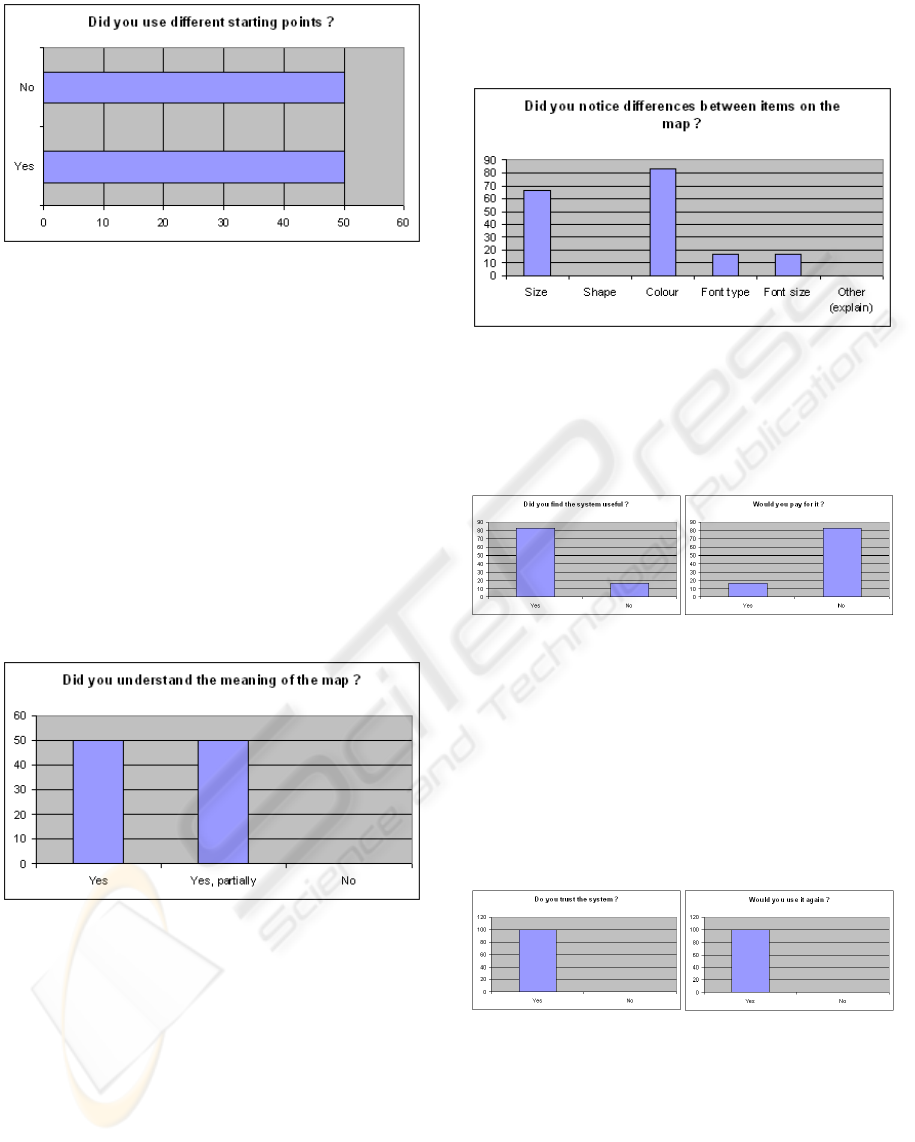
Figure 7: Number of queries used by a user during one ses-
sion. The search feature seems to be under-used, and should
be enhanced for a more accessible use.
5.3 System
This part of the study was trying to evaluate the way
the system was perceived and understood by users.
We started by asking if the user thought he had under-
stood the meaning of the map, and verified his answer
by asking him to explain it explicitly. Then, we evalu-
ated his satisfaction: did he trust the system, would he
use it again, would he even be prepared to pay for it?
Finally, we asked the user to provide an overall rating,
using labels from bad to excellent to ensure the rating
system to be homogeneous.
Figure 8: Understanding of the meaning and principles of
the map. All the users thought they understood more or less
the way the map was functioning.
All the users were able to explain the meaning of
the map, and many of them were curious about the
way we generated the map. It might be an idea to
be more transparent on the actual algorithm used to
improve again trust in the system. This result on the
understanding of the map is a real satisfaction, being
a target difficult to achieve for a complex and inno-
vative system. Most users were also able to point out
correctly the differences between item representations
and even managed to cite the criteria behind them
(popularity), which means that the interface chosen
is adapted to its audience (see Figure 9).
Figure 9: Perceived item differences. Rather accurate.
The system was unanimously perceived as useful
(see Figure 10).
Figure 10: Perceived usefulness of the system, along with
willingness to pay for it. Unfortunately, high usefulness is
not synonymous with willingness to pay.
On top of that, users had a high level of confidence
in the system (see Figure 11) and even those who were
unable to find new items for during the test session
asserted they would gladly use the system again on
another occasion.
Figure 11: User trust in the system, accompanied by inten-
tion to use the system again. Very positive indicators.
With all the previously mentioned satisfaction in-
dicators being very positive (see Figure 12), the av-
erage overall rating of 4.15 doesn’t really come as a
surprise, although it is unexpected for a system still
in beta version. It is very encouraging for the system
development.
KEXPLORATOR - A 2D Map Exploration User Interface for Recommender Systems
227
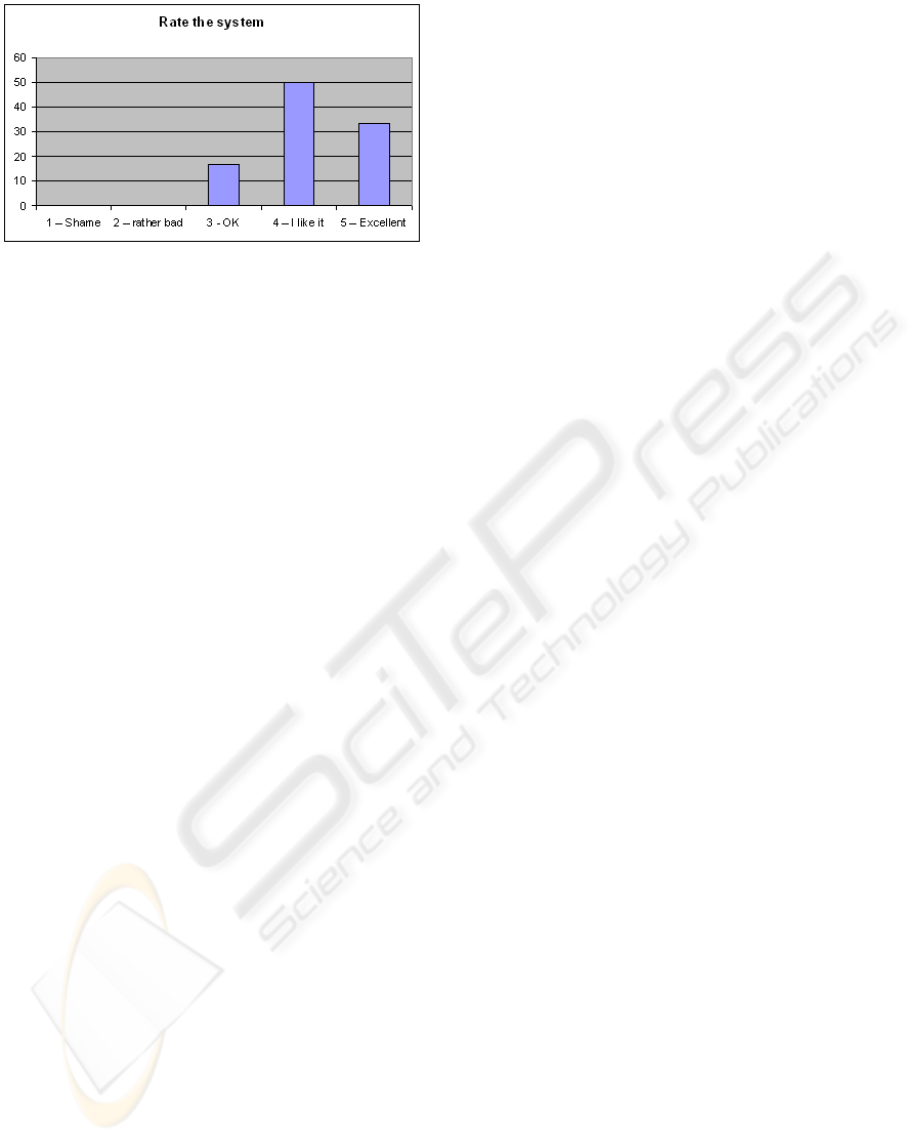
Figure 12: Overall ratings for the system, on a scale from 1
to 5. Very good results for a system still in beta version.
6 CONCLUSIONS
In this paper we presented the Kexplorator system,
which provides a generic map exploration user inter-
face for recommender engines. The system uses a
new algorithm for placing items on the map. Kex-
plorator has features such as on the fly information on
items, improved colour usage (via continuous colour
gradation for popularity), and optimised size adapta-
tion.
Usability testing indicates that the map ex-
ploratory interface was an easy to use efficient method
of allowing users to explore recommendations, and
discover other items of interest whilst browsing simi-
lar items.
REFERENCES
Armstrong, R., Freitag, D., Joachims, T., and Mitchel, T.
(1995). Webwatcher: A learning apprentice for the
world wide web. In AAAI Spring Synopsium on In-
formation Gathering from Heterogenous, Distributed
Environments.
Balabanovic, M. and Shoham, Y. (1995). Learning infor-
mation retrieval agents: Experiments with automated
web browsing agents. In AAAI Spring Synopsium
on Information Gathering from Heterogenous, Dis-
tributed Environments.
Goldberg, D., Nichols, D., Oki, B., and D, T. (1992). Us-
ing collaborative filtering to weave an information
tapestry. Communications of the ACM.
Herlocker, J., Konstan, J., Borchers, A., and Reidl, J.
(1999). An algorithmic framework for performing
collaborative filtering. In Proceedings of the Con-
ference on Research and Development in Information
Retrieval.
Kautz, H., Seman, B., and Shah, M. (1997). Referral web:
Combining social networks and collaborative filtering.
Communications of the ACM, 40(3):63–65.
Mladenic, D. (1996). Personal webwatcher: design and im-
plementation. Technical report, Department for Intel-
ligent Systems, J. Stefan Institute, Jamova 39, 11000
Ljiubjana, Slovenia.
Pazzani, M. and Billsus, D. (1997). Learning and revis-
ing user profiles: The identification of interesting web
sites. Machine Learning, 27:313–331.
P.Eades (1995). Layout adjustment and the mental map.
Journal of visual languages and computing.
Sinha, R. (2002). Interaction design for recommender sys-
tems. Designing interactive systems.
Terveen, L., Hill, W., Amento, B., McDonald, D., and
Creter, J. (1997). Phoaks: A system for sharing
recommendations. Communications of the ACM,
40(3):59–62.
ICEIS 2007 - International Conference on Enterprise Information Systems
228
