
A THREE-LAYER SYSTEM FOR IMAGE RETRIEVAL
Daidi Zhong and Irek Defée
Insititute of Signal Processing, Tampere University of Technology, Finland
Keywords: Face image, Retrieval, subimage.
Abstract: Visual patterns are composed of basic features forming well-defined structures and/or statistical
distributions. Often, they always present simultaneously in visual images. This makes the problem of
description and representation of visual patterns complicated. In this paper we proposed a hierarchical
retrieval system, which is based on subimages and combinations of feature histograms, to efficiently
combine structure and statistical information for retrieval tasks. We illustrate the results on face database
retrieval problem. It is shown that proper selection of subimage and feature vectors can significantly
improve the performance with minimized complexity.
1 INTRODUCTION
The visual image retrieval is a complex problem
since the visual information contains both the
statistical and structural information. At one extreme
case, the locations of features with respect to each
other are critical, this is called structure. At another
extreme the statistics of feature distribution is more
important than their precise locations. In practice,
visual patterns are mixtures of structure and statistics
which makes the description problem hard because
its complexity looks like unbounded. In addition, the
image quality often suffers from the noise and
different light conditions, which make the retrieval
tasks more difficult.
Some previous works focused on extracting and
processing global statistical information by using the
whole image (Ekenel and Sankur, 2004), while some
other researchers start from some key pixels (Shi et
al., 2006) to represent the structural information.
Based on their achievement, a reasonable way to
further improve the retrieval performance is to
extract the visual information in a way like a mixture
of statistical and structural information.
In this paper, we illustrate our idea by proposing
a retrieval system which is based on subimages and
combinations of feature histograms. The
experimental results disclose that the usage of
subimage and local feature vectors can lead to the
combination of statistical and structural information,
as well as minimized impact of noise, which finally
improve the performance of the approach.
In order to achieve a comparable result, we
tested our method over a public benchmark of face
image database. The evaluation method of this
database has been standardized, which allow us see
the change of performance clearly. However, using
face images as an example here does not mean our
method is limited to the application of face image
retrieval; it also has the potentiality to be applied to
other image retrieval tasks.
2 TRANSFORM AND
QUANTIZATION
Some transforms have been found useful in
extracting local visual information from images.
Popular transforms include: Gabor Wavelet,
Discrete Wavelet Transform, Discrete Cosine
Transform (DCT), and Local Steerable Phase.
Specially, DCT and Wavelets have already been
adopted to the image and video compression
standards (ISO/IEC,1999). These transform
coefficients inherently contain information about the
local area, which cannot be known from individual
pixel. We believe that properly applied transforms
can improve the performance of retrieval. Block
transform strongly eliminate the perceptually non-
relevant information and this should be of advantage
for the image retrieval tasks. The specific block
transform we use was introduced in the H.264
standard (ITU-T, 2003) as particularly effective and
simple. The transform matrix of the transform is
208
Zhong D. and Defée I. (2007).
A THREE-LAYER SYSTEM FOR IMAGE RETRIEVAL.
In Proceedings of the Second International Conference on Signal Processing and Multimedia Applications, pages 204-208
DOI: 10.5220/0002142702040208
Copyright
c
SciTePress
denoted as T
f
and the inverse transform matrix is
denoted as T
i
. They are defined as
⎥
⎥
⎦
⎤
⎢
⎢
⎣
⎡
−−
−−
−−
=
1221
1111
2112
1111
f
T
⎥
⎥
⎥
⎦
⎤
⎢
⎢
⎢
⎣
⎡
−−
−−
−−
=
5.0115.0
1111
15.05.01
1111
i
T
(1)
A 4x4 image pixel block P can be forward
transformed to block C using (2), and the scalar
quantization process Q( ) is used to remove the
irrelevant information, which will result in quantized
version of C, Q(C). For reconstruction purpose, the
inverse quantization process Q
-1
[ ] is applied to the
quantized block Q(C), and the block R is
subsequently reconstructed from the inverse-
quantized block Q
-1
[Q(C)], using (3)
T
ff
TPTC ××=
(2)
i
T
i
TCQQTR ××=
−
)]([
1
(3)
with superscript T denoting transposition.
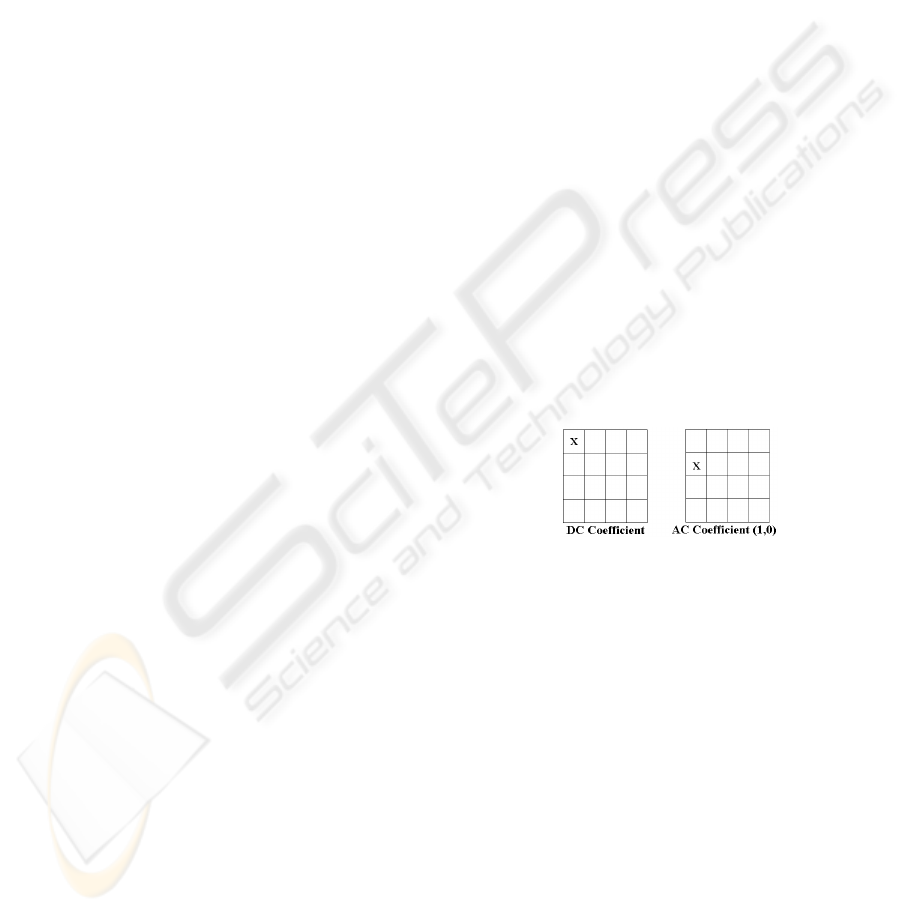
The leading element of the matrix C is called the
DC coefficient. All other elements are called AC
coefficients. There are thus 15 AC coefficients in the
matrix H but many of them will have zero value
after the quantization Q(C) is applied. The power of
the transform stems from the fact that despite of
strong quantization, the reconstructed block R will
still approximate well the original image block P.
Quantization has the effect of limiting the dynamic
range of coefficients.
3 FEATURE VECTORS
3.1 DC Ternary Feature Vectors
Block transform and quantization arranged the local
information in a suitable way for retrieval. Based on
this merit, we utilize the specific feature vector
defined below to further group the local information
in the neighboring blocks. The grouping process can
be applied separately or jointly over DC and AC
coefficients for all transform blocks of an image.
Considering a 3x3 block matrix containing nine
neighboring blocks, the DC coefficients from them
can form a 3x3 coefficient matrix. The eight DC
coefficients surrounding the center one can be
thresholded to form a ternary vector with length
eight. This vector is called DC Ternary Feature
Vectors (DC-TFV), which encode the local
information based on those quantized transform
coefficients.
The threshold is defined as a flexible value
related to the mean value of all the nine DC
coefficients.
fNXMThreshold ×−+=
+
)(
fNXMThreshold ×−
−
=
−
)(
(4)
where f is real number from the interval (0,0.5), X
and N are maximum and minimum pixel values in
the 3x3 coefficient matrix , and M is the mean value
of the coefficients. Our initial experiments have
shown that performance with changing f has broad
plateau for f in the range of 0.2~0.4. From this
reason, we use f = 0.3 in this paper. The thresholded
values can be either 0, 1 or 2
If the pixel value ≤ Threshold
+
put 0
If the pixel value ≥ Threshold
-
put 2
otherwise put 1
The resulting thresholded vectors of length eight are
subsequently converted to decimal numbers in the
range of [0, 6560].
Figure 1: The DC and one AC coefficient are utilized here.
3.2 AC Ternary Feature Vectors
Following the procedure described above, the binary
feature vectors are defined for the AC coefficients in
the same way by forming 3x3 matrices and
thersholding. We denote such vectors as AC Ternary
Feature Vectors (AC-TFV). Considering the fact that
there are 15 AC coefficients in each 4x4 block, we
only use one coefficient here to illustrate our idea in
a simple way. The used coefficient is in the position
(1,0), which has been shown in Figure 1. Although
using more AC coefficients might improve the
performance, it also requires more calculation. The
proper selection can be conducted with training set.
However, we only present the result with one very
capable AC coefficient, which already shows good
result. For simplicity, the two coefficients shown in
Figure 1 can be directly calculated without applying
the entire H.264 block transform.
A THREE-LAYER SYSTEM FOR IMAGE RETRIEVAL
209
4 REPRESENTATION BASED ON
SUBIMAGE
One complete face image can be seen as a
combination of different subimages. For example:
eyes, nose and mouth, each of these three subimages
represents relatively independent key information.
Considering them separately may leads to better
representation of the image comparing to using the
whole image. In our experiments, we divide the
original image into several rectangular subimages.
Information is extracted from each subimage, and
then combined to serve the retrieval tasks. Totally
512 subimages are randomly used in this paper.
They can cover almost all the face when overlapped
together. Furthermore, the sizes of them vary a lot.
The smallest and largest one respectively have 1/150
and 1/5 times of the size of whole image. This is
different from the traditional way to select only the
mouth and eye areas, since we wish to find out
where is the most distinguish area according to
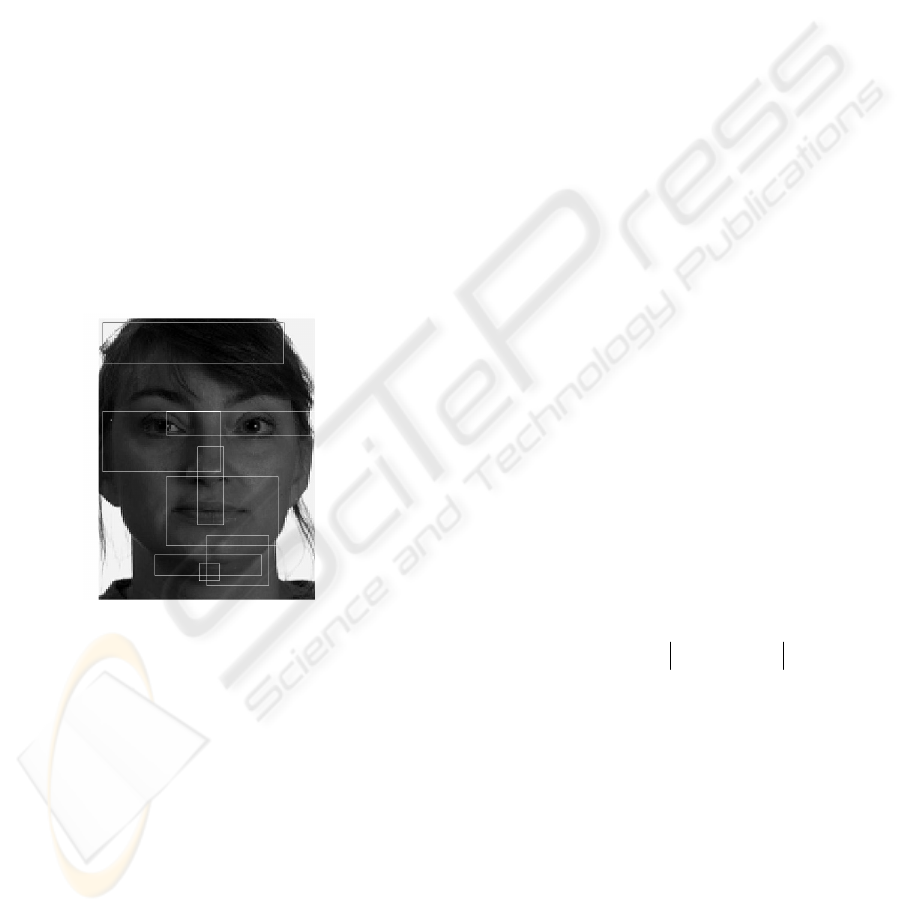
training process. Some examples of subimage are
shown in Figure 2.
Figure 2: Examples of subimage (each rectangle is a
subimage).
5 HISTOGRAMS OF FEATURE
VECTORS AND SIMILARITY
MEASURE
Our premise is that structural and statistical
information should be combined in a graceful way
that is allowing smooth and controlled combinations
of them. In this paper we consider a step leading into
this direction which is done by the histograms of
TFV from quantized coefficients. The process of
generating histogram is listed below:
1. The 4x4 H.264 AC Block Transform is applied to
a subimage.
2. Quantization is applied separately to all the AC
and DC coefficients.
3. TFV is generated from certain coefficient.
4. Histogram is generated from this subimage by
simply counting the number of each occurring
TFV.
5. Histogram is normalized according to the size of
subimage.
Specifically for AC-TFV histogram, there is one
bin which is too dominant comparing to other bins.
This is caused by the smooth area in image and
quantization. Such areas will generate a lot of all-
one vectors, like [1 1 1 1 1 1 1 1]. Our retrieval does
not use this bin, since it decreases the discriminate
ability.
Histogram based on DC-TFV and AC-TFV can
be used separately or collectively. Since they
represent different information, the combination of
them can leads to better performance, which will be
shown in the following experiment. The
combination is done by simply concatenating each
histogram one by one. Each histogram may is
generated from one subimage, and representing
either AC or DC information. Below are three
examples of different Combined Histograms (CH)
based on two subimages:
[CH1] = [ DC-sub1 DC-sub2]
[CH2] = [AC-sub1 AC-sub2]
[CH3] = [DC-sub1 AC-sub1 DC-sub2 AC-sub2]
During the face image retrieval process, the input
image is compared to any image stored in the
database, in order to find the most similar one. In
our method, such similarity is measured by
calculating the L1 norm distance (city-block
distance) between two histograms. For example,
suppose we have two histogram H
i
(b) and H
j
(b), b=
1, 2, … B. The distance will be calculated as:
∑
=
−=
B
b
ji
bHbH
1
)()(j)(i, Distance
(5)
6 EXPERIMENTS WITH FERET
DATABASE
6.1 FERET Database
The Color FERET Database (FERET, 2003)
contains standardized FA and FB sets. FA set
contains 994 images from 994 different objects, FB
contains 992 images. FA serves as the gallery set,
while FB serves as the probe set.
The advantage of using this database is the
standardized evaluation method of FERET (Phillips
SIGMAP 2007 - International Conference on Signal Processing and Multimedia Applications
210
et.al, 2000) based on performance statistics reported
as Cumulative Match Scores (CMS), which are
plotted on a graph. The horizontal axis of the graph
is retrieval rank and the vertical axis is the
probability of identification (PI) (or percentage of
correct matches). Simply, a higher curve reflects
better performance.
The FERET database provides some tools for
preprocessing of the face images. We utilized some
of these tools in the preprocessing stage of our
evaluation. First, the images were cropped to the
same size, which roughly contain the face area. They
are subsequently aligned and adjusted by
illumination normalization. No mask is applied to
the images.
6.2 Training and Retrieval Process
Our image database retrieval problem is formulated
as follows. Each probe image from probe set FB has
its corresponding image in gallery set FA. We use
the feature vector histograms of images and
similarity measure defined above to find out the
image in FA which gives minimum distance from
the probe image. If the found gallery image
represents the same person as the probe image, this
retrieval will be defined as a correct one.
However, before this can be done the parameters
used for the calculation of histograms and similarity
measure need to be found using training database
set. This set can be selected as a small subset of the
database. Knowing the correct responses for the
training database allows us to tune the parameters to
achieve best retrieval results. The optimal parameter
set which will be found out during training process
includes: the quantization scalar and length of
histogram. The optimal parameter set is identified as
the one which is maximizing the retrieval
performance over training database. The resulted
optimal parameter set is applied to the whole
database to evaluate the actual system performance.
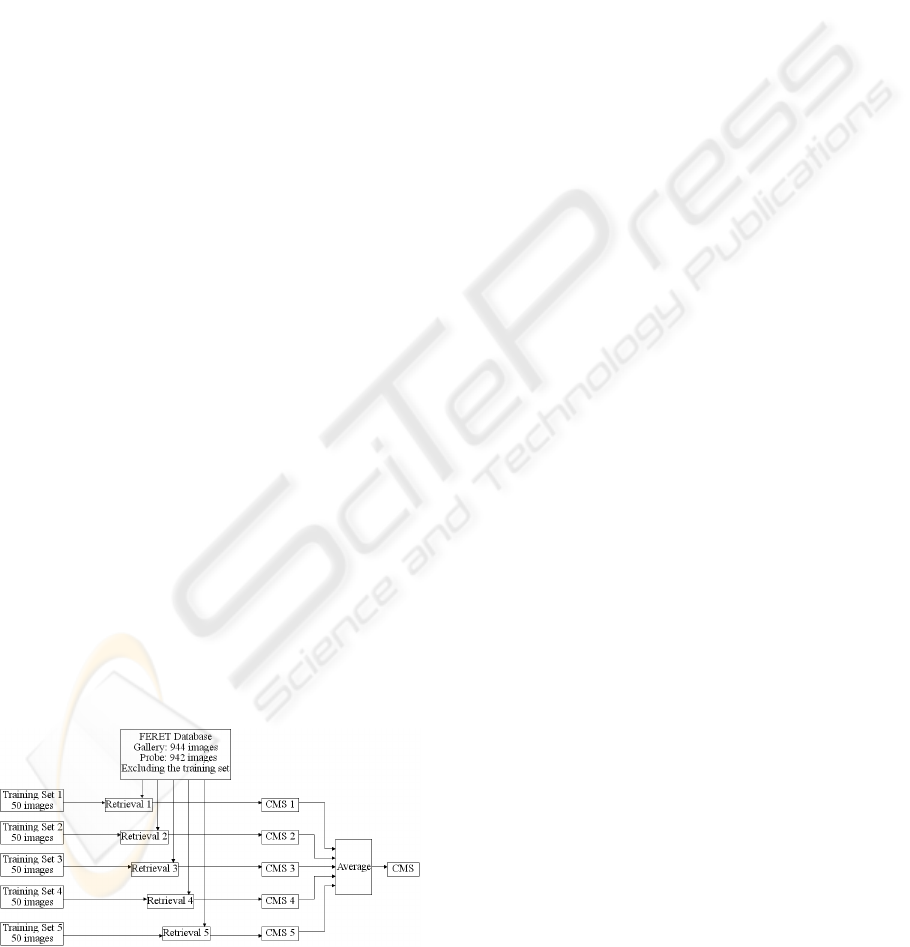
Figure 3: Training process based on five different small
sets.
In order to show that the selection of different
training set has insignificant impact over final
performance, the retrieval process is repeated five
times; each time using a different training set
containing 50 images, and the remaining 942 images
is the testing set. The final CMS curve is the average
of the five CMS curves resulted from above five
training sets. This process is shown in Figure 3.
6.3 Experiments and Results
We conducted three retrieval tests: A, B and C. They
are defined as below. Within each test, performances
of histogram based on DC-TFV, AC-TFV and their
combinations are evaluated separately.
Test-A: Histograms are generated from the whole
image.
Test-B: 512 subimages are randomly defined,
covering everywhere of the image. Their
sizes are varied a lot. Only one of them is
used to generate the histograms.
Test-C: Two of above 512 subimages are used to
generate the histograms. The total number
of tested combinations is 216. They come
from two different areas (eyes, nose and
mouth), in another word, they are non-
overlapping.
The result of Test-A serves as the reference for
the evaluation of the performances of Test-B and
Test-C. The corresponding CMS results are shown
in Table 1. The Rank-1 CMS is used here to
represent the retrieval accuracy (i.e., the CMS at the
first rank). On should notice that the performance of
DC-TFV has already reached a saturation area, the
improvement is relatively small; while significant
improvement can be found in the AC-TFV.
Since the subimage is randomly selected and
used, we presented the mean of performance of all
the subimages or combinations, in order to prevent
from any possible bias due to the usage of specific
subimage. From here one can see, although the
subimages cover less area than the whole image, the
performance gets improved. The reason for this is
that the division of image emphasizes some key
areas containing critical information for retrieval. In
addition, based on the block transform, TFV and
subimage, the local visual information is efficiently
organized by a three-layer hierarchical system.
Statistical information is represented by histogram,
and involving certain amount of structural
information, which finally leads to a good
performance.
A THREE-LAYER SYSTEM FOR IMAGE RETRIEVAL
211
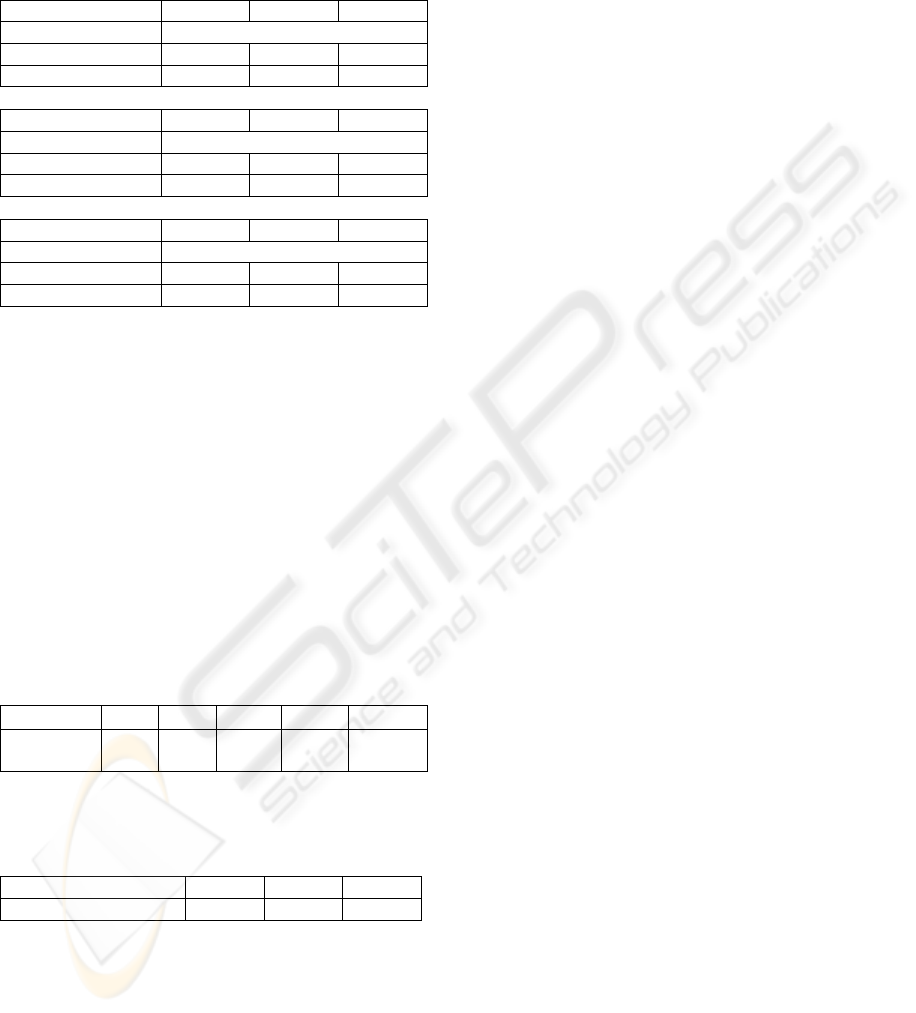
Table 1: The Rank-1 CMS results of three tests. There are
512 different cases for Test-B, and 216 cases for Test-C.
Therefore, to avoid the bias cause by single case, the
maximum, minimum and mean of all the 512 cases are
shown here. (a) DC-TFV, (b) AC-TFV, (c) Combination
of DC- and AC-TFV.
DC-TFV
Max Min Mean
Test-A 92.84%
Test-B 93.77% 9.01% 56.59%
Test-C 97.76% 47.54% 79.06%
(a)
AC-TFV
Max Min Mean
Test-A 64.31%
Test-B 60.77% 1.69% 20.99%
Test-C 81.94% 13.47% 43.89%
(b)
DC-TFV+AC-TFV
Max Min Mean
Test-A 93.65%
Test-B 95.30% 12.94% 62.11%
Test-C 97.70% 52.50% 82.56%
(c)
The achieved result is comparable to others
results obtained from exactly the same version
(2003) of FERET database, as shown in Table 2.
The corresponding references are (Shi et al., 2005),
(Shi et al., 2006), (Roure and Faundez, 2005), and
(Chung et al., 2005) respectively.
To further justify the robustness of our method,
the standard variations of the difference between of
the results from five training sets in Test-B are
shown in Table 3. The maximum, minimum and
mean of 512 cases are listed. They are small enough
to be ignored.
Table 2: Referenced results based on release 2003 of
FERET.
Reference
[Shi]
[
Shi][Roure] [Chung]
Proposed
Rank-1
CMS
79.4% 60.2% 73.08% 97.9% 97.78%
Table 3: Standard variations of difference between five
training sets during Test-B. 512 different cases are
evaluated here.
Reference
Max Min Mean
Standard Variations
2.554% 0.002% 0.323%
7 CONCLUSIONS
We proposed a hierarchical retrieval system based
on block transform, TFV and subimage for visual
image retrieval. The performance is illustrated using
a public face image database. This system achieves
good retrieval results due to the fact it efficiently
combines the statistical and structural information.
Future research will be concentrated on the
optimization of the histograms.
ACKNOWLEDGEMENTS
The first author would like to thank for the financial
grant from Tampere Graduate School in Information
Science and Engineering (TISE).
REFERENCES
Chung, H.K., Jiyong, O., Chong-Ho, C., 2005. Combined
Subspace Method Using Global and Local Features for
Face Recognition. In IJCNN 2005.
Ekenel, H.K., Sankur, B., 2004. Feature selection in the
independent component subspace for face recognition.
Pattern Recognition Letter, 25:1377–1388
FERET Face Database, 2003. Available at:
http://www.itl.nist.gov/iad/humanid/feret/.
ISO/IEC 14496-2, 1999. Information Technology -
Coding of Audio-Visual Objects - Part 2: Visual.
ITU-T, 2003. Draft ITU-T Recommendation and Final
Draft International Standard of Joint Video
Specification (ITU-T Rec. H.264 | ISO/IEC 14496-10
AVC).
Phillips, P.J., Moon, H., Rauss, P.J., Rizvi, S., 2000. The
FERET evaluation methodology for face recognition
algorithms. IEEE Pattern Analysis and Machine
Intelligence, Vol. 22, No. 10.
Roure, J., Faundez, Z.M., 2005. Face recognition with
small and large size databases. In ICCST 2005.
Shi, J., Samal, A., Marx, D., 2005. Face Recognition
Using Landmark-Based Bidimensional Regression. In
ICDM 2005.
Shi, J., Samal, A., Marx, D., 2006. How Effective are
Landmarks and Their Geometry for Face Recognition.
Computer Vision and Image Understanding,
102(2):117-133
SIGMAP 2007 - International Conference on Signal Processing and Multimedia Applications
212
