
CONSTRUCTION OF BENCHMARKS FOR COMPARISON OF
GRID RESOURCE PLANNING ALGORITHMS
Wolfgang Süß, Alexander Quinte, Wilfried Jakob and Karl-Uwe Stucky
Institute for Applied Computer Science, Forschungszentrum Karlsruhe GmbH
P.O. Box 3640, D-76021 Karlsruhe, Germany
Keywords: Resource Management System, Resource Broker, Evolutionary Algorithm.
Abstract: The present contribution will focus on the systematic constru
ction of benchmarks used for the evaluation of
resource planning systems. Two characteristics for assessing the complexity of the benchmarks were
developed. These benchmarks were used to evaluate the resource management system GORBA and the
optimization strategies for resource planning applied in this system. At first, major aspects of GORBA, in
particular two-step resource planning, will be described briefly, before the different classes of benchmarks
will be defined. With the help of these benchmarks, GORBA was evaluated. The evaluation results will be
presented and conclusions drawn. The contribution shall be completed by an outlook on further activities.
1 INTRODUCTION
It is the task of a resource management system to
acquire all resources supplied by the grid and to
distribute the jobs of the users to these available
resources in a reasonable manner. Ideally, planning
and execution of these jobs take place with these
resources at optimum costs and/or time in
accordance with the wishes of the users, without the
latter being burdened with unnecessary detailed
knowledge about the resources. Other requirements
on resource management are a good and cost-
efficient load distribution and the capability of
identifying, managing, and tolerating errors in order
to ensure a error-free and stable operation.
The jobs are carried out in the fo
rm of workflows
that contain all information on the working steps to
be performed and the grid resources required for this
purpose. To obtain a statement with respect to the
performance of a resource management system,
suitable benchmarks are required. Benchmarks are
also needed for the development and selection of
adequate optimization strategies for resource
planning.
For this purpose, the resource management
syste
m GORBA (Global Optimizing Resource
Broker and Allocator) (Süß et al., 2005) was
developed. It uses various optimization algorithms
for resource planning. To compare the performance
of already implemented algorithms and later new
developments, suitable benchmarks were
constructed.
The resource management system GORBA shall
b
e described briefly. The contribution will focus on
the presentation of the systematic construction of
benchmarks and on the evaluation of GORBA and
the optimization strategies for resource planning
using these benchmarks. The results of benchmark
runs performed with various optimization strategies
will be presented.
2 RESOURCE BROKERING FOR
COMPLEX APPLICATION
2.1 GORBA
As indicated by its name, GORBA (Global
Optimizing Resource Broker and Allocator)
represents a solution for the optimization of grid job
planning and resource allocation in a grid
environment. It was described in detail in a number
of publications, e.g. in (Süß et al., 2005)(Süß et al.,
2006). Resource management systems can be
divided into queuing systems and planning systems
(Hovestadt et al., 2003). The difference between
both systems lies in the planned time window and
the number of jobs considered. Queuing systems try
to allocate the resources available at a certain time to
80
Süß W., Quinte A., Jakob W. and Stucky K. (2007).
CONSTRUCTION OF BENCHMARKS FOR COMPARISON OF GRID RESOURCE PLANNING ALGORITHMS.
In Proceedings of the Second International Conference on Software and Data Technologies - PL/DPS/KE/WsMUSE, pages 80-87
DOI: 10.5220/0001332800800087
Copyright
c
SciTePress
the currently waiting jobs, i.e. request for resources.
Resource planning for the future for all waiting
requests is not done. In contrast to this, planning
systems examine the present and future situation,
which results in an assignment of start times to all
requests. Today, almost all resource management
systems belong to the class of queuing systems.
Contrary to queuing systems, planning systems
require more information, such as the duration of
execution or costs, resource performance, long-term
availability of resources, and others. Therefore, the
implementation of queuing systems usually is much
easier. However, a queuing system is only efficient
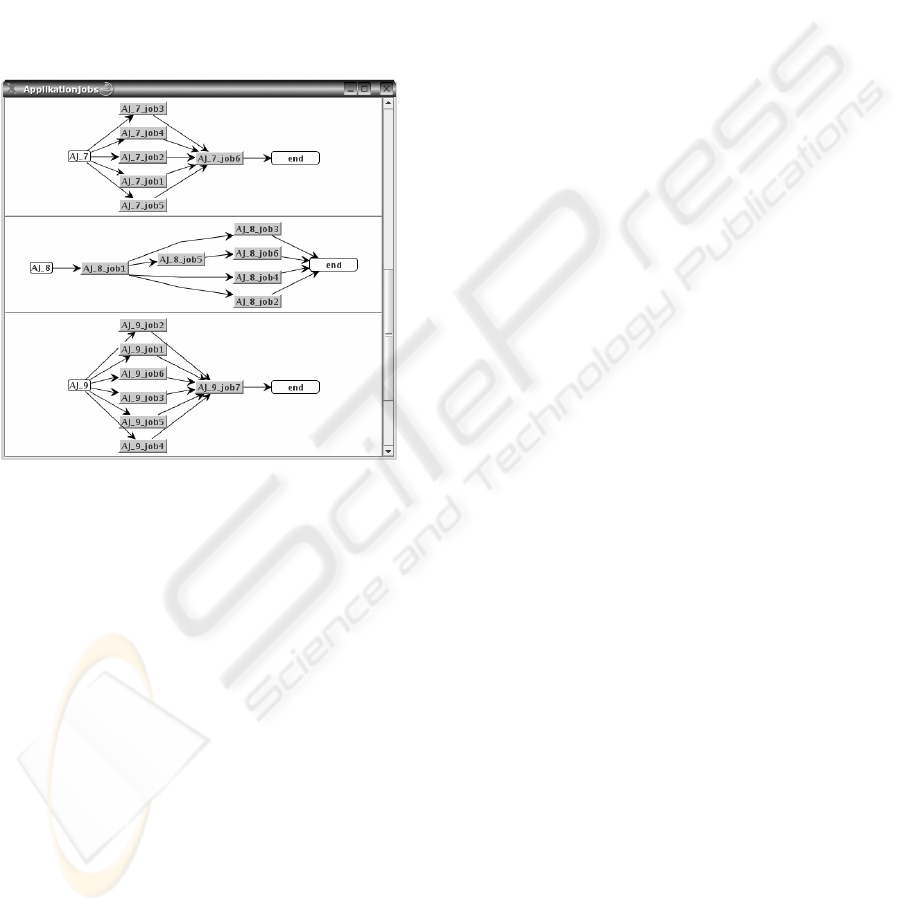
Figure 1: Examples of application jobs.
in case of a low usage of the system. In the case of
increased usage, the queuing system reveals
considerable weaknesses with respect to the quality
of services, resource usage, and execution time of
the individual grid jobs. Additionally, no statements
can be made about the presumable time of execution
for waiting grid jobs. For these reasons, a user-
friendly and future-oriented grid resource
management system must be based on planning
rather than on queuing only.
A special feature of GORBA is two-step job
planning, where evolutionary algorithms are
combined with heuristic methods in order to provide
the user with an optimum access to the available
resources. In a first step, different heuristic methods
are applied to provide rapid preliminary job plans
under time-critical conditions. Based on the results
of the first planning step, further improvements are
made using an evolutionary algorithm, if necessary.
Job planning in GORBA is dynamic. This means
that in case of unforeseeable events, for example the
failure or addition of resources, arrival of new jobs,
change or premature deletion of jobs currently
processed, a new planning cycle is initiated.
2.2 Workflow of the Grid Application
Usability and acceptance of a grid environment will
largely depend on how the user has to formulate his
grid application and to what an extent he is
supported in doing so. The grid application shall be
represented by a workflow that describes
dependencies between elementary application tasks
by predecessor relations. A workflow, called
application job, consists of individual grid jobs that
are basically described by the combination of
various resources requirements.
The resources are mainly hardware and software
resources that execute the grid jobs. When
specifying the resource requirement, the user is free
to specify a certain resource he needs for his grid job
or, less specifically, a certain resource type. In the
latter case, the resources explicitly tailored to the
grid job are allocated by the system. The less
specific the resource is given by the user, the more
planning alternatives result for the resource broker.
According to the workflow concept, it is planned to
support sequences, parallel splits, alternatives,
concurrencies, and loops for the user to implement
also dynamic workflows.
A workflow manager determines the relevant
information from a user-specified workflow and
supplies this information to GORBA for resource
planning. It is concentrated on workflows that may
be represented by DAGs (direct acyclic graphs).
Figure 1 presents examples of workflows of
application jobs.
2.3 Resource Planning as an
Optimization Problem
Resource planning in GORBA can only be
accomplished when various information items are
available. As use of the resources in the future is
planned, the workflow and execution time
normalized to a reference performance factor for
each grid job have to be known. And, of course, it is
essential to know which resources or resource types
are needed by the grid job. GORBA also has to
know the resources available in the grid and their
performance and costs. Costs may vary according to
day time, days of week or other time frames. The
user can specify the earliest starting point, latest end,
maximum costs, and weighing of time and costs for
his application job. Planning problems like this
belong to the class of NP-complete problems. This
CONSTRUCTION OF BENCHMARKS FOR COMPARISON OF GRID RESOURCE PLANNING ALGORITHMS
81

means that the optimum solution cannot be found
within polynominal time. But this is not necessary,
as long as a schedule is found, which fulfils all user
requirements in terms of time and costs at least and
the resources are used homogeneously in the sense
of the resource supplier.
The quality of the schedule is determined by the
fulfillment of different criteria, e.g. makespan,
fulfillment of user requirements (time and costs) or
resource utilization, which partly contradict each
other. For all these criteria, a normalized quality
function is defined and the resulting values are
added up to a weighted sum. This weighted sum
may be reduced by a penalty function which is
applied in case of the violation of constraints. The
weighted sum is used instead of pareto optimization,
because alternative solutions make little sense in an
automated scheduling process.
2.4 Optimization Strategies
In GORBA a two-step planning mechanism is
suggested, which utilizes approved heuristics from
job shop scheduling like job with the shortest
execution time first or job which is closest to due
time first. Both are simple and fast local optimizers.
They are used to seed the initial population (set of
start solutions) of the global optimizer, the
evolutionary algorithm GLEAM (General Learning
and Evolutionary Algorithm and Method) (Blume et
al., 2002). Evolutionary algorithms are known to be
a powerful general optimization technique which
can deliver at least nearly optimal solutions of NP-
complete problems. On the other hand, they
converge slowly when they approach an optimum.
The common solution of this drawback is a
hybridization with local search methods in order to
obtain the best of both worlds: A global and fast
search. Hybridization is done in three ways: Firstly,
by seeding the start population, secondly, in the
process of resource selection as will be described
later, and thirdly, by local improvement of offspring
generated by evolution. The last mechanism is also
known as memetic algorithms which have proved
their usefulness in many applications.
Our experiments focus on two different gene
models having in common that the grid job
execution sequence is determined by evolution. The
first one (GM1) leaves the selection of a resource
from a set of alternatively useable ones to evolution
and the second one (GM2) uses one of the following
simple strategies instead: Use the fastest or cheapest
available resource in general or let the application
job priority decide which one to use. As it is not
known a priori which of these three strategies
performs best for a given planning task, a fourth
strategy was added: Let the evolution decide which
of the three strategies to use for a generated solution.
This means that the resource selection strategy is co-
evolved together with the schedules.
3 BENCHMARKS
To evaluate scheduling algorithms, two types of
benchmarks are used: Benchmarks modeled from
real applications and synthetically produced
benchmarks (Takao et al., 2002)(Hönig et al.,
2004)(Wieczorek et al., 2006). It is the advantage of
application-oriented benchmarks that they are close
to practice. Their drawbacks consist in a mostly
small diversity and in the fact that their
characteristic properties which will be described
below cannot be influenced specifically. Therefore,
it was decided to use synthetically produced
benchmarks to evaluate and improve the
optimization strategies in GORBA.
Examples for other synthetically produced
benchmarks can be found in (Takao et al., 2002) and
(Hönig et al., 2004). These benchmarks are
restricted to homogeneous resources and to single
DAG scheduling. By contrast, the GORBA
benchmarks include inhomogeneous resources with
different performance factors, different costs, and
availabilities. Another important aspect of GORBA
is the possibility of planning and optimisation of
multiple application jobs, each with its own
individual optimisation goals (multiple DAG
scheduling), which requires enhancements of the
existing benchmarks. Multiple DAG scheduling is
also treated in (Hönig et al., 2006) and it is planned
to examine these benchmarks and feed them to
GORBA in the near future.
For the benchmarks, two parameters are defined,
which describe their complexity. The parameter D
denotes the degree of mutual dependency of the grid
jobs, which results from their predecessor/successor
relations. As the grid jobs usually have various
resources requirements, which means that they
cannot be executed on any resource, another
parameter (R) describes the degree of freedom in the
selection of resources. Both parameters are defined
as follows:
Dependence:
max
spj
spj
D =
ICSOFT 2007 - International Conference on Software and Data Technologies
82
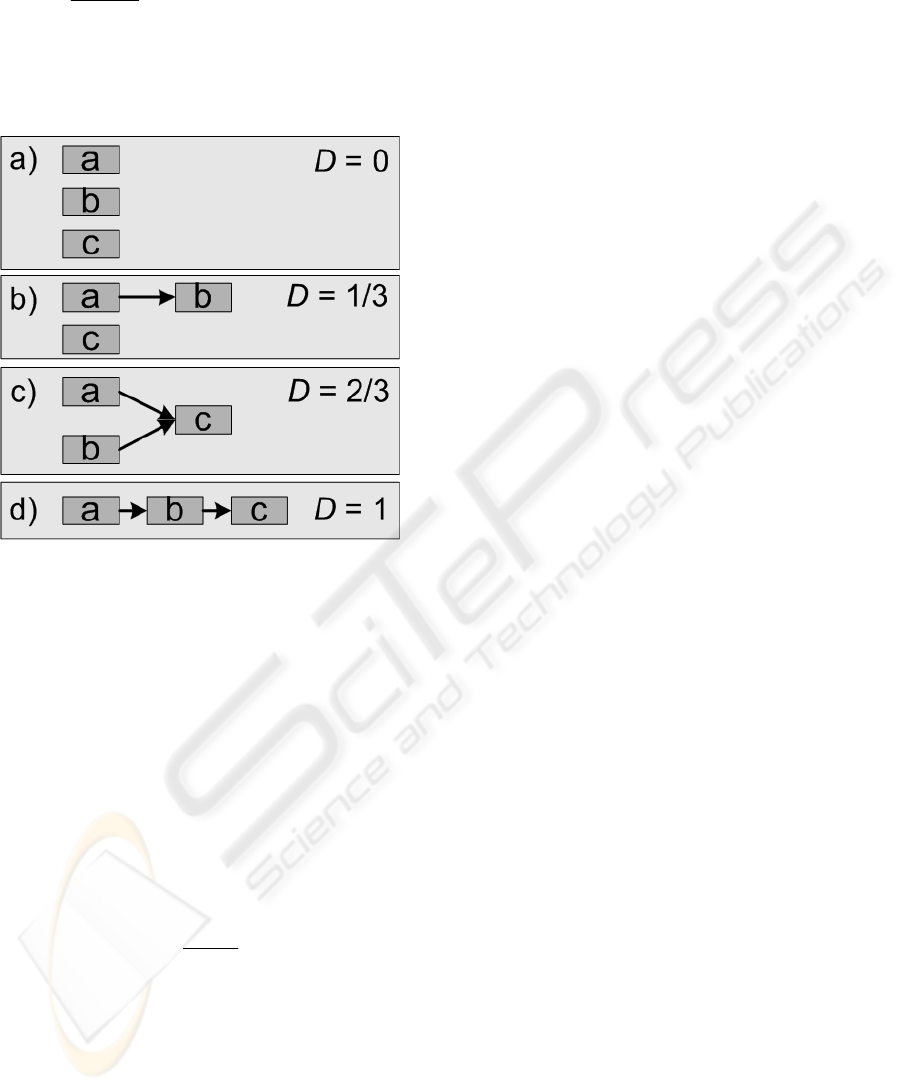
spj : Sum of all predecessor jobs of all grid jobs.
2
)1(
max
−
=
nn
spj
: Maximum possible sum of spj
n : Number of grid jobs
The dependence D yields the permutation of the
orders of all grid jobs. The smaller D is, the larger is
the number of permutations of all grid jobs.
Figure 2: Dependence D based on the example of n = 3.
Figure 2 shows various dependencies based on a
simple example of three grid jobs. Depending on D,
the set of execution sequences of the grid jobs and,
hence, the number of planning alternatives varies. In
the example, six possible permutations of grid jobs
a, b, and c exist for D = 0 (Figure 2a). For D = 1/3,
the three permutations cab, acb, and abc are possible
(Figure 2b). For D = 2/3, there are only the two
permutations of abc and bac (Figure 2c). For D = 1,
the execution sequence abc remains (Fig 2d).
Consequently, a small D may result in a high
parallelization capacity that depends on the degree
of freedom in the selection of resources, however.
The degree of freedom in resource selection is
defined as:
res
nn
tar
R
⋅
=
tar : Total of alternative resources of all grid jobs.
n : Number of grid jobs.
n
res
: Number of grid resources.
The degree of freedom in resources selection
denotes the planning freedom with respect to the
resources.
A small value of R means a small mean
possibility of selection of resources per grid job. A
large value of R means a large mean selection per
grid job. This means, for instance, that the class of
benchmarks with small D and large R allows for the
highest degree of parallelization and possesses the
largest number of planning alternatives. In contrast
to this, the class of benchmarks with high D and
small R allows for the smallest degree of
parallelization and resource alternatives.
To evaluate GORBA, four benchmark groups
were set up, with a small and large dependence D,
combined with a small and high degree of freedom
R, respectively.
For the comparison of different optimization
strategies, it is sufficient in the first step to restrict
resource usage to one resource per grid job, i.e. the
coallocation capability of GORBA is not used.
Each of these four benchmark groups comprises
three benchmarks with 50, 100, and 200 grid jobs, a
total duration of 250, 500, and 1000 time units per
performance factor (TU/PF), and 10, 20, and 40
application jobs, respectively. In Table 1
0 an
overview of the different benchmarks is given.
All these benchmarks were based on the same
grid environment simulated with a total of 10
hardware resources of varying performance factors
(PF) and costs (C). In Table 2 an overview of the
different hardware resources is given. The last
column denotes the costs of the hardware resources
related to the performance factor (C/PF).
As mentioned above, requirements by the user
usually are made on the application jobs with respect
to their maximum costs and their latest time of
completion. The quality of resource planning
depends on how well the requirements of the
application jobs are met. As an optimum, all
application jobs are within the given cost and time
limits.
Apart from the characteristic parameters R and D
defined above, the complexity of the planning
problem also depends on the user requirements made
on the application jobs, i.e. the influence of the user
requirements on the benchmarks is not only
expressed by R and D and has to be considered
separately when constructing the benchmarks.
As far as the user requirements are concerned,
three classes of benchmarks can be distinguished.
The first class comprises benchmarks that can be
solved by the heuristic method already.
CONSTRUCTION OF BENCHMARKS FOR COMPARISON OF GRID RESOURCE PLANNING ALGORITHMS
83
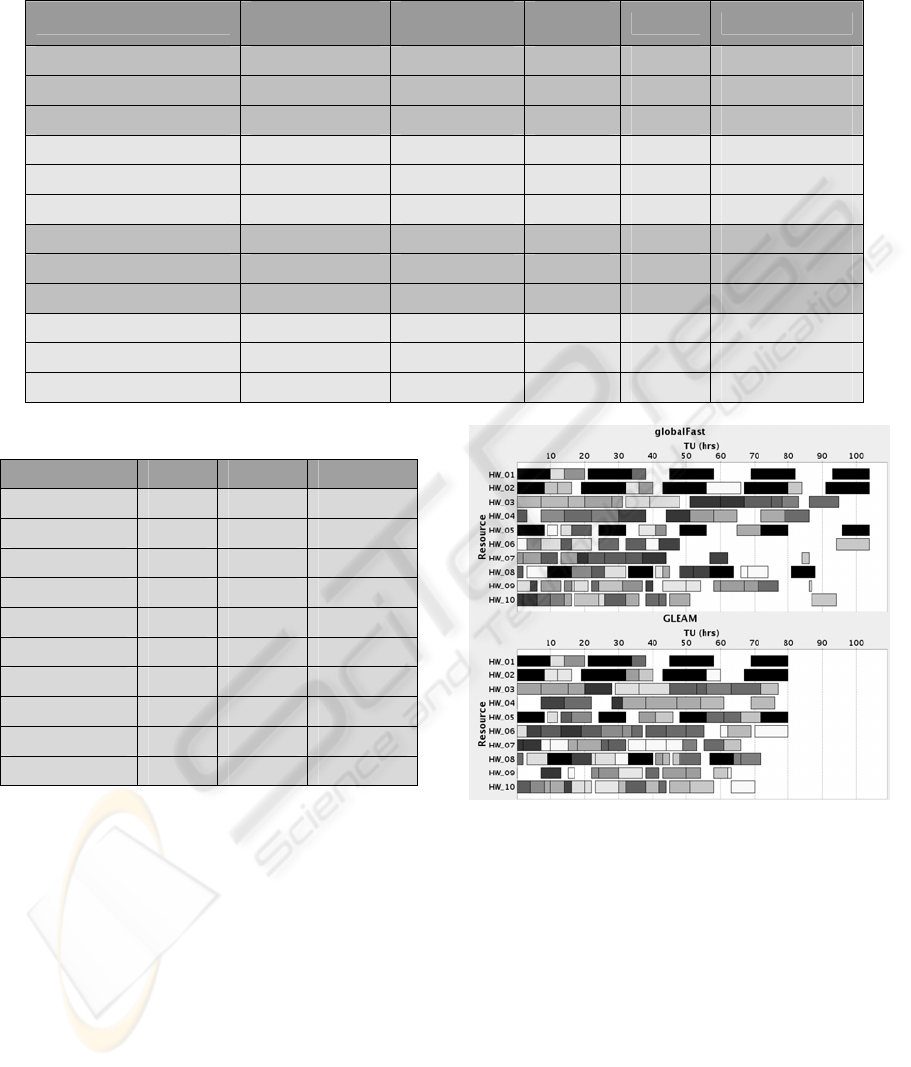
Table 1: Characteristics of benchmarks (sR means small value of R, lR means large R, sD means small D, and lD means
large D).
Benchmark
No.
Appl.jobs
No. Grid
jobs
TU/P
F
R D
sRsD-50 10 50 250 0.288 0.037
sRsD-100 20 100 500 0.304 0.019
sRsD-200 40 200 1000 0.303 0.009
sRlD-50 10 50 250 0.272 0.090
sRlD-100 20 100 500 0.278 0.044
sRlD-200 40 200 1000 0.28 0.022
lRsD-50 10 50 250 0.828 0.037
lRsD-100 20 100 500 0.842 0.019
lRsD-200 40 200 1000 0.843 0.009
lRlD-50 10 50 250 0.828 0.090
lRlD-100 20 100 500 0.828 0.044
lRlD-200 40 200 1000 0.832 0.022
Table 2: Characteristics of the resources.
Hardware
PF C C / PF
HW_01 0.5 1 2
HW_02 0.5 1.1 2.2
HW_03 0.8 1 1.25
HW_04 0.8 1.4 1.75
HW_05 1 1.5 1.5
HW_06 1 1.5 1.5
HW_07 1.2 1.6 1.33
HW_08 1.5 1.8 1.2
HW_09 1.5 2.4 1.6
HW_10 1.5 2.5 1.67
Hence, the more time consuming second planning
step is not required. The second class of benchmarks
includes benchmarks that can no longer be solved by
the heuristic methods, but by the evolutionary
algorithm of the second planning step. The third
class includes benchmarks that cannot be solved at
all because of too tight time requirements, for
example. As this contribution mainly focuses on
how the second planning step can be improved,
benchmarks of the second class are of particular
interest. Consequently, the time and cost
requirements were defined, such that times or costs
were exceeded in at least one up to four application
jobs during the first planning step.
Figure 3: Results of benchmarks sRlD-100: On the top a
schedule generated from the best heuristic planning. On
the bottom a schedule generated from GLEAM.
These benchmarks were used to determine the
improvements achieved by the second planning step
as compared to the first. As the evolutionary method
GLEAM used in the second planning step is a non-
deterministic method, 100 GLEAM runs were made
for each benchmark in order to obtain a reasonable
statistic statement. Each GLEAM run was limited to
three minutes.
In the second planning step the two different gene
models GM1 and GM2 were applied. The results of
these benchmark studies shall be presented below.
ICSOFT 2007 - International Conference on Software and Data Technologies
84
4 RESULTS
By way of example, Fig 3. and 4 show the planning
results of the benchmark sRlD-100. The resource
plans generated by both planning steps are shown in
Figure 3. The top plan shows the best result of the
six heuristic algorithms integrated in the first
planning step. The bottom plan represents the result
of the second planning step, with the gene model
GM1 being used by GLEAM. The plans show the
allocation of the individual grid jobs to the
resources. All grid jobs of an application job are
marked by the same grey value. Black bars indicate
times, at which the resource must not be used
(HW_01, HW_02, HW_05, and HW_08). Heuristic
planning certainly has problems in allocation, which
is reflected by large gaps in the plan. Compared to
heuristic planning, GLEAM reaches a much more
compact allocation of resources.
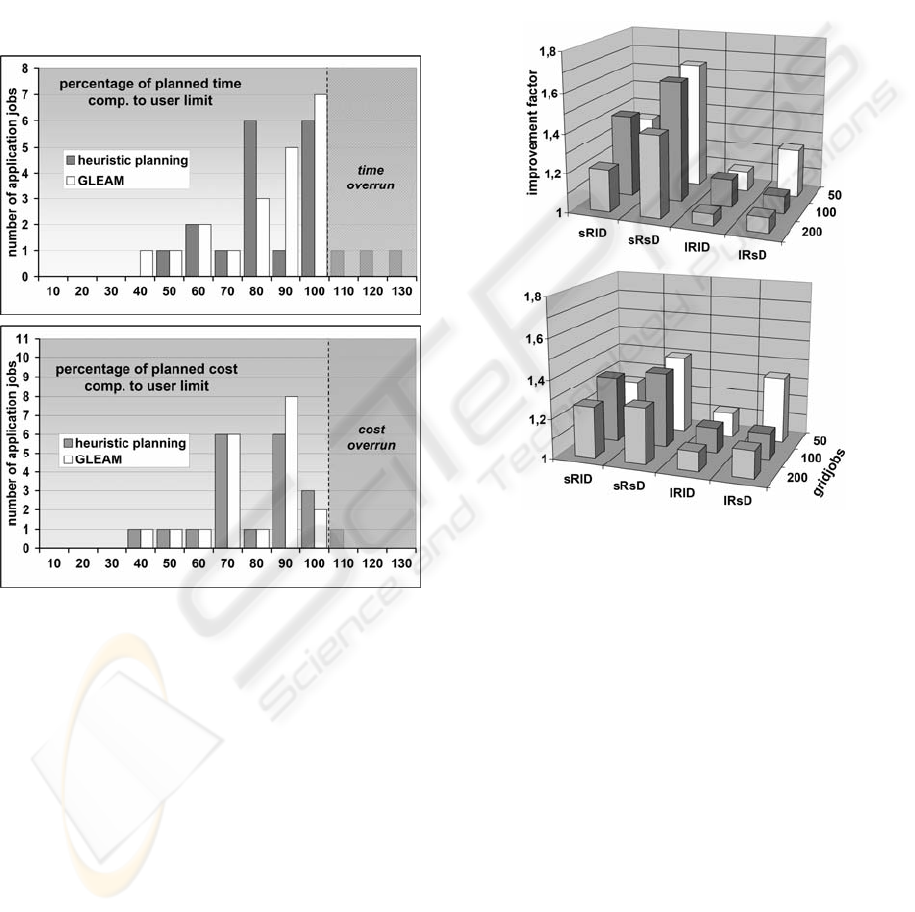
Figure 4 shows the fulfillment of the time (top)
and cost (bottom) requirements of the example from
Figure 3. The degree of fulfilling the requirement is
given in percent on the X-axis. A value above 100%
means that the requirements are exceeded. Values
smaller or equaling 100% mean that the
requirements are met or not even reached. The
height of the bars represents the number of
application jobs lying in the respective fulfillment
range. It is aimed at all application jobs fulfilling the
requirements.
The charts show that when using GLEAM, all
application jobs meet the requirements. In heuristic
planning three application jobs exceed the time
limits and one application job the costs. The results
of the four benchmark groups shall be presented
below.
Figure 5: Statistical improvement of the GLEAM planning
phase compared to the heuristic planning phase. Use of
gene model GM1 on the top and GM2 on the bottom.
They are based on 100 runs per benchmark due to
the stochastic nature of GLEAM and the
comparisons are based on averages. The time
available to a GLEAM planning is limited to three
minutes because planning must be done quickly for
real applications. Both diagrams in Figure 5 show
the mean statistical improvement of the second
planning step with GLEAM as compared to the best
of the six heuristic plannings in the first planning
step. For improved clarity of the results, the
influence of penalty functions is omitted. Due to the
elitist nature of GLEAM, only stagnation or
improvements are possible, but no impairment. In
the case of a few alternative resources, GLEAM
results in considerable improvements as compared to
heuristic planning, with these improvements being
better than in case of benchmarks with many
alternative resources. This is because the heuristic
Figure 4: Results of benchmark sRlD-100: Comparison of
GLEAM and heuristic planning related to time and cost
constraints.
CONSTRUCTION OF BENCHMARKS FOR COMPARISON OF GRID RESOURCE PLANNING ALGORITHMS
85
planning already yields very good planning results in
case of many alternative resources, which can hardly
be improved by GLEAM within the time available.
Planning optimization with the gene model GM2
does not result in such high improvements in case of
few alternative resources. If there are many
alternative resources, however, optimization is
somewhat better than heuristic planning.
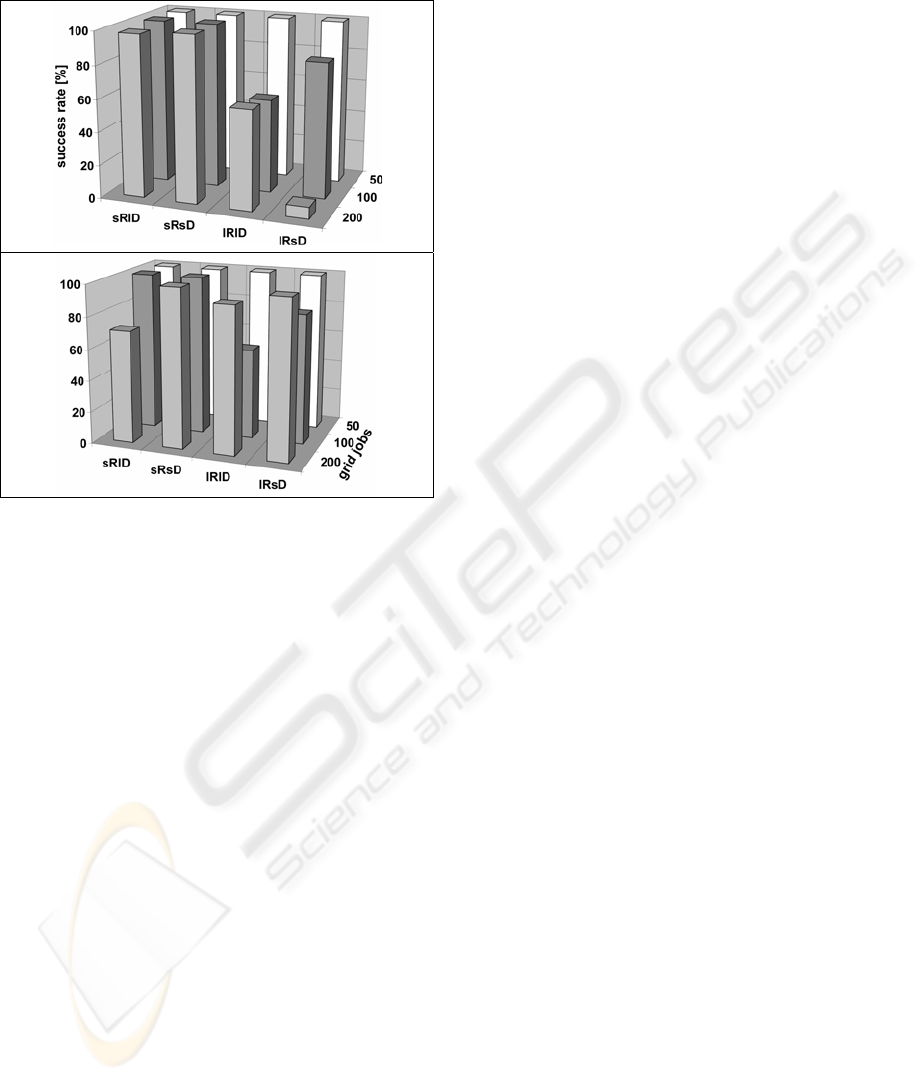
Another topic of the benchmark study concerns
the success rate which indicates the probability of
the result being improved by the second planning
step compared to the first one. Figure 6 compares
the success rates obtained for the two different gene
models. Evolving the resource selection strategy
(GM2) in most cases is equal to or better than
evolving the resource selection directly (GM1). The
reason is a larger search space for GM1, which
results in a smaller improvement of the schedule
within the given time frame. Other test runs which
were stopped much later, when a certain degree of
convergence was reached, showed that GM1
delivers better solutions in terms of resource
utilization and application job cheapness and
fastness. This was expected, as GM1 is more
flexible in resource allocation. It allows the usage of
resources, which would not be possible obeying one
of the allocation strategies, as the decision is made
individually for every grid job. But this process
requires more time and, therefore, GM2 is preferred
according to the rule that the best plan is useless, if it
comes too late. In all cases, including the poor case
of lRsD for 200 grid jobs of GM1, the schedules
from the heuristic phase were improved.
5 CONCLUSION
It was shown that a suitable selection of benchmarks
results in valuable information on the quality and
possibilities of improvement of the optimization.
Global planning using an evolutionary algorithm
can deliver better results than simple heuristics
within an acceptable time frame. The results also
show a need for improving the optimization. Current
work concentrates on extending and enhancing
GLEAM by newly developed local searchers for
combinatorial problems. We expect a great benefit
from this new memetic algorithm, as this approach
has already proved its superiority in the area of
parameter optimization (Jakob et al., 2004).
So far, the benchmarks have been generated
manually. At the moment, it is worked on a new
concept for the construction and automatic
generation of benchmarks. With this, the set of
benchmarks will be extended considerably in order
to improve the information quality. Moreover, it is
planned to integrate other heuristic methods in the
first planning step of GORBA. For GORBA, a
modular setup is envisaged, with the optimization
methods being tailored to the type of planning
problem arising.
REFERENCES
Süß, W., Jakob, W., Quinte, Stucky, K.-U.: GORBA: a
global optimizing resource broker embedded in a grid
resource management system. Proc. 17th IASTED
Intern. Conference on Parallel and Distributed
Computing Systems (PDCS), Phoenix, AZ, (2005) 19-
24
Süß, W., Jakob, W., Quinte, A., Stucky, K.-U.: Resource
Brokering in Grid Environments using Evolutionary
Algorithm. Proceedings of the Int. Conf. on Parallel
and Distributed Computing and Networks (IASTED),
A, February 14-16. 2006.
Hovestadt, M., Kao, O., Keller, A., Streit, A.: Scheduling
in HPC Resource Management Systems: Queuing vs.
Planning. Proceedings of the 9th Workshop on Job
Scheduling Strategies for Parallel Processing (JSSPP)
at GGF8, Seattle, WA, USA, June 24, 2003, LNCS
2862, Springer, Berlin, 2003, pp. 1-20.
Figure 6: Success rates of the GLEAM planning phase
using gene model GM1 on the top and GM2 on the
bottom.
ICSOFT 2007 - International Conference on Software and Data Technologies
86

Blume, C., Jakob, W.: GLEAM – An Evolutionary
Algorithm for Planning and Control Based on
Evolution Strategy. Conf. Proc. GECCO 2002, Vol.
Late Breaking Papers, 2002, pp. 31-38.
Takao Tobita, Hironori Kasahara: A standard task graph
set for fair evaluation of multiprocessor scheduling
algorithms. Journal of Scheduling, pp. 379-394, 2002.
Hönig, U., Schiffmann, W.: A comprehensive Test Bench
for the Evaluation of Scheduling Heuristics. In
Proceedings of the 16th International on Conference
Parallel and Distributed Computing and Systems
(PDCS), Cambridge (USA), 2004.
Wieczorek, M., Prodan, R., Fahringer, T.: Comparison of
Workflow Scheduling Strategies on the Grid; R.
Wyrzykowski et al. (Eds.), PPAM 2005, LNCS 3911,
pp. 792-800, Springer, Berlin, Heidelberg, 2006.
Hönig, U., Schiffmann, W.: A Meta-algorithm for
Scheduling Multiple DAGs in Homogeneous System
Environments. In Proceedings of the 18th International
Conference on Parallel and Distributed Computing
and Systems (PDCS), Dallas (USA), 2006.
Jakob, W., Blume, C., Bretthauer, G.: HyGLEAM -
Towards a Generally Applicable Self-adapting
Hybridization of Evolutionary Algorithms. Conf. Proc.
of Genetic and Evolutionary Computation Conference
(GECCO 2004), Vol. Late Breaking Papers, published
on CD, ISGEG, New York, 2004.
CONSTRUCTION OF BENCHMARKS FOR COMPARISON OF GRID RESOURCE PLANNING ALGORITHMS
87
