
DYNAMIC REPRESENTATION OF INFORMATION FOR A
DECISION SUPPORT SYSTEM
Thierry Galinho
*,**
, Michel Coletta
*
, Patrick Person
*
, Frédéric Serin
*
*
Laboratoire Informatique du Havre, Université du Havre, Le Havre, France
**
Institut Supérieur d’Etudes Logistiques, Université du Havre, Le Havre, France
Keywords: MultiAgent system, Animated cartogram, Composite semantic feature, Ontology, Factual agent.
Abstract: This paper presents a system designed to help deciders manage cases of crisis. The system represents,
characterises and interprets the dynamic evolution of information describing a given situation and displays
the results of its analysis. The core of the system is made up of three multiagent systems (MAS): one MAS
for the static and dynamic representation of the information (current situation), the second MAS for
dynamically regrouping sets of agents of the former MAS and the upper MAS for matching results between
the second MAS and scenarios stored in the persistent memory of the system in order to have a deeper
analysis of the situation. The case based reasoning of this last MAS sends its results to the user as a view of
the current situation linked to some views of similar situations. In this paper, we will focus on the
representation of information MAS. This MAS is dynamic in order to be able to take into account the
changes in the description of the information. Current information is represented by a layer of factual agents
which is fed by the composite semantic features constituting the atomic data elements of information. The
aim of the set of factual agents is both to be a real snapshot of the situation at any time and to model the
evolution of information dynamically.
1 INTRODUCTION
This paper presents a global system designed to help
deciders manage cases of crisis with an original
representation of information. The system could
either be used to prevent a crisis or to deal with it. In
both cases, the main internal aim of the system is to
detect a crisis (Borodzicz & al.1993). From the
system point of view, detecting a crisis implies
representing a crisis, characterising a crisis and
comparing a crisis with other crises permanently
stored in scenarios. The result of this comparison is
provided to the user as the answer of the global
system. Our decision support system chooses to
highlight parts of scenarios close to the current
information also called situation. The information
thus obtained will help deciders analyse the current
crisis and its possible evolutions.
The core of the system which is made of three
multiagent systems (MAS) will be detailed in the
second paragraph. A common characteristic of these
three MASs is the use of intelligent agents.
Wooldridge and Jennings define these intelligent
agents (Wooldridge and Jennings 1995, 1998) which
are the only kind of agents we will consider in this
paper. Factual agents – which are our
implementation for intelligent agents for the
representation of information MAS – will also be
explained in the second and third part. The third
paragraph will focus on the design and the
implementation of the composite semantic features
and ontology, in order to measure semantic
proximities in the information representation MAS.
In the fourth part, we present some of the graphic
analysis tools we use. We will conclude our paper
with a presentation of the analysis of the choices we
made about all the parameters and strategies we had
to deal with. Some perspectives and relative works
will be considered in the last part.
Historically, the objective of the representation
of information MAS was to interpret the speech of
human actors during a crisis (Cardon 1997), (Durand
1999), (Lesage 2000). Then we applied the system
to a preventive vigil system (Boukachour & al.
2002). Its global architecture used semantic features
(SF), proximity measure, ontology, dynamic
clustering and case-based reasoning (Boukachour
2002). We wrote the software in Java for testing
purpose on some parts of real situations. Since then,
we have deeply redesigned new specifications. We
156
Galinho T., Coletta M., Person P. and Serin F. (2006).
DYNAMIC REPRESENTATION OF INFORMATION FOR A DECISION SUPPORT SYSTEM.
In Proceedings of the Eighth International Conference on Enterprise Information Systems - AIDSS, pages 156-163
DOI: 10.5220/0002491601560163
Copyright
c
SciTePress
implemented the prototype with an added goal:
being generic; generic is used here with a different
meaning from (Wooldridge and Jennings 1998). We
postulated that some parts of the architecture and, at
a deeper level, some parts of our agents were
independent on the subject used as application.
Today, we apply this global system to different
topics such as:
– e-learning, we started collaboration with
specialists in didactics (Bertin and Gravé 2004)
to build a “pedagogical agent” (Hubbard 2000);
– crisis management, this architecture was tested
on a scenario taken from an emergency exercise
at an oil plant in Le Havre (Boukachour & al.,
2001, 2002). The ontology of the specific
domain was created to allow comparisons
between semantic features in this context
(Boukachour & al., 2003);
– logistics and information systems (work in
progress);
– games (Person & al., 2005); the chosen game
was the game of Risk®.
Risk (Risk game, 2006) is a commercial turn-
based strategy board game produced by Parker
Brothers, a division of Hasbro. Risk shares many
characteristics with wargames, yet relative to other
war games, it is simple and abstract. It makes little
attempt to accurately simulate military strategy, the
size of the world, the logistics of long campaigns or
real-world luck. Risk is a turn-based game for two to
six players. It is played on a board depicting a
stylized political map of the Earth, divided into 42
territories, which are grouped into 6 continents.
The game is played by allocating armies to the
territories that the player controls, and then attacking
neighbouring territories in order to conquer them.
The outcome of battles is decided by rolling dice.
Some versions of the rules specify a lower
winning target or allocate a random, secret,
"mission" to each player at the beginning of the
game. Possible missions include gaining control of
all territories in two or three specified continents, or
eliminating another specified player. One of the
goals of our system is to deduce the missions of the
opponents.
Examples and figures in this paper are taken from
the game of Risk. Here are the reasons for our
choice:
– instead of depending on experts for knowing the
validity of the results, we can be experts
ourselves;
– it is easy to evaluate the quality of the advice
given by the system: we know if the system
helps us win;
– we can make the assumption of a closed-world;
– the time of execution is “reasonably” short thus
allowing the system to loop and produce enough
examples to test;
– the game of Risk is not a toy problem and it is
particularly well suited for crisis management;
– information in the game of Risk always changes
and dynamism has to be taken into account.
2 ARCHITECTURE OF THE
DECISION SUPPORT SYSTEM
The decision support system (DSS) is a tool whose
main objective is to help deciders manage decision
process in the case of a crisis or before a crisis
occurs. What this DSS offers users is to analyse the
current situation dynamically and compare it to past
situations. The past situations are permanently stored
in a scenario base and can be viewed as one part of
the knowledge we have on the specific domain.
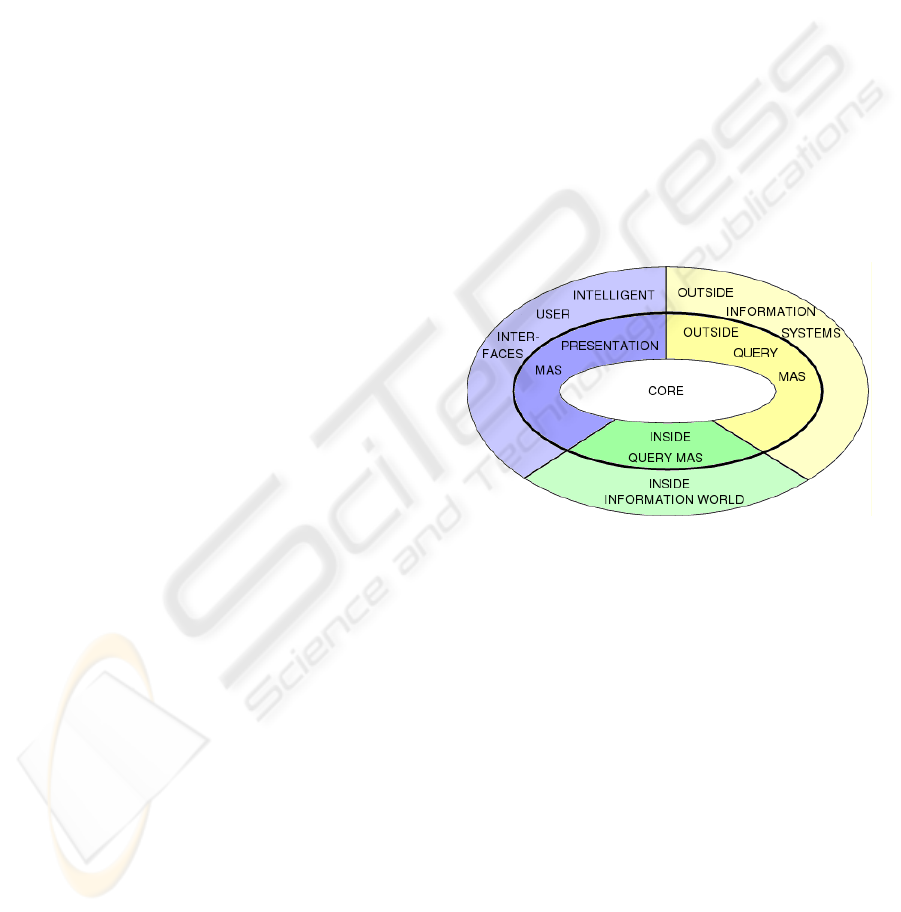
Figure 1: Global Architecture of the DSS.
In order to be helpful for the decider, the analysis of
the current situation must be of great accuracy.
Therefore it is essential for the analysis:
– to present a synthetic view of the salient aspects
of the situation in accordance with the role and
personal interests of the given decider;
– to present possible evolutions of the current
situation with the associated consequences;
– to respect a temporal constraint according to the
time scale of the problem.
Figure 1 shows the global architecture of this
DSS. The inside query MAS and the inside
information world are in charge of all the knowledge
the core needs. The knowledge includes the scenario
base we mentioned before. The knowledge also
contains the ontology of the domain and the
proximity measure which is specific to the domain.
The outside query MAS and the outside
information systems refer to the extraction and
presentation to the core of the external information
DYNAMIC REPRESENTATION OF INFORMATION FOR A DECISION SUPPORT SYSTEM
157
the latter could need and find in network distributed
information systems. The presentation MAS will
allow dialogues between all the users authorised to
access the DSS and the core of the DSS. This MAS
also presents users with the final results of the core.
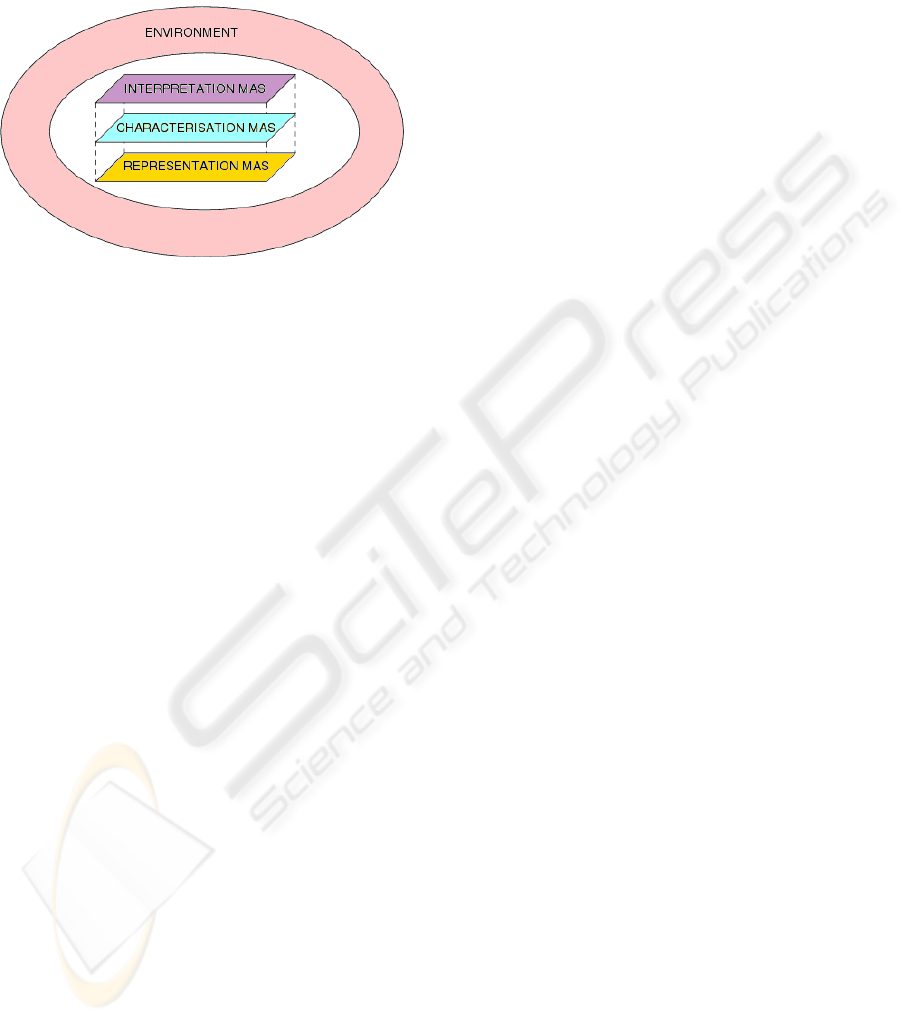
Figure 2: Architecture of the Core of the DSS.
Figure 2 shows the architecture of the core of the
DSS. The environment provides a layer between the
outer MASs presented in figure 1 and the three
MASs of the core. The three internal MASs of the
core communicate with each other and communicate
with the environment. Each MAS has one and only
one role.
The representation MAS must reflect an accurate
static view of the whole current situation and its
dynamic evolutions. The main components of this
MAS are factual agents (FA). A detailed
presentation of the architecture and the internal
structure of FAs could be found in (Person et al,
2005). The graphic analysis tools of our last part will
focus on FAs.
The characterisation MAS is an active observer
of the representative MAS. The characterisation
MAS clusters FAs both incrementally and
dynamically according to the evolution of their
internal indicators. The set of synthesis agents of the
characterisation MAS is the internal view of the
system, its internal representation of the current
situation.
The interpretation MAS takes that view, that
observation and compares the current observation
with past ones known as scenarios. The
interpretation MAS is composed of dynamic
prediction agents. A prediction agent is associated to
a given scenario or to a whole family of scenarios,
depending on the applications. Prediction agents
permanently try to match parts of their own scenario
to the view of the current situation offered by
synthesis agents. Through the environment, the
activity of prediction agents is sent to the
presentation MAS, and finally to the users.
3 INFORMATION
REPRESENTATION MAS
3.1 Environment Design
As we wrote in the introduction, to detect a crisis
implies representing a crisis and characterising it.
After this stage, we must be able to compare a crisis
with other crises. The result of this comparison is
provided to the user as the global system answer.
The observed environment is analysed and
designed as an object oriented world. That is to say
that we consider all incoming information as object
oriented messages describing states or behaviours of
objects. These objects are a viewpoint to represent
environment commonly used in object oriented
analysis and design (Barber & al, 1999). From the
object, semantic features (SF) are sent to our system.
An SF is a basic property of the environment or,
in other words, an indication that a state is changing.
In a state diagram, the state transition is used to
show the state space of a given class, the events
(messages) that cause a transition from one state to
another, and the actions that result from a state
change (Harel, 1987). Each transition occurs due to
the occurrence of an event or action from one state
to another. An event/action is directly linked above a
transition that it causes. The observed system sends
the events represented by semantic features.
We consider five parameters to identify our SF:
the object, the attribute, the value attached to this
attribute, the occurrence time of this event, and the
location (dedicated to moving objects). A SF
translates elementary information coming from the
environment both particular and partial aspects of an
observed situation. This SF design allows to obtain a
homogeneous structure. This one allows us to
establish comparisons between SFs.
3.2 Proximity Measures, Semantic
Features and Ontology
With these comparisons, the system is able to
evaluate a current situation by comparing it with
referred situations (called scenarios).
These situations of reference result from passed
experiments, studied situations, deductions, analyses
or extrapolations. We need to define the set of the
observations sent to our system, which is the goal of
the following section.
ICEIS 2006 - ARTIFICIAL INTELLIGENCE AND DECISION SUPPORT SYSTEMS
158
3.3 Composite Semantic Features
In this section, we focus on the design and the
implementation of the composite semantic features.
An SF (”simple” semantic feature) is an elementary
piece of information coming from the environment.
The factual agents represent a part of information
MAS. The creation of a factual agent is triggered by
the reception of a simple SF. A new SF incoming in
the system does not always provoke the creation of a
new factual agent. A factual agent is closed to a
simple SF when the proximity measure is strictly
positive. In this case, this FA aggregates the given
SF. This aggregation is called a composite semantic
feature (CSF). The aggregation causes an update of
internal indicators.
3.4 The Game of Risk Example
The game of Risk is used to test our model. At the
beginning of our study, no type of object was
defined a priori. This study allowed us to test our
model and to define these types of objects. The
origin of the information must be treated upstream
(ontological treatment) of the creation of the
semantic feature. The different types of objects
issuing from the study can take four identified
values: territory, player, army, and continent.
Continents and territories are static objects. The
other two have dynamic properties. So for these
objects, it is necessary to associate complete
temporal data.
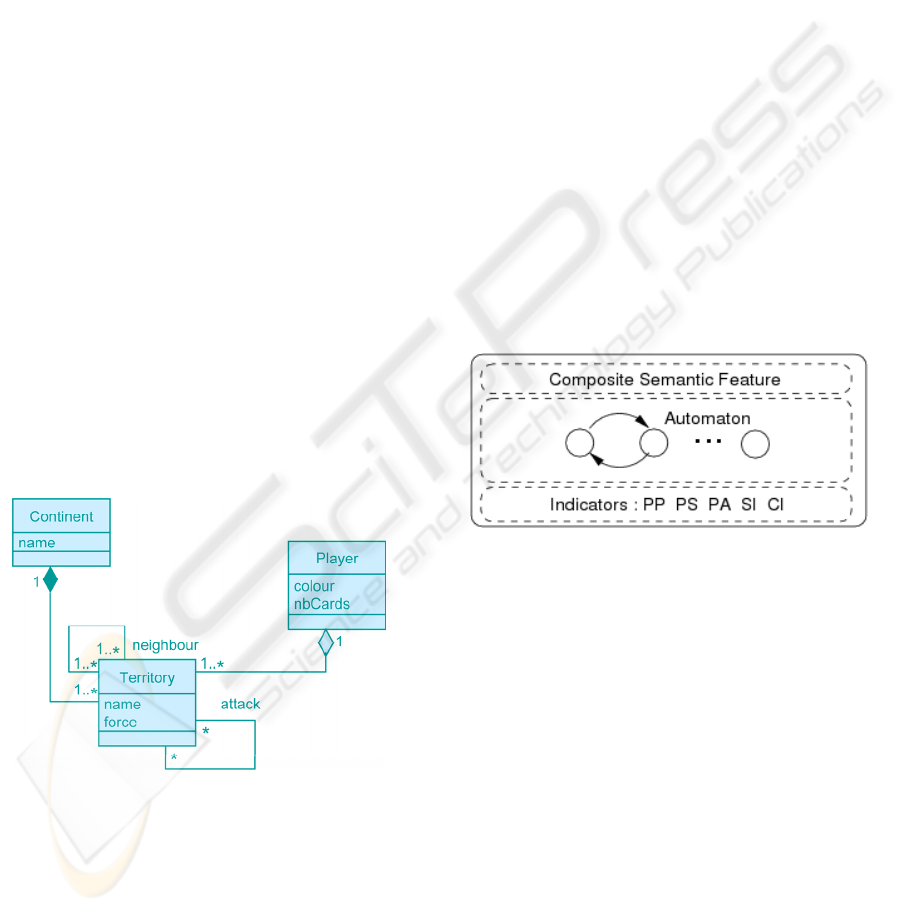
Figure 3: Class Diagram for the Representation of the
Game of Risk.
Continents and territories are regarded as
descriptions of a persistent situation. Continents are
sets of territories; each territory has neighbours
(other territories) and is occupied by armies owned
by a player (see figure 3). Armies and players are
activities respectively observed (occupying a
territory) and driving the actions. An action is an
attack by an army. It is an activity with a known
origin and a determined immediate goal: to conquer
a territory. We define qualifiers and their associated
values for territories. For example colour indicates
the owner (player) and force is the number of
armies.
3.5 Internal Indicators of Factual
Agents
We will now focus only on the internal indicators of
FAs. How are they defined and computed and how
could we interpret them?
An FA is the internal representation of a
composite semantic feature inside the representation
MAS. When an existing semantic feature is updated
then the corresponding factual agent will update its
internal indicators accordingly. The aim of internal
indicators of an FA is to be a synthetic
representation of the evolution of the current
situation that the characterisation MAS will deal
with. An FA has five internal indicators:
pseudoPosition (PP), pseudoSpeed (PS),
pseudoAcceleration (PA), satisfactory indicator (SI)
and constancy indicator (CI). Figure 4 shows a
partial description of the internal structure of a
factual agent.
Figure 4: Partial Internal Structure of an FA.
The proximity measure between two CSFs
returns a real number in [-1 .. 1]. This number is
then multiplied by a coefficient specific to the given
application. This result is the value of the
pseudoPosition indicator:
coefCSFCSFeasureproximityMPP
t
×
=
+
),(
211
The meaning of the pseudoPosition is to
represent the current position of an agent in the
agent representation space. We use the prefix pseudo
because we choose a constant interval of time of one
to simplify the computation of PP, PS and PA. Once
the value of PP is known, consequently PS and PA
are defined:
ttt
PPPPPS
−
=
++ 11
;
.
11 ttt
PSPSPA
−
=
++
PS evaluates the speed of the evolution of PP and
the semantic of PA is the estimation of the evolution
of PS.
DYNAMIC REPRESENTATION OF INFORMATION FOR A DECISION SUPPORT SYSTEM
159
The internal automaton of an FA is an
augmented transition network (ATN) whose
transitions are functions of PP, PS and PA. From a
generic five states ATN, each type of FA is assigned
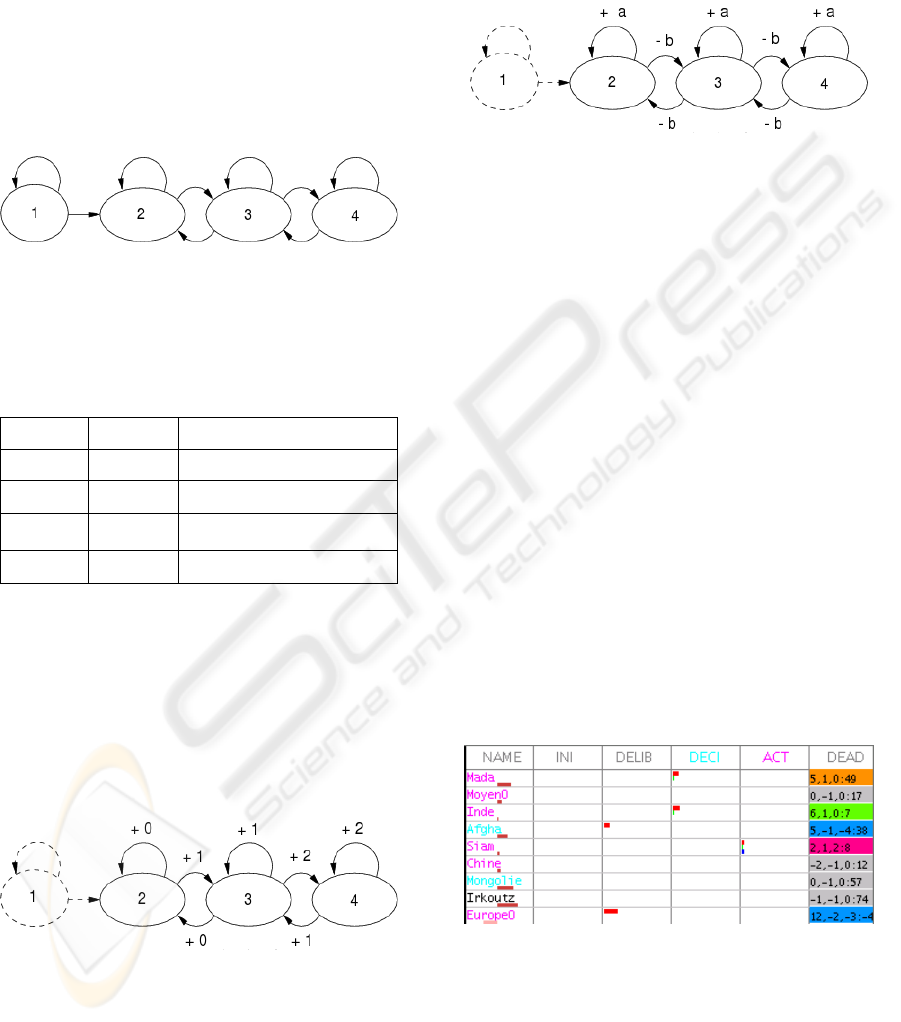
a specific ATN. Figure 5 shows the ATN of
territories factual agents in the game of Risk. The
internal aim of a factual agent is to reach state 4 (S4)
and to stay in this particular state as long as possible.
State 1 (S1) is the initial state and states 2 (S2) and 3
(S3) are intermediary states from S1 to S4. The
transitions from a state to another state or to the
same state are determined by predicates.
Figure 5: ATN of a Territory Factual Agent.
Table 1 shows some examples of predicates in
the game of Risk.
Table 1: Example of Predicates for Transition from a
State to another State of the Internal ATN of an FA.
From To Predicate
S1 S1 PP < 1
S1 S2
PP ≥ 1
S3 S2
PS ≥ 0 and PA ≥ 0
S3 S4
PS < 0 and PA < 0
The choice of a sub ATN from a general ATN
and the definition of the predicates are specific to a
given application. But the definition of the next two
indicators is generic; these indicators must reflect
the kind of evolution of the internal ATN of an FA.
The satisfactory indicator is a valuation of the
success of an FA in reaching and staying in state 4
which is, by design, the ultimate aim of an FA.
Figure 6 presents the calculation of this indicator.
Figure 6: Calculation of Satisfactory Indicator of an FA.
The last ten transitions are summed to obtain a
value in [0 .. 20]. The higher the value, the closer to
the aim is the FA. In case of the maximal value of
20, the FA is said to be fully satisfied.
The constancy indicator will represent the
tendency of a given FA to transit both from a state to
a different state and from a state to the same state
inside the internal ATN. Figure 7 explains how this
indicator is computed.
Figure 7: Computation of Constancy Indicator of an FA.
Positive values of CI must reflect the stability
into a given state and negative values must reveal
transitions between states. Experiments led us to
choose the value of 1 for a, and the value of 9 for b
to have an indicator balanced at around 0.
4 GRAPHIC ANALYSIS TOOLS
We have created and tested some specific graphic
tools for analysing the behaviour of the
representation MAS. We plan to include parts of
these tools later in the intelligent user interface. We
will successively present a dynamic internal view of
the representation MAS, a static view of the same
MAS, a dynamic Gantt chart focusing on the
satisfactory indicator and an animated cartogram
which is a fusion of the static view of the MAS with
the pseudoPosition indicators of FAs.
A MAS could be perceived as a “black box”.
Another option is to trace the dynamic evolution of
each agent. Figure 8 displays the evolution of both
automaton and five indicators of a few FAs in the
game of Risk.
Figure 8: Partial Internal View of the Representation
MAS.
The first column is the name of territories FAs.
The other five columns are the possible states of the
internal automaton, with state 1 called “Ini” for
“initialisation”, state 2 “Delib” standing for
“deliberation”, state 3 “Deci” for “decision”, state 4
“Act” for “action” and finally “Dead” which is part
ICEIS 2006 - ARTIFICIAL INTELLIGENCE AND DECISION SUPPORT SYSTEMS
160
of the generic automaton but is not used for
territories FAs. The colourisation of names indicates
when a given FA has reached a particular state in the
automaton: cyan for state 3 and magenta for state 4.
Positive values of PP, PS and PA are represented
by a coloured rectangle area in the column of the
current state of the automaton (red for PP, green for
PS and blue for PA). The last column is also used
for displaying exact values of PP, PS, PA and CI.
The coloured rectangles below the name of an FA
graphically represent CI with pink for negative
values as in “EuropeO” and red for positive values.
Each background colour in the last column
corresponds to a given interval of values of a
satisfactory indicator as specified by table 2.
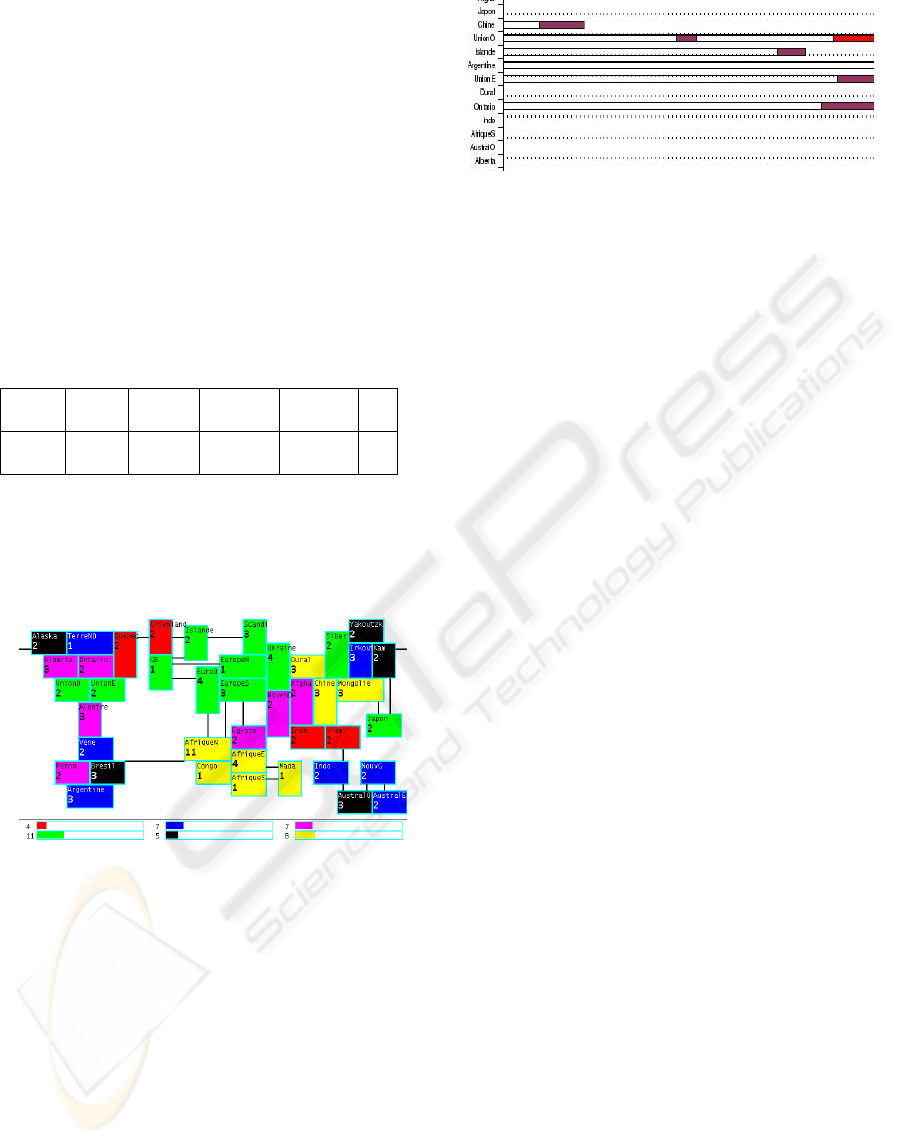
Table 2: Colour of Satisfactory Indicator.
IC
[0 .. 4] [5 .. 9] [10..14] [15..19] 20
colour
grey blue green orange red
Figure 9 displays the static view of the
representation MAS in the game of Risk. This
picture represents the board of the game with the
updated corresponding CSF used as input of the
MAS.
Figure 9: Static View of the Representation MAS.
A Gantt chart shows the timing of activities as
they occur over time. The diagram presents to our
expert the selection of factual agents whose internal
satisfactory indicator is maximal as shown in figure
10. X axis is the time and Y axis is the name of the
factual agent. We can note that only a few factual
agents are fully satisfied, for a different interval of
time and that some factual agents could be fully
satisfied a few times. We are currently designing
complementary views of this internal satisfactory
indicator.
Figure 10: Partial Gantt Diagram of Fully Satisfied FAs.
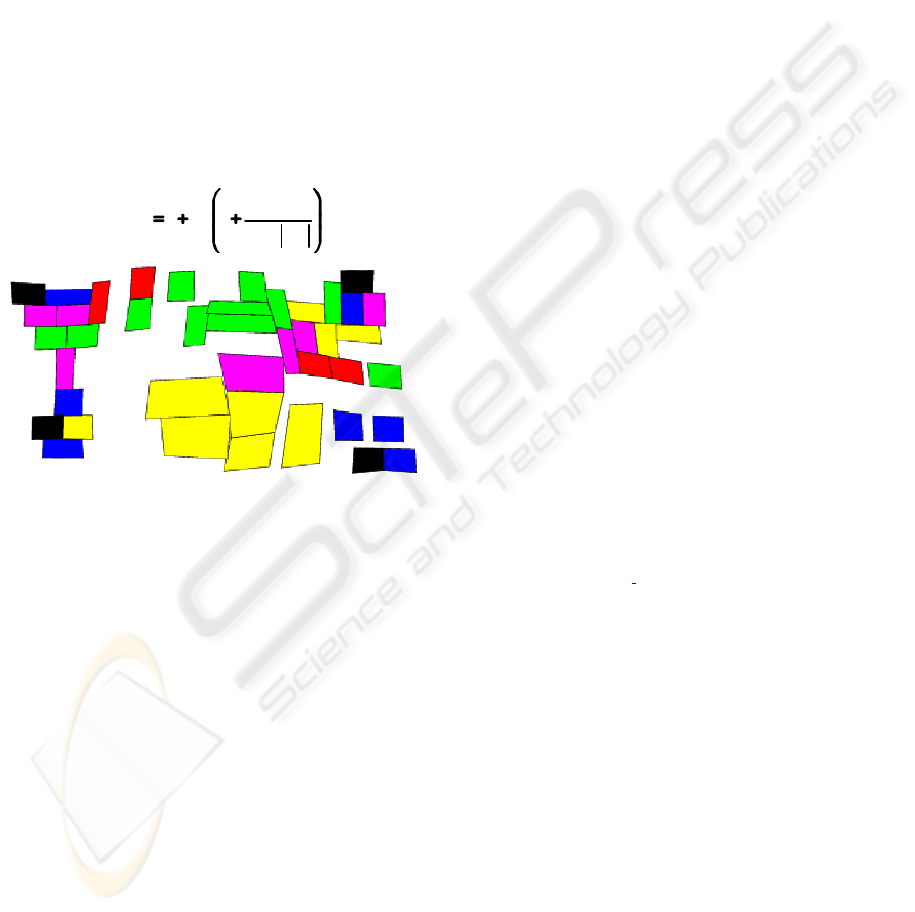
The last analysis tool is animated cartograms.
Using cartograms begun in the early days of
computer science. The basic idea is to distort a
geographical area according to a complementary
criterion you want to represent on the same map.
Tobler (Tobler, 2004) gives the following definition:
“A value-by-area cartogram is a map projection that
converts a measure of a non-negative distribution on
the earth to an area on a map.” 1960 U.S. Population
cartogram and 1981 equal population cartogram of
Britain are examples taken by Kocmoud and House
(Kocmoud & House, 1998) to compare their
algorithm with a number of existing methods. It took
about 20 hours of computer time to produce a single
cartogram. 2002 French presidential election
(Andrieu, 2002) is another example of cartogram
where the time of computation was 33 hours for a
small area. These cartograms share three common
characteristics:
– the use of static data: there is only one set of data
to work on;
– the topic in which cartograms is applied:
geography in a broad sense;
– the time to compute a cartogram.
We offer two complementary views to the users:
the static view which is the current representation of
the situation and the dynamical view with the
evolution between successive static views as
perceived by our agents. The aim of animated
cartograms is to provide users with only one
synthetic view of the situation. To do so, we face
three challenges:
– we do not have a “natural” criterion such as
density of population to compute the cartogram;
– the data are dynamic: the set of data to be used to
construct a given cartogram is permanently
updated;
– we have to compute the resulting cartogram in
quite a short span of time because we need to
provide users with the results as soon as the data
have changed.
The last two challenges could be summarised as
finding a computational method quick enough to
provide the end users with valid information. The
answer was the use of the algorithm of Gastner and
DYNAMIC REPRESENTATION OF INFORMATION FOR A DECISION SUPPORT SYSTEM
161
Newman (Gastner & Newman, 2004) who propose a
new method for constructing cartograms which is
simpler than many other methods, and therefore the
quickest to compute. They illustrated the method
with applications on the results of the 2000 U.S.
Presidential election, lung cancer cases in the State
of New York, and the geographical distribution of
stories appearing in the news. Gastner, Shalizi and
Newman (Gastner, Shalizi & Newman, 2004)
applied the same method to maps and cartograms of
the 2004 US presidential election results.
The last challenge was to find a representative
non negative distribution from internal indicators of
our agents. We called pseudoDensity the distribution
that we compute from the values of the
pseudoPosition. As this internal indicator could have
negative or positive values, we use the following
formulae to transform this indicator to a strictly
positive value:
PP
PP
LnitypseudoDens
max
11
Figure 11: Cartogram of Step 118 of the Game of Risk.
We use morphing between two successive
cartograms to alert the user that the current view will
be updated. Figure 11 shows the new shape of a
cartogram computed with pseudoDensity.
5 CONCLUSION
In this paper we describe a system designed to help
deciders interpret information of a current situation.
The system can represent information with its
dynamic evolution. The core of the system is made
of three MASs, and we have focused here on the
first layer, because it has to represent, and to store
information. The initial goal of the system was to
help deciders prevent crises by analysing the
information they have. We think that the main part
of the system is generic and can be re-used for
different applications. This is why we are testing our
system on various types of applications (prediction
crisis, game of Risk, E-learning, representation of
information). The heart and soul of the system is,
with an original representation of information and a
particular treatment of it, to be able to prevent or/and
predict (depending on the kind of application)
something will (or is) happen(ing). Representation
of information is done in the first layer we
described, by the factual agents which contain the
composite semantic features constituting the atomic
data elements of information. Some graphic tools we
use for helping the decider (but also debugging in
fact), are described in this paper. These tools help us
understand the parameters of the factual agents
which are the most accurate to characterise
information and what are the essential data to
transfer to the second layer of the global system.
We are currently working on some
complementary directions:
– developing new tools for a deeper analysis of the
MASs;
– generating a full set of scenarios for the game of
Risk. The game of Risk is an example we use to
adjust the generic aspects of the core. Other
applications will prove the genericity of the
architecture;
– connecting the representation MAS to the
characterisation MAS which is our immediate
objective.
REFERENCES
Andrieu D., 2005, L'intérêt de l'usage des cartogrammes :
l'exemple de la cartographie de l'élection présidentielle
française de 2002, M@ppemonde 77 (2005.1)
retrieved May 20 2005, from
http://mappemonde.mgm.fr/num5/articles/art05105.html
Barber K. S., Graser T., Col. Silva J. & Holt, J., 1999.
Reference Architecture Representation Environment
(RARE) Guiding Class Derivation and Managing
Tradeoffs during Object-Oriented Analysis. Technical
Report TR99-UT-LIPS-SEPA-03. University of Texas,
Laboratory for Intelligent Processes and Systems.
Bertin J.-C. & Gravé P., 2004. Didactic ergonomics and
Web-based materials design. CALICO 2004. Carnagie
Mellon University, USA.
Boukachour H., Coletta M., Galinho T., Person P., Serin
F. & Simon G., 2001. Preventive Vigil Multiagent
System. SCI2001. Orlando, USA.
Boukachour H., 2002. Système de veille préventive pour
la gestion de situations d’urgence : une modélisation
par organisations d’agents. Application aux risques
industriels. PhD Thesis, University of Le Havre,
France.
Boukachour H., Simon G., Coletta M., Galinho T., Person
P. & Serin F., 2002. Preventive Monitoring
Information System: a Model Using Agent
Organizations, SCI2002. Orlando, USA.
ICEIS 2006 - ARTIFICIAL INTELLIGENCE AND DECISION SUPPORT SYSTEMS
162

Boukachour H., Galinho T., Person P. & Serin F., 2003.
Towards an Architecture for the Representation of
Dynamic Situations, ICAI’03. Las Vegas, USA.
Borodzicz E., Aragones J. & Pidgeon N. 1993
communication in crises: meaning and culture in
emergency response organizations in European
Conference on Technology & Experience in Safety
Analysis and Management, Roma, Italy.
Cardon A., 1997. A multi-agent model for co-operative
communications in crisis management system: the act
of communication, Proceedings of the 7th European-
Japanese Conference on Information Modelling and
Knowledge Bases, pp. 111-123.
Durand S., 1999. Représentation des points de vue
multiples dans une situation d’urgence: une
modélisation par organisations d’agents. PhD Thesis,
University of Le Havre, France.
Gastner M.G. & Newman, M.E.J., 2004. Diffusion-based
method for producing density-equalizing maps.
Proceedings of the National Academy of Sciences,
101(20):7499-7505.
Gastner M., Shalizi C. & Newman, M., 2004. Maps and
cartograms of the 2004 US presidential election
results, retrieved May 20 2005 from http://www-
personal.umich.edu/~mejn/election
Harel, D. 1987. Statecharts: A Visual Formalism for
Complex Systems. Science of Computer Programming
vol. 8.
Hubbard P. 2000. Taming teaching agents, meaning
technologies and participatory dramas. CALICO 2000,
University of Arizona, Tucson, USA.
Kocmoud C.J. & House, D.H., 1998. A Constraint-Based
Approach to Constructing Continuous Cartograms. In
8th International Symposium on Spatial Data
Handling Proceedings, Vancouver, Canada.
Lesage F., 2000. Interprétation adaptative du discours dans
une situation multi participants: modélisation par
agents. PhD Thesis, University of Le Havre, France.
Person P., Boukachour H., Coletta M., Galinho T. & Serin
F., 2005. From Three MultiAgent Systems to One
Decision Support System, 2
nd
Indian International
Conference on Artificial Intelligence, Pune, India.
Risk game: http://en.wikipedia.org/wiki/Risk_(game),
retrieved January 17 2006.
Tobler W., 2004. Thirty-five Years of Computer
Cartograms. Annals of the Assoc. American
Cartographers, 94(1): pp. 58-71.
Wooldridge M. & Jennings, N. R., 1995. Intelligent
agents: theory and practice. The Knowledge
Engineering Review, 10(2), pp. 115-152.
Wooldrige M. & Jennings N. R., 1998. Pitfalls of Agent-
Oriented Development, In K. P. Sycara and M.
Wooldridge, editors: Agents ’98: Proceedings of the
Second International Conference on Autonomous
Agents, ACM Press.
DYNAMIC REPRESENTATION OF INFORMATION FOR A DECISION SUPPORT SYSTEM
163
