
ROBUST, GENERALIZED, QUICK AND EFFICIENT
AGGLOMERATIVE CLUSTERING
Manolis Wallace, Stefanos Kollias
Image, Video and Multimedia Systems Laboratory, Department of Computer Science, School of Electrical and Computer
Engineering, National Technical University of Athens, 9, Iroon Polytechniou, Zografou, Greece
Keywords: Soft computing, agglomerative clustering, dimensionality curse, feature selection, unsupervised techniques,
machine learning
Abstract: Hierarchical approaches, which are dominated by the generic agglomerative clustering algorithm, are
suitable for
cases in which the count of distinct clusters in the data is not known a priori; this is not a rare
case in real data. On the other hand, important problems are related to their application, such as
susceptibility to errors in the initial steps that propagate all the way to the final output and high complexity.
Finally, similarly to all other clustering techniques, their efficiency decreases as the dimensionality of their
input increases. In this paper we propose a robust, generalized, quick and efficient extension to the generic
agglomerative clustering process. Robust refers to the proposed approach’s ability to overcome the classic
algorithm’s susceptibility to errors in the initial steps, generalized to its ability to simultaneously consider
multiple distance metrics, quick to its suitability for application to larger datasets via the application of the
computationally expensive components to only a subset of the available data samples and efficient to its
ability to produce results that are comparable to those of trained classifiers, largely outperforming the
generic agglomerative process.
1 INTRODUCTION
The essence of clustering data is to identify
homogeneous groups of objects based on the values
of their attributes. It is a problem that is related to
vari
ous scientific and applied fields and has been
used in science and in the field of data mining for a
long time, with applications ranging from artificial
intelligence and pattern recognition to database
analysis and statistics (Hirota and Pedrycz, 1999).
Although numerous related texts exist in the
literature, clustering of data is still considered an
open issue, basically because it is difficult to handle
in the cases that the data is characterized by
numerous measurable features; This is often referred
to as the dimensionality curse.
Works in the field of classi
fication, on the other
hand, focus in the usage of labeled (characterized)
data, also known as training data, for the automatic
generation of systems that are able to classify (label)
future data; this classification relies on the similarity
of incoming data to the training data. In these
works, the metric that may assess its efficiency is the
classification rate on incoming data.
Typically, in order to pursue such a task, one
first n
eeds to detect the patterns that underlie in the
data via data clustering, and then study the way
these patterns relate to meaningful classes. Even
when using self - training systems, such as resource
allocating neural networks, that are able to adapt
themselves to the training data, good results, i.e.
efficient classifier structures, may only be achieved
when the patterns are known before hand, so that
they may be used for proper initialization (Haykin,
1999). Extraction of actionable information from
detected clusters is typically tackled via the selection
of cluster representatives and cluster centroids, or
via the extraction of (fuzzy) rules (Hirota and
Pedrycz, 1999).
Although the tasks of classification and
clustering are closely related, an i
mportant
difference exists among them. While in the task of
classification the main goal is the distinction
between classes, i.e. the detection of class
boundaries, in the task of clustering the main goal is
the identification of data patterns. Thus, the
classification rate is not a suitable metric for the
409
Wallace M. and Kollias S. (2004).
ROBUST, GENERALIZED, QUICK AND EFFICIENT AGGLOMERATIVE CLUSTERING.
In Proceedings of the Sixth International Conference on Enterprise Information Systems, pages 409-416
DOI: 10.5220/0002639604090416
Copyright
c
SciTePress

evaluation of the efficiency of the clustering process;
the efficiency of a resulting classifier is.
Various types of clustering techniques exist,
each one displaying a distinct set of advantages and
drawbacks; a common distinction is between
hierarchical and partitioning clustering algorithms.
Hierarchical approaches, which are dominated by
the generic agglomerative clustering algorithm, are
suitable for cases in which the count of distinct
clusters in the data is not known a priori; this is not a
rare case in real data. On the other hand, important
problems are related to their application, such as
susceptibility to errors in the initial steps that
propagate all the way to the final output and high
complexity. Finally, similarly to all other clustering
techniques, their efficiency decreases as the
dimensionality of their input increases.
In this paper we propose a robust, generalized,
quick and efficient extension to the generic
agglomerative clustering process. Robust refers to
the proposed approach’s ability to overcome the
classic algorithm’s susceptibility to errors in the
initial steps, generalized to its ability to
simultaneously consider multiple distance metrics,
quick to its suitability for application to larger
datasets via the application of the computationally
expensive components to only a subset of the
available data samples and efficient to its ability to
produce results that are comparable to those of
trained classifiers, largely outperforming the generic
agglomerative process.
The structure of the paper is as follows: in
section 2., we present the extension to the generic
agglomerative process that allows for the
simultaneous consideration of multiple metrics. This
step is based on an integration of the generic process
with a feature selection technique and may be
applied to a subset of the available data set. In
section 3 we present a classification step that
extends the results of the clustering step to the whole
data set, while at the same time correcting errors in
its output. This step, due to its linear complexity,
may be applied iteratively until equilibrium is
reached, thus providing excellent classification rate.
Finally, section 4 presents experimental proof of the
proposed methodology’s efficiency through a
comparative study and section 5 lists our concluding
remarks.
2 GENERALIZED
AGGLOMERATIVE
CLUSTERING
Hierarchical methods are divided into agglomerative
and divisive. Of those, the first are the most widely
studied and applied, as well as the most robust. Their
general structure is as follows (Miyamoto, 1990):
1. Turn each input element into a singleton, i.e. into
a cluster of a single element.
2. For each pair of clusters
, calculate their
distance
. Merge the pair of clusters
that have the smallest distance. Continue at step
2, until the termination criterion is satisfied.
1
c
2
c
(
12
,dc c
)
The termination criterion most commonly used
is the definition of a threshold for the value of the
distance. The two key points that differentiate
agglomerative methods from one another, and
determine their efficiency, are the distance and the
termination criterion used. Major drawbacks of
agglomerative methods are their high complexity
and their susceptibility to errors in the initial steps,
that propagate all the way to their final output.
The core of the above generic algorithm is the
ability to define a unique distance among any pair of
clusters. Therefore, when the input space has more
than one dimensions, an aggregating distance
function, such as Euclidean distance, is typically
used (Yager, 2000). This, of course, is not always
meaningful and there are cases where a selection of
meaningful features needs to be performed, prior to
calculating a distance (Wallace and Stamou, 2002).
In other words, it may not be possible to select a
single distance metric, which will apply in all cases,
for a given data set. Moreover, one feature might be
more important than others, while all of the features
are useful, each one to its own degree.
In this paper we tackle feature weighting based
on the following principle: while we expect elements
of a given meaningful set to have random distances
from one another according to most features, we
expect them to have small distances according to the
features that relate them. We rely on this difference
in distribution of distance values in order to identify
the context of a set of elements, i.e. the subspace in
which the set is best defined.
More formally, let
and be two clusters of
elements. Let also
, be the metric that
compares the
-th feature, and F the overall count of
features (the dimension of the input space). A
1
c
2
c
i
r
F
iNÎ
i
ICEIS 2004 - ARTIFICIAL INTELLIGENCE AND DECISION SUPPORT SYSTEMS
410

distance measure between the two clusters, when
considering just the
i -th feature, is given by:
12
,
12
12
(,)
(, )
iii
cbc
i
rab
fcc
cc
k
a
k
ÎÎ
=
å
where
is the i -th feature of element ,
i
e e
c is the
cardinality of cluster
and
c
k
is a constant. The
overall distance between
and is calculated as:
1
c
2
c
12 12 12
(, ) (, ) (, )
F
ii
iN
dc c x c c f c c
l
Î
=
å
where
i
x
is the degree to which , and therefore i
i
f
, is included in the soft selection of features,
and is a constant. Based on the principle
presented above, values of vector
F
iNÎ
l
x
as selected
through the minimization of distance
(Wallace and Kollias, 2003).
(
12
,dx x
)
The operation of algorithm presented herein is
defined by two manually set parameters, namely
l
and
k
. The former may be used to adjust the
softness of the algorithm, i.e. the degree to which
the inclusion of multiple features in the overall
distance is favored. As
the selection of
1l ®
x
approaches the crisp case, in which the best feature
is selected to a degree of one and all other features
are ignored. As
l
the minimization of the
overall distance leads to the selection of all features
to the same degree. Consequently, lowering the
values of
l is equivalent to hardening the feature
selection process; increasing
l
lets more features
participate in the determination of the overall
distance. As far as
®¥
k
is concerned, its influence on
distances
i
f
is similar to the one reported in (Yager,
2000) for the generalized mean operators. As
k
®
-
¥
distance
i
f
approaches the min operator
while as
k distance ®+¥
i
f
approaches the max
operator; these correspond to the minimum and
maximum linkage hierarchical clustering approaches
(Miyamoto, 1990). Other special values are
k ,
which yields the mean value (average linkage
clustering), and
, which yields the Euclidian
distance. Generally, as
1=
2k =
k
increases small clusters
are favored as wining clusters, leading to the
creation of equally sized clusters, while smaller
values of k favor the merging of larger clusters,
leading to the creation of few large clusters with
“neglected” singletons.
As we have already mentioned, agglomerative
clustering algorithms suffer from high computational
complexity. Thus, researchers are generally reluctant
to propose any modifications that may further
deteriorate their execution time. In the proposed
approach, the overall distance is calculated directly,
without any computational overhead. Specifically,
although typically, a task that includes some sort of
optimization is tackled via repetitive techniques
whose computational needs largely exceed linearity,
in this work optimization has been achieved
analytically, thus guaranteeing that the overall
complexity of the clustering algorithm remains
unaltered.
3 REFINEMENT VIA BAYESIAN
CLASSIFICATION
In order make the proposed methodology applicable
in real life situations, its complexity needs to be
seriously taken into consideration. Specifically,
having the high computational needs of the generic
agglomerative process, the procedure described in
the previous section cannot be applied to larger data
set. Thus, we choose to apply it to a smaller random
subset of the available data, and then extend its
results to the remaining data.
This can be accomplished via classifying the
remaining data to one of the clusters using some
classification scheme. Of course, numerous
classification schemes have been proposed and
could be applied for our task (Lim et al., 2000). In
this work we choose to work with the Bayesian
classifier; other classifiers have been tested as well,
but with inferior results.
Specifically, each cluster is considered to
describe a distinct and meaningful pattern; works
exist in which detected clusters are filtered as to
remove those that are most probably not related to
meaningful patterns, before any other analysis takes
place (Wallace et al., 2003). Furthermore, we
assume that all features of members of a class follow
a gaussian distribution. Thus, using the centroid and
standard deviations of each cluster, we may design
the mixture of Gaussians that describe it.
Let
be one of the data samples to classify.
For simplicity, we will also use
to denote the
event where the features of an input data sample are
equal to those of
a
. Similarly, we will use to
a
a
i
p
ROBUST, GENERALIZED, QUICK AND EFFICIENT AGGLOMERATIVE CLUSTERING
411

denote both the pattern that corresponds to cluster
i
and the event of a data sample belonging to that
cluster. The Bayes classification scheme calculates
the probabilities
()
/
i
P
pa
, , where T is
the count of detected patterns, and classifies
to
the pattern
for which it has the greatest
probability;
T
iNÎ
a
i
p
(
/
i
)
P
pa
is the a posteriori probability
of the event that the input data sample is an instance
of pattern
, under the condition that the features
of the input data samples are those of
a
. We
compute these probabilities as
i
p
()()(
//
ii
)
i
P
pa PapPp=
as
when we attempt to classify data
sample
. We calculate the a priori probability
()
1Pa=
a
()
i
P
p
as the relative cardinality of the
corresponding cluster
, while the conditional
probability
i
c
(
/
i
)
P
ap
is calculated based on the
assumption of gaussian distributions; it is calculated
as the value of the
F
-dimensional point in the
mixture of Gaussians that describes pattern
:
a
i
p
()
P
i
i
j
jN
c
Pp
c
Î
=
å
()
2
1
/
2
jm
ij
ij
F
a
s
i
jN
ij
Pa p e
sp
-
æö
÷
ç
÷
ç
÷
-
ç
÷
ç
÷
ç
÷
ç
÷
èø
Î
=
Õ
where
and
ij
m
ij
s
are the mean value and standard
deviation for the
-th feature of cluster and
is the
-th feature of data sample .
j
i
c
j
a
j
a
Using this scheme, we may classify the whole
data set, including the subset on which the step of
generalized agglomerative clustering was applied.
This, simultaneously to clustering the remaining data
samples, refines the initial result by removing
misclustered data samples that are a result of errors
in the first step of the process, thus making the
overall technique more robust.
If the original clustering is efficient, i.e. it has
correctly detected the underlying patterns, regardless
of any mis-assignments, the classification rate of this
classification step shall be high. Thus, we may use
the classification rate with respect to the one of the
original clustering step, or to that of other
techniques, in order to evaluate the performance of
the algorithm.
A partitioning of the set of data samples, such as
the output of the initial agglomerative clustering
step, is closed under the operation of reclassification,
i.e. the output is again a partitioning of the set of
data samples. Moreover, it is easy to show that the
computational complexity of the reclassification
process is linear, with respect to the count of data
samples in the data set. Thus, it is both theoretically
possible and computationally inexpensive to apply
the step of reclassification recursively until
equilibrium is reached (partitioning does not alter),
or until the differences between successive
partitionings become negligible
4 EXPERIMENTAL RESULTS
In this section we list experimental results of the
proposed methodology. In subsection 4.1 we
provide an example of application to a simple
synthetic data set, which facilitates the visualization
of the algorithm’s operation. Continuing, in
subsection 5.2 we list results from application to real
data sets from the machine learning databases.
4.1 Synthetic Data
To make the visualization of the synthetic data set
feasible, we have limited it to two dimensions.
Three classes of data were created, using a Gaussian
random generator. The mean values and
standard deviations s
1
and s
2
of the Gaussian
distributions used for the generation of the data set
are presented in Table 1, while the feature values of
the generated data samples are presented in Figure 1
in the form of a two dimensional plot.
1
m
2
m
Table 1: The parameters for the generation of the synthetic
data set
.
Class
m
1
s
1
m
2
s
2
Samples
A 2 0.5 1 0.1 100
B 1 0.9 3 0.1 100
C 1 0.1 2 0.7 100
As can be seen from the figure, the three classes
are not clearly distinguished from each other; this
greatly complicates the problem of pattern
ICEIS 2004 - ARTIFICIAL INTELLIGENCE AND DECISION SUPPORT SYSTEMS
412
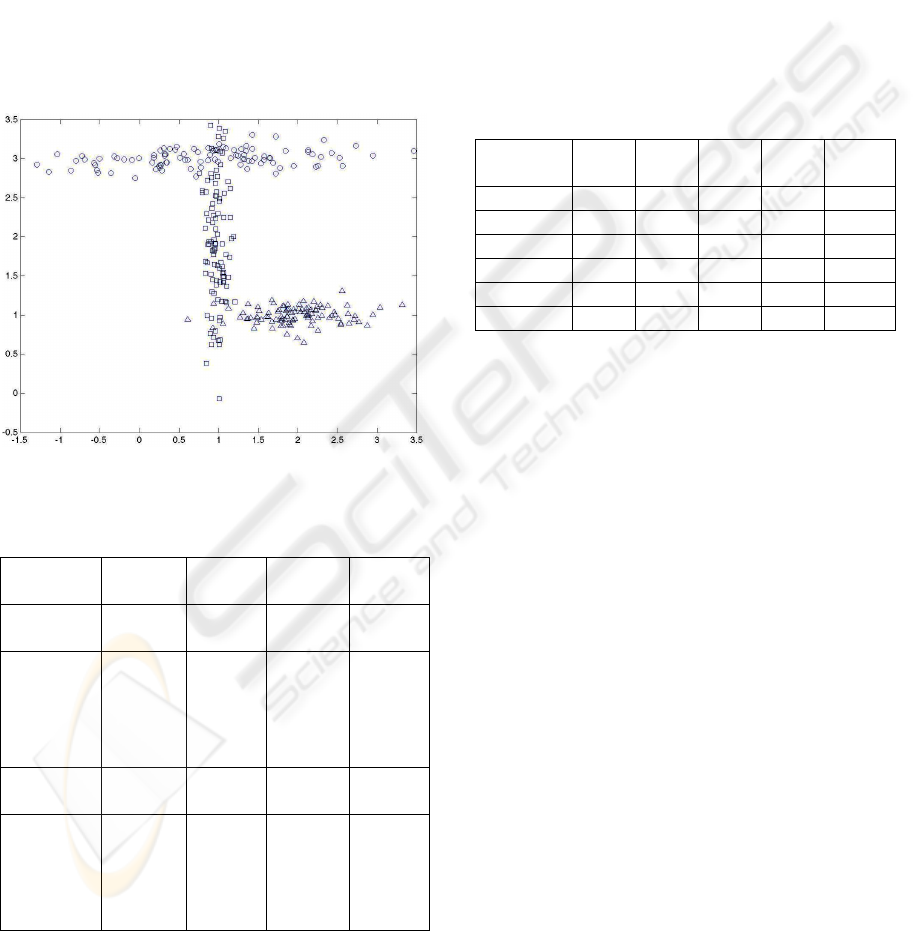
extraction. Moreover, it is obvious that the
subspaces that best characterize each class differ to a
great extent, as the directions of the clusters in the
two dimensional space are quite different from each
other; this renders classical mean – based
approaches inefficient; this can be seen in Table 2,
where we can see that the utilization of a Euclidian
distance – based metric leads to poor performance,
as this is indicated by both the low classification rate
of the initial clustering and the failure of the
reclassification process to enhance this rate
(Classification rates are calculated by assigning each
cluster to the class that dominates it). In the table,
the triplet (a,b,c) indicates the counts a,b,c of
elements that belong to class A,B,C respectively.
Figure 1: The synthetic data set. Data samples of the three
classes are represented by circles, squares and triangles
Table 1: Results from application on the synthetic data set.
(λ=2)
Method Cluster 1 Cluster 2 Cluster 3
Classific.
rate
Euclidian
clustering
0,0,13 28,0,87 72,100,0 66.7%
Euclidian
clustering
and
Bayesian
classific.
0,0,9 29,0,91 71,100,0 65.3%
Proposed
clustering
4,0,86 92,5,8 4,95,6 91%
Proposed
clustering
and
Bayesian
classific.
6,0,98 94,5,2 0,95,0 95.7%
On the contrary, the initial clustering step, using
the method presented herein, produces a
classification rate of 91%, and the reclassification
refines this to 95.7%; this indicates that the initial
step, although having a smaller classification rate,
has correctly identified the underlying patterns. The
patterns detected by the two approaches are
presented in Table 3 (Results of the Euclidian
distance based approach are presented first and the
results of the proposed approach follow). It is
obvious that:
– The Euclidian distance – based approach fails to
detect the patterns that were used to generate the
synthetic data set.
– The patterns detected by the proposed approach
barely differ from the ones that were used to
generate the synthetic data set.
Table 3: The patterns detected in the synthetic data set
Dominating
class
m
1
s
1
m
2
s
2
samples
C 2.59 0.40 3.05 0.07 9
B 1.56 0.61 1.23 0.44 171
C 0.75 0.74 2.96 0.19 120
A 2.03 0.41 1.00 0.11 95
B 0.86 0.95 3.01 0.11 104
C 0.98 0.10 1.84 0.74 101
4.2 Real Data
In this subsection we provide results from the
application of the proposed algorithm to a number of
machine learning databases, namely the iris data, the
Wisconsin breast cancer database and the ionosphere
database. All these data sets are available from the
UCI Repository of Machine Learning Databases.
With these results we aim to demonstrate the
efficiency of the proposed algorithm and contrast its
results to those of other works in the literature.
4.2.1 Iris data
The iris data set contains 150 samples, characterized
by 4 features, that belong to three classes; two of
these classes are not linearly separable from each
other. For the initial step of agglomerative clustering
we have used 30 randomly selected data samples.
Results are shown in Table 4 and in Figure 2.
The classification rate reported after the initial
clustering is very poor. Still, the considerable
refinement that a single step of Bayesian
reclassification offers is indicative of the validity of
the detected patterns. This observation is supported
even more by the fact that recursive application of
the reclassification step refines even more the
results, even though these steps are unsupervised,
i.e. they do not use data sample labels as an input.
ROBUST, GENERALIZED, QUICK AND EFFICIENT AGGLOMERATIVE CLUSTERING
413
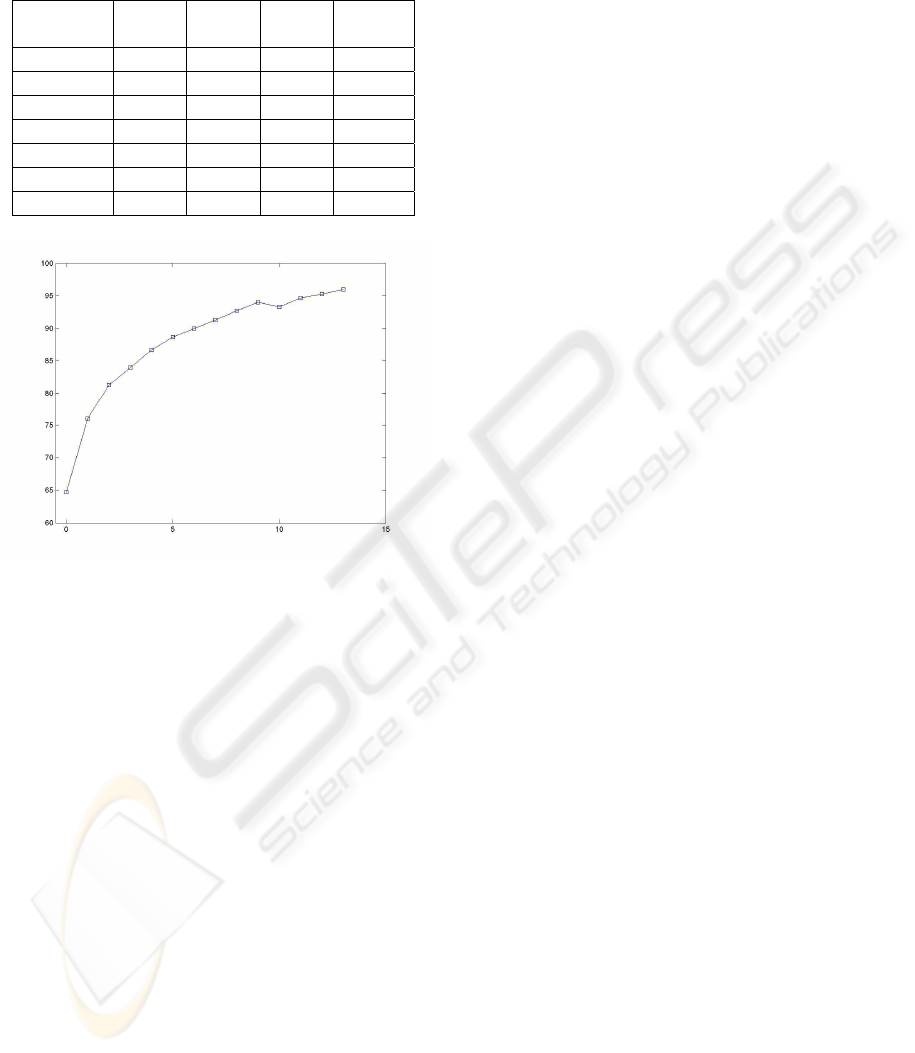
After 13 applications of the reclassification step the
equilibrium is reached.
Table 2: Classification rates for iris data. (λ=1.2 κ=2)
Reclass.
step
Cluster
1
Cluster
2
Cluster
3
Classific.
rate
Clustering 1,0,4 5,0,5 4,10,1 63.3%
1
st
reclass. 4,0,21 43,0,29 3,50,0 76%
2
nd
reclass. 2,0,24 48,0,26 0,50,0 81.3%
3
rd
reclass. 2,0,28 48,0,22 0,50,0 84%
7
th
reclass. 2,0,39 48,0,11 0,50,0 91.3%
9
th
reclass. 2,0,43 48,0,7 0,50,0 94%
13
th
reclass. 4,0,48 46,0,2 0,50,0 96%
Figure 2: Classification rates for iris data, as a function of
reclassification iterations
As we have already explained, the
reclassification process is not computationally
expensive, and thus the increased number of
iterations required does not constitute a drawback.
The final classification rate of 96% is superior to
those of classic unsupervised partitioning
techniques; most works report a classification rate
that does not exceed 90%. k-means and fuzzy c-
means, for example both have a classification rate of
89.3% on the iris data set. An extension of the
latter, alternative fuzzy c-means (AFCM) (Wu and
Yang, 2002), reaches a classification rate of 91.3%,
which is the best reported by unsupervised
algorithms for the iris data set. As far as other
existing hierarchical approaches are concerned, they
typically have much lower classification rates on the
iris data set; the Euclidian distance – based approach
that was applied in the synthetic data set, for
example, produces a classification rate of 74.7%
when applied on the whole dataset, which
deteriorates slightly and stabilizes at 74% after
reclassification.
4.2.2 Wisconsin Breast Cancer Database
The Wisconsin breast cancer database contains 699
samples, which are characterized by the following
attributes: clump thickness, uniformity of cell size,
uniformity of cell shape, marginal adhesion, single
epithelial cell size, bare nuclei, bland chromatin,
normal nucleoli, mitoses. All these attributes
assume integer values in [1,10]. Data samples are
also accompanied by an id, and class information;
possible classes are benign and malignant. 65.5% of
the samples belong to the benign class and 34.5% to
the malignant class. 16 samples are incomplete (an
attribute is missing) and have been excluded from
the database for the application of our algorithm.
The initial clustering step is applied on 50 data
samples, i.e. to less that 10% of the data set.
Detailed results acquired using the proposed
methodology are available in Table 4 and Figure 3.
It is worth noting that, although the classification
rate of the initial clustering procedure is not
extremely high, the reclassification steps refine it
considerably, thus verifying the efficiency of the
first step. Furthermore, the iterative reclassification
process classifies every sample to one of exactly two
clusters, each one almost totally dominated by one
of the two existent classes. We can also observe that
the figure differs from the corresponding one for iris
data (Figure 2) in that a temporary drop of the
classification rate is observed after step 4. This does
not indicate some sort of instability of the algorithm;
it merely corresponds to the step where two clusters
are merged into one, as can be seen in Table 4.
Some of the best classification rates reported for
this data set by supervised methods in the literature
are presented in Table 5. The classification rate
reported by our (unsupervised) method is
comparable to them, and even exceeds some of
them. More importantly, the number of clusters in
our approach is considerably smaller that the number
of clusters reported in these works. Thus, the output
of the proposed algorithm may be used to initialize a
superior classifier; small numbers of clusters are
important in classifier initialization as they
contribute to computational efficiency, low training
times and good generalization. In (Tsapatsoulis et
al. 2003) such a classifier is presented, using a
resource allocating, RBF neural network; it achieves
a classification rate of 98% using 3 clusters, thus
outperforming all aforementioned approaches.
ICEIS 2004 - ARTIFICIAL INTELLIGENCE AND DECISION SUPPORT SYSTEMS
414
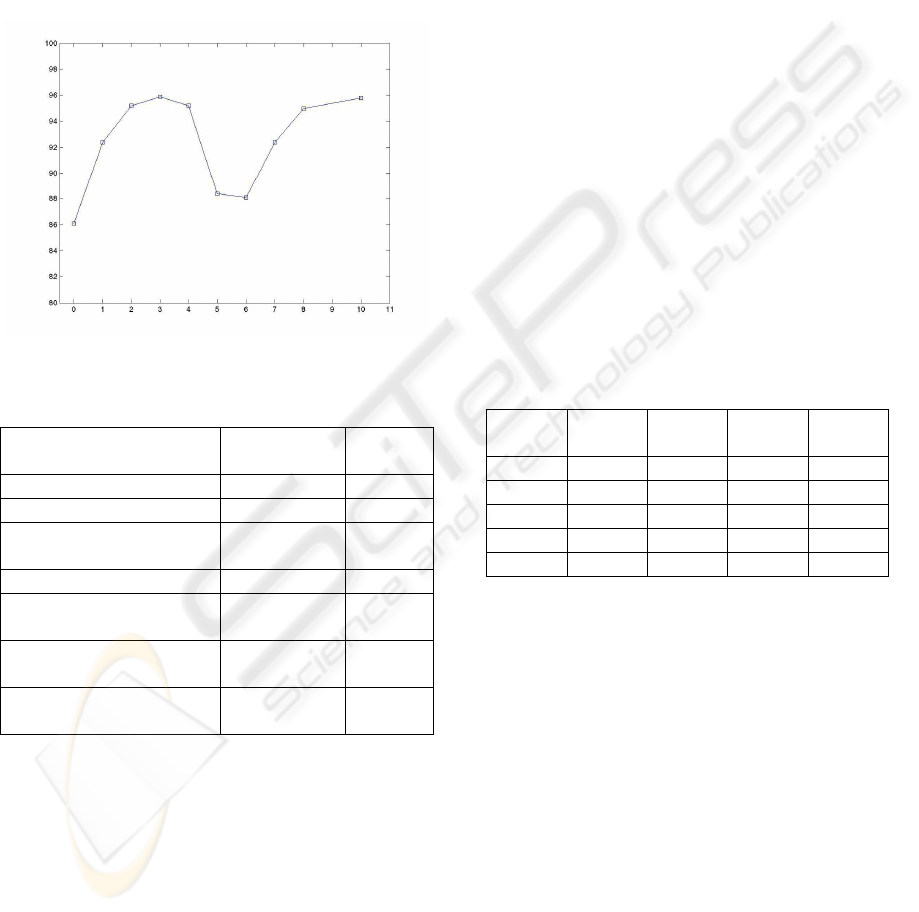
Table 3: Classification rates for Wisconsin data.
(λ=1.3 κ=2)
Reclass. step Cluster 1 Cluster 2 Cluster 3 Classific.
rate
Clustering 30,4 1,7 2,6 86%
1
st
reclass. 438,46 0,138 6,55 92.4%
4
th
reclass. 414,3 0,116 30,120 95.2%
5
th
reclass. 0,0 0,113 444,126 88.4%
7th
reclass. 0,0 0,193 438,46 92.4%
10
th
reclass. 0,0 24,234 420,5 96.6%
Figure 3.Classification rates for Wisconsin data, as a
function of reclassification iterations
Table 4. Comparative study on the Wisconsin data
Method Classific. rate
Count of
patterns
Proposed approach 96.6% 2
Nauk and Kruse, 1997 96.7% 7
Kasabov and Woodford,
1999
95.3% 17
Kasabov, 1996 95.3% 9
Halgamuge and Glesner,
1994
96% 7
Bagui et al., 2003 96.17%
200
samples
K-NN 96.34%
200
samples
4.2.3 Ionosphere Database
This radar data was collected by a system in Goose
Bay, Labrador. The targets were free electrons in the
ionosphere. Samples of the data set are
characterized by 34 features and are classified as
either good or bad. Good radar returns are those
showing evidence of some type of structure in the
ionosphere. Bad returns are those that do not.
Results from the application of the proposed
methodology appear in Table 6.
This data set is a classical example for the
demonstration of the results of the dimensionality
curse. As expected, the hierarchical clustering
algorithm that equally considers all features fails to
detect existing patterns. Moreover, any attempt to
reclassify data renders a classification rate of
61.10%, which corresponds to the percentage of
good samples in the data set all samples are
assigned to the same pattern . Thus, this approach
has totally failed to distinguish any patterns in the
data set. The results of the proposed approach, on
the other hand, exceed those of other unsupervised
clustering methods, which typically do not exceed a
classification rate of 80% for this data set; a
classification rate of 82% is reported in (Aggarwal
and Yu, 2002) for 10 clusters. After the
classification step for 25 clusters our algorithm
outperforms or is comparable to most supervised
classifiers as well: linear discriminant analysis
LDA (Friedman, 1997) has a rate of 86.3%,
classification trees CTREE (Breiman et al., 1984)
have a rate of 87% and the combinatory approaches
of CTREE-bagging (Breiman, 1996) and double-
bagging (Hothorn and Lausen, 2003) have rates of
90.7% and 93.3%, respectively.
Table 5. Classification rates for ionosphere data.
(λ=2 κ=2).
No of
clusters
Euclidian
clustering
After
classific.
Proposed
clustering
After
classific.
2 64.39% 61,10% 87.2% 80%
10 67.81% 61,10% 87.2% 84.9%
15 69.80% 61,10% 87.2% 87.2%
20 71.79% 61,10% 87.2% 87.7%
25 74.01% 61,10% 87.2% 91.2%
5 CONCLUSIONS
In this paper we proposed a robust, generalized,
quick and efficient extension to the generic
agglomerative clustering process. Our approach is
divided in two distinct steps. The first is an
integration of the generic agglomerative process,
which makes it possible for the process to consider
multiple distance metrics. This makes the process
suitable for application on multidimensional data
sets, as was made obvious via application on the
ionosphere data set. The second step is a Bayesian
classification step that uses the initial cluster
assignments as labels. This step refines the initial
clustering by removing some errors.
ROBUST, GENERALIZED, QUICK AND EFFICIENT AGGLOMERATIVE CLUSTERING
415

Since only the first step is computationally
expensive, applying it only a subset of the data set
and using the second step to generalize the result to
the remaining data samples we can make the overall
approach applicable to larger data sets; this option is
not available in the generic agglomerative process.
The efficiency of the proposed algorithm has
been demonstrated via application to a synthetic data
set as well as to a variety of real data sets; although
classical hierarchical approaches fail in these
examples, the performance of our approach was
shown to be comparable to those of supervised
partitioning algorithms and of trained classifiers.
In the framework of the EU IST-1999-20502
"FAETHON" project, we are applying this
methodology for analysis of information retrieval
usage history aiming at the extracting semantic and
metadata related user preferences.
REFERENCES
Aggarwal, C.C., Yu, P.S. 2002 Redefining clustering for
High–Dimensional Applications. IEEE Transactions
on Knowledge and Data Engineering 14 2 , 210–225.
Bagui, S.C., Bagui, S., Pal, K., Pal, N.R. 2003 Breast
cancer detection using rank nearest neighbor
classification rules. Pattern Recognition 36, 25–34.
Breiman, L. 1996 Bagging Predictors, Machine Learning
24 2 , 123–140.
Breiman, L., Friedman, J.H., Olshen, R.A., Stone, C.J.
1984 Classification and Regression Trees, Wadsworth,
California.
Friedman, J.H. 1997 On bias, variance, 0/1-loss, and the
curse-of-dimensionality, Data Mining Knowledge
Discovery 1 1 , 55–77.
Halgamuge, S., Glesner, M. 1994 Neural Networks in
designing fuzzy systems for real world applications.
Fuzzy Sets and Systems 65, 1-12
Haykin, S. 1999 Neural Networks: A Comprehensive
Foundation, 2nd edition. Prentice Hall.
Hirota, K., Pedrycz, W. 1999 Fuzzy computing for data
mining. Proceedings of the IEEE 87, 1575–1600.
Hothorn, T., Lausen, B. 2003 Double-bagging:
combining classifiers by bootstrap aggregation.
Pattern Recognition 36, 1303–1309.
Kasabov, N. 1996 Learning fuzzy rules and approximate
reasoning in fuzzy neural networks and hybrid systems.
Fuzzy Sets and Systems 82, 135–149
Kasabov, N., Woodford, B. 1999 Rule insertion and rule
extraction from evolving fuzzy neural networks:
Algorithms and applications for building adaptive,
intelligent, expert systems. Proceedings of the IEEE
International Conference on Fuzzy Systems FUZZ-
IEEE
Lim, T.-S., Loh, W.-Y., Shih, Y.-S. 2000 A Comparison
of Prediction Accuracy, Complexity, and Training
Time of Thirty-three Old and New Classification
Algorithms. Machine Learning 40, 203–229.
Miyamoto, S. 1990 Fuzzy Sets in Information Retrieval
and Cluster Analysis. Kluwer Academic Publishers.
Nauk, D., Kruse, R. 1997 A neuro-fuzzy method to learn
fuzzy classification rules from data. Fuzzy sets and
Systems 8, 277-288
Tsapatsoulis, N., Wallace, M. and Kasderidis, S. 2003
Improving the Performance of Resource Allocation
Networks through Hierarchical Clustering of High –
Dimensional Data. Proceedings of the International
Conference on Artificial Neural Networks ICANN ,
Istanbul, Turkey.
Wallace, M., Akrivas, G. and Stamou, G. 2003
Automatic Thematic Categorization of Documents
Using a Fuzzy Taxonomy and Fuzzy Hierarchical
Clustering, Proceedings of the IEEE International
Conference on Fuzzy Systems FUZZ-IEEE , St.
Louis, MO, USA.
Wallace, M. and Kollias, S. 2003 Soft Attribute Selection
for Hierarchical Clustering in High Dimensions,
Proceedings of the International Fuzzy Systems
Association World Congress IFSA , Istanbul, Turkey.
Wallace, M. and Stamou, G. 2002 Towards a Context
Aware Mining of User Interests for Consumption of
Multimedia Documents, Proceedings of the IEEE
International Conference on Multimedia and Expo
ICME , Lausanne, Switzerland.
Wu, K.L., Yang, M.S. 2002 Alternative c-means
clustering algorithms, Pattern Recognition 35 10 ,
2267–2278.
Yager, R.R. 2000 Intelligent control of the hierarchical
agglomerative clustering process. IEEE Transactions
on Systems, Man and Cybernetics, Part B 30 6 , 835–
845.
IST-1999-20502. FAETHON: Unified Intelligent Access
to Heterogeneous Audiovisual Content.
http://www.image.ece.ntua.gr/faethon/
ICEIS 2004 - ARTIFICIAL INTELLIGENCE AND DECISION SUPPORT SYSTEMS
416
