
PERFORMANCE IMPROVEMENT BY
WORKFLOW MANAGEMENT SYSTEMS
Preliminary results from an empirical study
Hajo A. Reijers
Department of Technology Management, Technische Universiteit Eindhoven , Den Dolech 2, Eindhoven, The Netherlands
Keywords: Workflow management systems, performance measurement, case study, empirical research
Abstract: Workflow Management (WfM) s
ystems have acquired a respectable place in the market of enterprise
information systems. Although it is clear that implementation of a WfM system may shorten process
execution and increase efficiency, little is known about the extent of these effects on business process
performance. In this paper, we report on a running longitudinal multi-case study into the quantitative effects
of WfM systems on logistic parameters such as lead time and service time. We conclude that in most cases
significant decreases of lead time and service time will take place for the cases under consideration. In the
presentation of our research outline, we show how we use process simulation for the validation of our
measurements, the prediction of performance improvement, and the comparison of the pre- and post-
implementation situation. As a side effect of this study, we present some interesting characteristics of actual
business processes and the way WfM systems are implemented in practice.
1 INTRODUCTION
Workflow management (WfM) systems have been
around since the early nineties, while their
conceptual predecessors range back even further
(see e.g. Ellis, 1979). Although not as widespread as
for example Enterprise Resource Planning systems,
they have become "one of the most successful
genres of systems supporting cooperative working"
(Dourish, 2001). The worldwide WfM market,
estimated at $213.6 million in 2002, is expected to
redouble by 2008 (Wintergreen, 2003). Furthermore,
WfM functionality has been embedded by many
other contemporary systems, such as ERP, CRM,
and call-center software.
The alleged advantages of WfM systems are
cl
ear. By having a dedicated automated system in
place for the logistic management of a business
process, such processes could theoretically be
executed faster and more efficiently (Lawrence,
1997). Yet, very little is known about the extent of
performance improvement an organization may
experience in practice. Single case studies are
available (e.g. Prinz and Kolvenbach, 1996; Goebl et
al., 2001), but do not lend themselves for
generalization. Few empirical studies that include
multiple implementations are known to us. What is
more, their focus is not on performance issues, but
on aspects such as implementation (Parkes, 2002) or
the appreciation of the technology by end-users
(Kueng, 1998). The study most related to our
research is that of Oba et al. (2000), who developed
a regression model on the basis of 20 cases to
predict the reduction of lead time as a result of WfM
implementation. Other available data on
performance improvement comes from WfM
vendors, who are perhaps not completely unbiased.
A study among 100 clients of Staffware, one of the
world's largest WfM vendors, indicates for instance
that 62.5% of their clients sees increased efficiency
as a result of WfM implementation (Staffware,
2000). Unfortunately, this outcome is not
accompanied by indications how this figure is
established or how much efficiency gains are
achieved.
This paper is an interim report on a longitudinal,
m
ulti-case study into the effectiveness of WfM
technology (see Yin, 1994). Its aim is to quantify the
contribution of WfM technology to improved
business process performance with respect to lead
time, wait time, service time, and utilization of
resources. In this way, it is an extension of the scope
of the study by Oba et al. (2000).
Our study, which is conducted in the
Neth
erlands, is a joint effort by Eindhoven
359
A. Reijers H. (2004).
PERFORMANCE IMPROVEMENT BY WORKFLOW MANAGEMENT SYSTEMS - Preliminary results from an empirical study.
In Proceedings of the Sixth International Conference on Enterprise Information Systems, pages 359-366
DOI: 10.5220/0002634303590366
Copyright
c
SciTePress

University of Technology and Deloitte & Touche
management consultants. It started in 2001 and is
planned to continue until at least mid 2005. So far, 6
organizations are involved who are in the process of
implementing WfM technology to support 17
different business processes. All organizations are
administrative organizations, both commercial and
not-for-profit, ranging from medium-sized to large.
Although few decisive insights can be reported
yet, we are able to publish our expectations on
performance improvement for each process. These
expectations can be tested when the implementation
have been completed and the WfM-enabled
processes are taken into operation. Moreover, this
study reveals interesting characteristics of
administrative business processes and the way that
workflow implementations are carried out. These
insights may be of interest to those who are active as
researchers or practitioners in the WfM arena.
Finally, we see this paper as an opportunity to
present our chosen research methodology and
generate feedback from the research community.
The structure of this paper is as follows. First we
will outline our research design in Section 2. In
Section 3, we will highlight our experiences on the
execution of the study. In Section 4, we will present
our preliminary results. Section 5 contains our
conclusion and outlook.
2 RESEARCH DESIGN
2.1 Objective
The aim of the effectiveness study is to determine
how the performance of the business processes is
affected by the implementation of workflow
technology. The four performance indicators
selected to investigate for each involved business
process are as follows:
- lead time, i.e. the time between the arrival of
a case and its completion (also known as
cycle time, completion time, and turnaround
time)
- service time, i.e. the time spent by resources
on the processing of a case
- wait time, i.e. the time a case is idle during
its life cycle,
- utilization of involved human resources, i.e.
the ratio of activity versus their availability.
For each of these indicators, we report in this
paper on the average values. We are aware of the
importance of other measures, such as service levels
and the degree of variance. Information on these
values will be included in our final report.
By introducing WfM technology, one may aim to
decrease each of the average values of the given
performance indicators. Because work is routed by
an automated system, work reaches people faster
and will not get lost. This decreases lead time and
wait time. It will allow people to spend less time on
coordination and on the transfer of work, which
means a decrease of service time. When the supply
of work and resources remain constant, work load
and utilization will decrease as a result. Therefore,
the hypothesis for this study is that the averages of
all four performance indicators will decrease
significantly as a result of the use of a WfM system.
2.2 Research steps
To determine the effects on process performance, at
the very least an initial measurement of the relevant
parameters is required (a) before the WfM
implementation and (b) afterwards. Three major
issues have further shaped the design of the
research:
- the validation of the measurements: how can
it be ensured that the collected data on the
process performance is correct?
- the prediction of results: can we try to
estimate the results of the WfM technology
before its actual implementation?
- the comparison of the measurements: how
can a proper comparison between various
situations takes place?
The major steps in the research that address these
issues are given in Figure 1. In this figure, two axis
can be distinguished. On the horizontal axis, we
have the situation before the WfM technology
implementation on the one hand and the situation
afterwards on the other. On the vertical axis, we
distinguish between the real data on the process on
the one hand and the data that follow from a
simulation of that process on the other. In the figure
it is shown that there are six research steps, which
take place in the order 0, 1a, 2a, 3, 2b, and 1b. We
will explain these steps in some detail and explain
how they address the issues we identified. For now,
it is sufficient to say that the a-measurements use the
initial circumstances, while b-measurement are
based on the final circumstances.
The basis of the research design is formed by
gathering real data on the process before and after
the implementation of the WfM systems. We
respectively refer to these measurements as the 0-
measurement and the 3-measurement.
To address the issue of validation (1.), a
computer model is build of each business process
subject to the study, both before and after the WFM
implementation. We refer to the simulation of the
ICEIS 2004 - INFORMATION SYSTEMS ANALYSIS AND SPECIFICATION
360

simulation
using final
circumstances
real data
simulation
using initial
circumstances
after WfM
implementation
before WfM
implementation
1a-measurement
1b-measurement
0-measurement
2a-measurement
2b-measurement
3-measurement
Figure 1: Research steps
model of the initial and final situation as
respectively the 1a-measurement and the 2b-
measurement. Both simulation models are as
realistic as possible, including real data on the actual
structure of the business process, the actual arrival of
cases, the actual availability of resources, and the
actual routing probabilities of cases flowing through
the process, etc. Enactment of the simulation model
delivers results on, for example, the lead times of
the process and the resource occupation. These
simulation results can be compared with the
observations of the actual process. For example, the
average lead time following from the simulation can
be compared with lead time averages observed in
practice. Concordance of the real and simulated data
gives us some support for the validity of the
measurements, either of the initial situation or the
situation after the WfM implementation. Large
differences between these outcomes may indicate
that a part of the process is not understood or
modeled correctly.
To enable prediction (2.), we attempt to build a
simulation model that reflects the situation after the
implementation of the WfM system (the 2a-
measurement). This model is based on the
simulation model of the current process (used for the
1a-measurement) and captures both realistic and
estimated data. On the one hand, it incorporates the
aspects of the initial process that presumably will be
the same after implementation. On the other hand,
typical effects of WfM technology are incorporated
in it. For example, transportation activities that exist
in the current process are eliminated from the model,
because WfM technology will take care of
transportation. Furthermore, planned initiatives of
the organization to e.g. optimize the process
structure or change the resource staffing are also
incorporated in the model for the 2a-measurement.
In this way, its estimate of the future overall effect is
the most realistic. A comparison between the 1a- and
2a-measurement delivers insights in the expected
benefits of the WfM technology.
The issue of comparison (3.) is slightly more
sophisticated. As we are primarily interested in the
effect of the WfM technology, a straightforward
comparison between the initial and final
measurement (the 0- and 3-measurement) is
perilous. After all, various other variables may have
changed during WfM implementation that affect the
final measurement. For example, if WfM technology
is implemented while at the same time a staff
reduction takes place, the performance following
from the 0- and 3-measurement may be similar. It
would not be proper in such a case to decide that
WfM technology has not contributed anything.
Similarly, the supply of work may have changed
drastically.
To counter these effects, we build a new
simulation model, which is used for a so-called 1b-
measurement. It mixes elements from the 1a-model
and the 2b-model. More specifically, it is as close to
the 1a-model as possible, while incorporating all
changes apart from the workflow implementation
that have taken place between the 0- and 3-
measurement. In the previously example of staff
reduction, this would mean that it includes e.g. the
original process structure but a reduced number of
staff compared to the original, initial situation. A
comparison between the 2a and 2b-measurements
will therefore be much more meaningful.
In summary, the 1a- and 2b-measurements serve
as validation for respectively the 0- and 3-
measurement. A comparison between the 1a- and
2a-measurement gives an estimation of the effects of
PERFORMANCE IMPROVEMENT BY WORKFLOW MANAGEMENT SYSTEMS: PRELIMINARY RESULTS
FROM AN EMPIRICAL STUDY
361

WfM technology beforehand, while a comparison
between the 1b- and 2b-measurement is the most
reliable estimation of the actual net effect of WfM
technology.
2.3 Data gathering and analysis
Business processes contain a certain structure and
they show a certain behavior. For this study, the
most important categories of data to be determined
for each business process are as follows:
- process: tasks, milestones, business logic,
routing probabilities
- resource: types of resources, work
assignment policies, number and availability
of resources
- performance: service times, lead times,
arrival rate of new cases, work-in-progress,
resource utilization
For data gathering, the researchers used a multi-
method approach, combining interviews, existing
process descriptions, observations, management
reports, self-registrations by people involved in the
process, and automatically collected data by existing
information systems. For each measurement, a
careful consideration has been made for the most
suitable mix of instruments.
An important difference between the 0- and 3-
measurement with respect to data gathering concerns
the availability of data. Where possible, the use of
existing registrations on the processing of historic
cases were favored over conducting new, manual
registrations for reasons of representativity and ease
of extraction. For the 0-measurement it was
somehow inevitable that new data collection had to
take place, for useful administration of this data
within the organizations was often lacking. For the
3-measurement, the data gathered by the WfM
system itself is an obvious rich and accessible source
of this type of information.
Processes were modeled as Petri nets using the
commercial tool Protos (Pallas Athena, 1997). The
tool allows for efficient communication with end-
users and the organization’s management, thus
simplifying knowledge extraction and validation.
Protos models were automatically translated to
simulation models, which could be executed and
analyzed by the Petri-net based simulation tool
ExSpect (Van Hee et al., 1989). ExSpect provides a
rich environment for simulation and analysis (e.g.
confidence intervals, sensitivity analysis). For more
information on the interplay between these tools, the
reader is referred to a paper by Van der Aalst et al.
(2000).
2.4 Progress
The workflow study started in September 2001 and
is expected to continue until at least mid-2005. So
far, six Dutch organizations have been actively
involved in the study. The characterization of these
organizations are given in Table 1. Note that the
column ‘cases per year’ shows the typical number of
cases processed by the largest process under
consideration for that specific organization. The
respective processes of the involved organizations
typically spanned a dozen up to over hundred
activities. Both fully automated, semi-automated and
purely manual activities were part of almost all of
these processes. In the simplest case, only two
different resource classes were involved in the entire
workflow process, while this ranged to seven or
eight different resource classes for more complex
cases.
An organization could participate in the study
when it had already selected a WfM system, but did
not yet implement it. The actual WfM systems
involved in this study were three commercially
available WfM-systems (Staffware, COSA, and
FLOWer) and one proprietary system (VenWfm).
For all listed organizations, the initial 0-
measurement has now been completed. For two of
these, the final 3-measurement is in process. For two
others, the WfM project has been stopped by the
respective organizations. At the same time, three
new candidate organizations have applied to
participate in the study (not included in the list).
ICEIS 2004 - INFORMATION SYSTEMS ANALYSIS AND SPECIFICATION
362

Table 1: Participants in the workflow study
organization
number
organization
description
number of
employees
turnover/
budget (x
millions €)
focus of
involved
processes in
study
number of
involved
process in
study
cases per
year
(x 1000)
1. governmental
agency
700 60 (b) debt
collection
1 7000
2. health insurer 2300 5200 (t) policy
maintenance
7 250
3. regional
public works
department
1000 250 (b) invoice
processing
1 20
4. local
municipality
300 210 (b) invoice
processing
2 25
5. insurance
intermediary
5000 29000 (t) policy
maintenance
4 2000
6. domiciliary
care agency
1450 50 (t) human
resource
management
2 1,5
3 ISSUES AND EXPERIENCES
3.1 Study
A disappointing event during the study was the
premature break off of two of the participating
organizations. In both cases, considerations on the
organizational level caused the termination of the
workflow projects. This involved a change of
management within one organization and IT budget
problems within the other. No indications were
found that the decisions to stop were related to the
WfM-technology itself. We suppose that the
implementation of WfM technology is as hazardous
as that of other large-scale information systems.
3.2 Simulation
The validation of the processes by means of
simulation has proved to be an effective validation
means, but a more difficult one than estimated.
Simulations did turn out to be helpful in finding
several mismatches and omissions. Yet, four major
modeling issues emerged.
The first issue concerns the problem that human
resources are often dedicated to more than one
business process at a time. The distribution of
attention over these processes is rather dynamically
determined and hard to model, e.g. some people
work on the process that is the busiest and others on
the ones they like most. This issue has also been
identified by Sierhuis (2001).
The second issue involves the modeling of part-
time resources. The problem is different than the
previous one. Even though a broken number of
available FTE's may be known, the simulation is
sensitive to the way this availability is implemented.
For example, 9 half-time people perform differently
than 4 full-time people and 1 half-time person.
Thirdly, the performance of human resources
proved to be rather elastic. We have seen people be
able to process 40 % more cases in busy periods. In
other words, average service times decreased when
the supply of work increased.
The final issue was related to a varying work
load throughout the seasons. For the insurance
intermediary, for instance, the month of December
proved to be a much busier period than any of the
summer months.
All four issues have been met in the simulation
models by extending the logic of the simulation
components, extending the number of observations,
and/or an extended analysis of work practice.
3.3 Data gathering
The activity of data gathering was hampered by the
unavailability of registrations of all kinds of data
within organizations, such as the receipt of triggers
or the completion of milestones. Observations and
registrations by workers themselves were used to
counter this problem. Furthermore, the available
data gathering period preceding the WfM
implementation was often shorter than the usual lead
time of a single case. So, instead of following single
cases flow through the business process to determine
the service time spent on this case, more often for
each task in the process its average service time was
determined by counting a number of executions for
different cases.
PERFORMANCE IMPROVEMENT BY WORKFLOW MANAGEMENT SYSTEMS: PRELIMINARY RESULTS
FROM AN EMPIRICAL STUDY
363

3.4 Process
An interesting side-effect of this study was that it
gave the researchers the opportunity to examine the
characteristics of business processes as executed,
monitored, and designed in practice. We will
highlight these insights here.
For each of the organizations, the distinguished
performance criteria as distinguished in this study
were mentioned as targeted by their own WfM-
implementation. This positively confirmed our ideas
on the importance of these notions. Additional goals
that were mentioned: increased service quality,
increased process flexibility, and a better integration
of stand-alone applications.
One of the striking observations was that out of
the 17 processes considered none of these processes
incorporated concurrent behavior, i.e. parallel
processing of single cases. Business processes
turned out to be completely sequential structures.
Their routing complexity was only determined by
choice constructs and iterations. Even more
remarkable is that for only one of these processes the
process owners indicated that they considered to put
more parallelism in the process once it would be
supported by a WfM-system. This contradicts with
the idea that parallel processing is an obvious next
step in improving the performance when adopting
WfM technology (see e.g. Van der Aalst and Van
Hee, 2003, p.93).
On a related note, the implementation of a WfM-
system did not prove to be a direct incentive to
redesign the structure of the business process
drastically. Without exception, each participating
organization favored in the short term the situation
to have a WfM-system supporting the current
process over a drastically improved version of the
process. This may be counter-intuitive. One of the
strengths of WfM-technology's is that it enables the
restructuring of the process structure. Moreover,
automating a "paper" process may not be the most
effective way to achieve decreased lead and service
times. On the other hand, this approach decreases
the risk of failure by lowering the project's
complexity. So, from a change management
perspective, the selected strategy of the
organizations may be wise.
3.5 Technology
For four out of the six participating organizations,
WfM technology was entirely new at the start of this
study. The two other organizations had experiences
with the implementation of WfM technology in
other business processes.
For all involved processes the implementation of
a document management system accompanied the
introduction of the WfM system. Considering the
tight integration between the two types of systems,
we have established that the outcomes of this study
can only relate to their combined use. In other
words, the digital storage of both structured and
unstructured data is crucial for a WfM system to be
useful in practice.
4 RESULTS
A summary of the most important results is shown in
Table 2. Table 2 gives the 1a- and 2a-measurements
of the lead time and service time, as well as the 1a-
measurement of the utilization. Also shown are the
expected gains from WfM systems for the lead time
and service time, as can be derived from their 1a-
and 2-measurements. Significant changes are
accentuated.
For 15 out of 17 business processes (88%), the
average lead time is expected to decrease
significantly. The gains range from 25% to 83%,
with an average of 48%. For the two other processes,
these results are not significant.
Process 14. is the furthest away from a
significant decrease of lead time. However, this
turns out to result from a redefinition of the ‘case’
concept. In the new situation, the WfM system
makes it possible to loop back a class of problematic
cases to the beginning of the process. Historically,
these cases could only be terminated and then re-
instantiated under a different id, which used to lead
to overly positive lead time outcomes.
With respect to service time, for 13 out of 17
business processes (76%) a significant change is
expected to take place. From these, 12 processes
show an expected decrease of service time between
4% to 47%. However, in the situation of process 5.
an increase of service time is expected to take place
(9%). On average, an expected decrease of service
time of 23% is expected for these 13 processes.
It is interesting to take a closer look at process 5.
It handles the simple mutations of health insurance
policies, such as caused by a change of address. It is
the process with the lowest complexity and the
ICEIS 2004 - INFORMATION SYSTEMS ANALYSIS AND SPECIFICATION
364
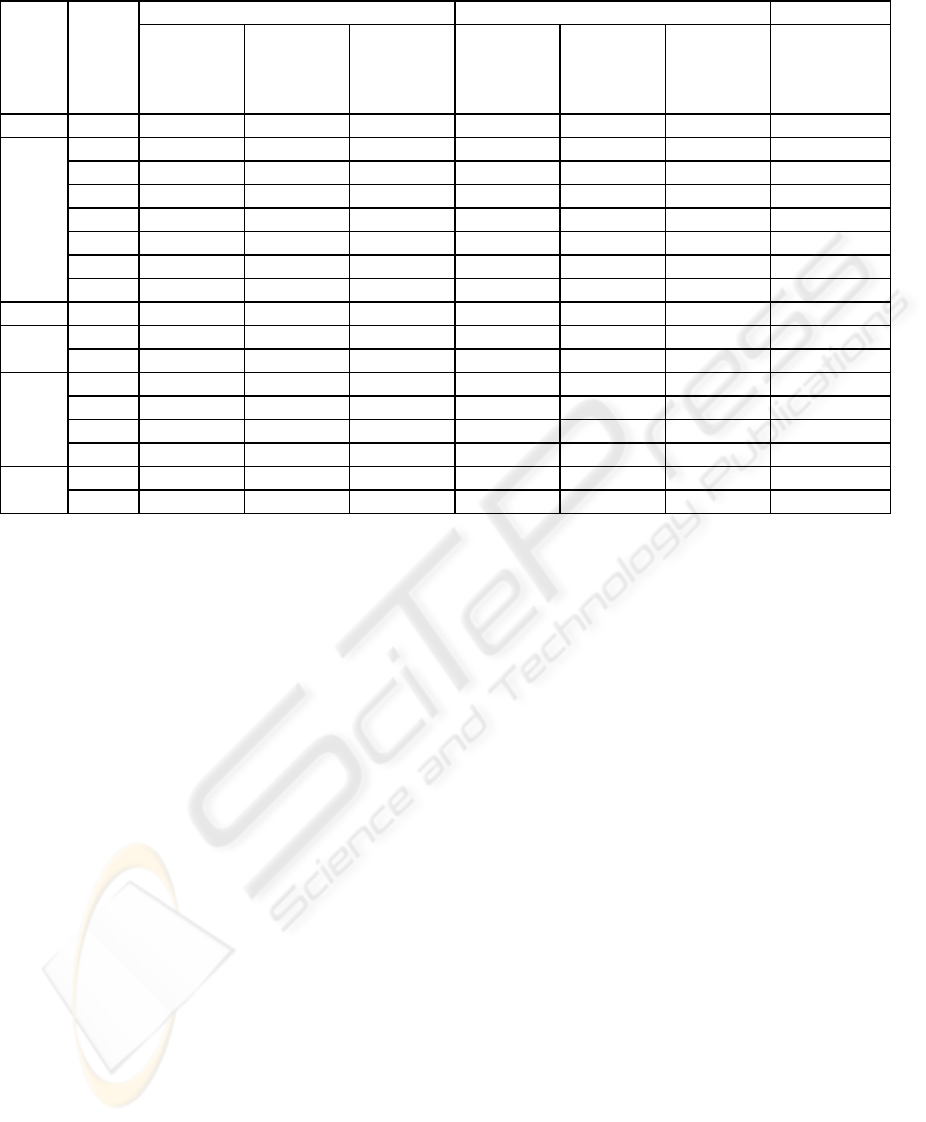
Table 2: Main results study
Lead time Service time Utilization Org.
nr.
(see
Tab.1)
Proc.
nr.
1a-meas.
(average
value in
days)
2a-meas.
(average.
value in
days)
reduction
(%)
1a-meas.
(average
value in
minutes)
2a-meas.
(average
value in
minutes)
reduction
(%)
1a-meas.
(weighted
average %)
1. 1. 59,1 9,8 83
**
13,45 7,14 47
**
73
2. 3,83 2,13 44
**
16,01 9,01 44
**
68
3. 3,35 1,89 44
**
4,16 4,01 4 65
4. 3,40 1,96 42
**
8,54 8,14 5
*
65
5. 3,76 1,72 54
**
3,51 3,84 -9
*
65
6. 4,19 2,31 45
**
9,25 8,90 4
*
73
7. 3,37 2,01 40
**
10,75 8,19 24
**
78
2.
8. 3,01 1,83 39
**
5,4 3,89 28
**
78
3. 9. 16,00 11,93 25
**
17,66 17,39 2 4
10. 6,50 1,81 72
**
42,00 22,11 47
**
3 4.
11. 13,08 6,82 48
**
19,45 13,21 32
**
36
12. 6,17 4,56 26
**
12,13 12,56 -4
60
13. 5,17 2,34 55
**
11,25 11,11 1 67
14. 8,68 9,48 -9 61,55 43,44 29
**
57
5.
15. 5,18 2,36 55
**
12,06 11,03 9
**
96
16. 8,92 5,12 43
**
24,19 20,97 13
**
23 6.
17. 1,49 1,36 9 13,69 10,72 22
**
71
** = significant with two-sided 99% confidence intervals, * = significant with two-sided 90% confidence intervals
lowest initial average service time value (3,51
minutes). Clearly, the overhead caused by the use of
the WfM system – starting the system, registering
work to be completed, etc. – can in this case not be
compensated by less coordination work.
Note that some categories of data are not shown
in the table. In this phase of the study, they can still
be derived from the presented data as follows:
− the 0-measurements: All average values of
the 0-measurement are within the 99%
confidence interval of the values of the 1a-
measurement. In other words, the 1-
measurements accurately reflect the
situation at the 0-measurement.
− the 2a-measurement on the utilization:
Utilization will change accordingly to the
expected change of service time, because an
equal supply of work and workforce is
assumed after each WfM implementation.
− the measurement on the wait time: Because
of the almost complete lack of concurrency,
the wait time in each situation can be
accurately determined by subtracting the
service time from the lead time. The general
relation between these entities is discussed
by e.g. Reijers (2003, p.182).
In other words, the effects on utilization are
equal to the effects on service time and the effects
on wait time are similar to the effects on lead time.
Note that in general these similarities will not hold
when comparing the 0- and future 3-measurements.
5 CONCLUSION AND OUTLOOK
At this stage of the research, we have indications
that WfM systems in general will positively affect
the identified performance indicators averages. In a
large majority of cases we investigated, service time
and utilization are expected to decrease with 23%.
For an even larger majority, lead time and wait time
are expected to decrease with more than twice that
amount, namely 48%. Clearly, it needs to be seen
whether these results will be accomplished in
practice. On the basis of an almost completed 3-
measurement for organization 3., we are hopeful that
the actual gains are indeed in the range of the
predicted gains.
As a side effect, this empirical study has proved
to be a valuable source of information on actual
business process properties and their execution.
Also, simulation proved to be a good way of
validating the initial measurements, but a number of
challenges had to be faced. Unfortunately, we have
seen two organizations putting their WfM
implementations on hold, perhaps definitively. We
are still attracting new organizations to get involved
in the study to generate support for general
conclusions. Finally, it seems that the evaluation of
PERFORMANCE IMPROVEMENT BY WORKFLOW MANAGEMENT SYSTEMS: PRELIMINARY RESULTS
FROM AN EMPIRICAL STUDY
365

the performance of WfM systems cannot be
separated from the contribution of document
management systems.
Currently we are carrying out the first two 3-
measurements. As part of this work, we are
developing a general tool to derive from the event
logs of WfM-systems performance information. We
are studying industry solutions in this field, such as
the ARIS process performance monitor, and XML
data formats.
ACKNOWLEDGEMENTS
The following people from Eindhoven University of
Technology and Deloitte & Touche have greatly
contributed to this study: Wil van der Aalst, Kees
van Hee, Charo Narvaez, René Theunissen and Eric
Verbeek
REFERENCES
Aalst, van der, W.M.P., Crom, de, P.J.N, Goverde,
R.R.H.M.J., Hee, van, K.M, Hofman, W.J., Reijers,
H.A., Toorn, van der, R.A., 2000.
ExSpect 6.4: An Executable Specification Tool for
Hierarchical Colored Petri nets.
In ATPN’00, Application and Theory of Petri Nets
2000, Lecture Notes in Computer Science 1825.
Springer-Verlag.
Aalst, van der, W.M.P, Hee, van, K.M., 2002. Workflow
Management: Models, Methods, and System, MIT
Press. Cambridge.
Dourish, P., 2001. Process descriptions as organizational
accounting devices: the dual use of workflow
technologies. In GROUP'01, ACM Conference on
Supporting Group Work. ACM.
Ellis, C.A., 1979. Information Control Nets: A
Mathematical Model of Office Information Flow. In
SIGMETRICS’97, ACM Conference on Simulation,
Measurement and Modeling of Computer Systems.
ACM.
Goebl, W., Messner, K.J., Swarzer, B., 2001. Experiences
in introducing workflow management in a large
insurance group. In HICSS’01, 34
th
Hawaii
International Conference on System Sciences. IEEE.
Hee, van, K.M. Somers, L.J., Voorhoeve, M., 1989.
Executable Specifications for Distributed Information
Systems. In Proceedings of the IFIP TC 8 / WG 8.1
Working Conference on Information System Concepts:
An In-depth Analysis. Elsevier Science.
Kueng, P., The effects of workflow systems on
organizations: a qualitative study. In Business Process
Management: Models, Techniques, and Empirical
Studies, Lecture Notes on Computer Science 1806.
Springer-Verlag.
Lawrence, P., editor, 1997. Workflow Handbook 1997,
John Wiley and Sons. New York.
Oba, M., Onada, S., Komoda, N., 2000. Evaluating the
quantitative effects of workflow systems based on real
cases. In HICSS’00, 33
rd
Hawaii International
Conference on System Sciences. IEEE.
Pallas Athena. PROTOS User Manual. Pallas Athena BV,
Plasmolen, 1997.
Parkes, A., 2002. Critical Success Factors in Workflow
Implementation. In PACIS’02, 6
th
Pacific Asia
Conference on Information Systems. Jasmin.
Prinz, W., Kolvenbach, S., 1996. Support for Workflows
in a Ministerial Environment. In CSCW’96, ACM
conference on Computer supported cooperative work.
ACM.
Reijers, H.A., 2003. Design and Control of Workflow
Processes: Business Process Management for the
Service Industry, Lecture Notes in Computer Science
2617. Springer-Verlag.
Staffware, 2000. Benefits, Progress and Competitive Edge
– The Customer’s Experience, Staffware. Maidenhead
UK.
Yin, R. K., 1994. Case Study Research, Design and
Methods, Sage Publications. Newbury Park, 2
nd
edition.
WinterGreen, 2003. Business Process Management (BPM)
Market Opportunities, Strategies, and Forecasts, 2003
to 2008, WinterGreen Research. Lexington MA.
ICEIS 2004 - INFORMATION SYSTEMS ANALYSIS AND SPECIFICATION
366
