
WAREHOUSING AND MINING OF HIGHER EDUCATION DATA BY
MEANS OF STATISTICAL PROCESS CONTROL
Liezl van Dyk
University of Pretoria
Department of Industrial and Systems Engineering, University of Pretoria, 0002, South Africa
Pieter Conradie
University of Pretoria
Department of Industrial and Systems Engineering, University of Pretoria, 0002, South Africa
Keywords:
Higher education institution, Data warehousing, Data mining, Statistical process control.
Abstract:
Data warehouses are constructed at higher education institutions (HEI) using data from transactional systems
such as the student information system (SIS), the learning management system (LMS), the learning content
management system (LCMS) as well as certain enterprise resource planning (ERP) modules. The most com-
mon HEI data mining applications are directed towards customer relationship management (CRM) and quality
management. When students are viewed as material in manufacturing process, instead of the customer, dif-
ferent meaningful correlations, patterns and trends can be discovered which otherwise would have remained
unexploited. As example statistical process control (SPC) - as data mining tool - is applied to student result
data. This may eliminate the need to gather student-customer feedback for quality control purposes.
1 INTRODUCTION
More and more higher education institutions (HEIs)
engage in the construction of data warehouses. The
driving forces behind the construction of these ware-
houses are the need to unlock a single point of access,
reduce transactional systems traffic and to enable in-
stitutional research and data mining (Yanow, 1998);
(Murray, 2001).
Data mining and data warehousing are often
used for purposes of quality management (Braha,
1998). Higher education is no exception: qual-
ity management and accreditation data are often or-
ganized through data warehouses (Ingham, 2002);
(Besterfield-Sacre, 1998). This article investigates
current practices in data warehousing and data mining
at HEIs with the focus on quality management. An
exercise in using student results to perform statistical
process control (SPC) is presented to show how exist-
ing transactional data can be used for quality control
purposes.
2 HEI DATA WAREHOUSING
The Higher Education Data Warehouse Configura-
tions Page is being maintained as a voluntary project
under the aegis of the Educase Decision Support Data
Warehouse Constituency Group (Educase, 2001) and
contains information on the data warehouse architec-
ture of 51 HEIs in the USA. This is not an exhaustive
record of HEI data warehouse configurations. How-
ever, it is found to be representative and an appropri-
ate point of reference to investigate data warehousing
at HEIs.
These data warehouse architectures are defined in
terms of - ETL tool (extract - transform - load); -
query tool and file configuration to user; and trans-
actional systems.
2.1 ETL, Quering and Presentation
The most common databases used by HEIs (Educase,
2001) are Oracle and MS SQL server. The minority of
HEIs uses specialised tools to extract, transform and
load (ETL) data. The majority of HEIs either devel-
oped home grown scripts, using generic tools or uses
the ETL facility of the database. Specialised front
end reporting tools (e.g. BrioQuery) are most com-
mon. Generic data analysis tools, such as MS Excel
and MS Access as well as home grown querying tools
are used as well.
The conclusion is made that these data warehous-
ing projects can vary from low technology experimen-
tal warehouse construction to full scale multi million
dollar projects.
110
van Dyk L. and Conradie P. (2004).
WAREHOUSING AND MINING OF HIGHER EDUCATION DATA BY MEANS OF STATISTICAL PROCESS CONTROL.
In Proceedings of the Sixth International Conference on Enterprise Information Systems, pages 110-115
DOI: 10.5220/0002621801100115
Copyright
c
SciTePress

2.2 Transactional systems
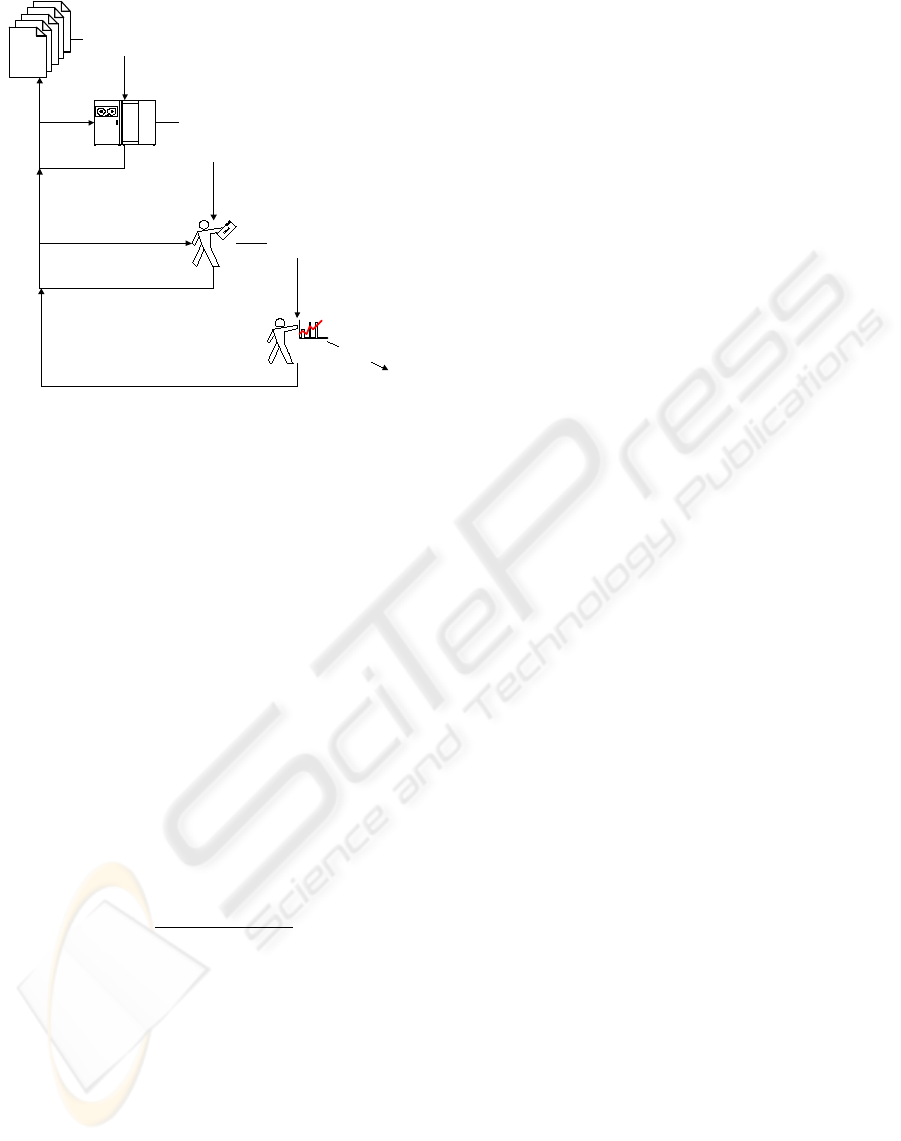
Figure 1 shows transactional systems and interfaces
used at typical HEIs, from which data can be extracted
for the data warehouse.
learning
management
system (LMS)
virtual
classroom
actual
classroom
learning
content
management
system
(LCMS)
enterprise resource planning
(ERP)
human resource
management, financial
management,
accommodation, facilities ect.
student
infor-
mation
system
(SIS)
Figure 1: HEI transactional systems.
Gartner’s e-learning glossary (Lundy, 2002) pro-
vides definitions of most of these transactional sys-
tems:
2.2.1 Learning Management System (LMS)
”A full infrastructure on which e-learning can be built
and delivered. An LMS has six main components:
• Registration capabilities.
• Administration of curriculum and courses.
• Student skills and records management.
• Student interfaces to courseware, including the
ability to launch a course or interact with an LCMS.
• Learning programs administration
• External system application programming inter-
faces, including human resources and, optionally,
enterprise resource planning (ERP) systems.
2.2.2 Learning Content Management System
(LCMS)
”An integrated set of technology that manages all as-
pects of learning content. This includes authoring
or acquisition, content history, auditing, replacement
and deletion.”
2.2.3 Virtual Classroom
”An online ”place” in which a course can be expe-
rienced. An instructor can facilitate, a student can
participate and all participants can collaborate in the
learning event; all these activities may occur syn-
chronously or asynchronously.”
2.2.4 Student Information System (SIS)
The system used to enroll and register students, track
curricula, courses and students is referred to as a stu-
dent management system (SIS). According to Gart-
ner’s e-learning glossary, the functionality of an SIS
”includes transcripts and administrative details of
courses taken, progress towards a degree, or comple-
tion of a curriculum of study, grades or evaluative in-
formation”.
2.2.5 Enterprize Resource Planning (ERP)
Many HEIs do not have a formal ERP system. How-
ever, systems that are part of the ERP collection can
be found at most HEIs. The most prominent transac-
tional systems contributing to the data warehouse of
HEIs (Educase, 2001) are SIS, HRMS and financial
management modules of the ERP system. Other sys-
tems include facilities, inventory and accommodation
management as well as alumni development, research
and library. As far as the SIS is concerned, most ap-
plications included are student demographics, course
management and particulars of prospective students.
Some of these HEIs listed commercial ERP systems
by name.
Interestingly, none of the 51 HEIs (Educase, 2001)
included data from commercial LMSs such as WebCT
and Blackboard, although at least one of these sys-
tems is used by most of these HEIs. If LMS data are
included in the data warehouse, valuable information
can be mined using data such as number and types of
page visited by certain students; time of visits, as well
as e-mail and discussion group participation. Data-
mining possibilities provided by data from the above
transactional systems are investigated in the next sec-
tion.
3 DATA MINING AT HIGHER
EDUCATION INSTITUTIONS
”Data mining is the process of discovering meaning-
ful new correlations, patterns and trends by sifting
through large amounts of data stored in repositories
and by using pattern recognition technologies as well
as statistical and mathematical techniques.” (Lundy,
2002)
The meaningfulness of these new correlations, pat-
terns and trends depends on your paradigm, since
a paradigm is a set of rules and regulations that
defines boundaries and determines behavior (Lums-
daine, 1995). Students at a HEI are most often viewed
as customers (student = customer paradigm). It is
not surprising that within this customer-orientated
WAREHOUSING AND MINING OF HIGHER EDUCATION DATA BY MEANS OF STATISTICAL PROCESS
CONTROL
111

paradigm, almost all HEI applications of data ware-
housing and data mining are related to customer rela-
tionship management (CRM).
However, many publications on HEI quality man-
agement argue that the student should be treated as
material (Willis, 1999) and (Keller, 1992). Within
this student = material paradigm, different meaning-
ful correlations, patterns and trends can be discov-
ered which otherwise would have remained unex-
ploited. Data mining possibilities within each of these
paradigms are subsequently discussed:
3.1 Learner=customer Paradigm
Paradigm specific questions that are addressed by
means of data mining are listed below:
• What is our universities student retention trend?
(Luan, 2001)
• Which alumnus is likely to donate/pledge more?
(Luan, 2001)
• Which enquiries will result in actual applications?
(SPSS, 2003)
• Based on institutional trends, what is our future re-
source needs? (SPSS, 2003)
• What are the enrolment and migration patterns?
(Weber, 2002).
• What are the registration and attendance patterns?
(Kimball, 2002)
(Luan, 2001) specifically used persistence cluster-
ing and prediction as data mining technique.
In most cases where data are used for purposes
of quality management, additional data are added
as gathered from survey responses of learners and
alumni. This is typical of the student = customer
paradigm.
3.2 Learner=material Paradigm
Within the learner = material paradigm, the following
typical questions can be answered by means of data
mining:
• Is the learning process under control?
• What are assignable sources of variation?
• What are the factors contributing to student fail-
ure/success?
• Which school/area produces students with the
highest potential success rate?
• Is there a correlation between the number of hits on
the LMS and the performance of the student?
Assessment is an integral part of the learning pro-
cess. All students (work-in-progress) at an HEI
are continually assessed (in-process inspection) and
graded after each completed module. The rest of the
learning process towards graduation is determined by
these grades. These data can be valuable sources for
process control analysis and quality management.
4 SPC TO MONITOR LEARNING
PROCESS
Some authors debate whether or not statistical tech-
niques should be classified data-mining techniques
(Berson, 1999) and (Lee, 2001). The purpose of this
article is not to contribute to this debate. Statistical
techniques are included in most definitions of data
mining and most publications on data mining tech-
niques (Berson, 1999); (TwoCrows, 1999) and (Za-
iane, 1995). For purposes of this article, statistical
analysis is adopted as data-mining technique. To be
more specific the technique of statistical process con-
trol (SPC) is used for the experiment reported on in
this section. SPC is indeed a statistical technique that
can be used to ”discover meaningful new correlations,
patterns and trends by sifting through large amounts
of data”, which corresponds with Gartner’s definition
of data mining. (Lundy, 2002)
The year-end results of a group of undergraduate
engineering students were used to show how statisti-
cal process control (SPC) techniques can be applied
to monitor the capability of learning processes. The
purpose of this exercise is to show how student results
can be treated in the same way as product inspection
data in order to monitor the (learning) process. For
this exercise the following data and technology were
used:
• Transactional system: Student information system
(SIS)
• Database, ETL tool and query tool: MS Excel
The iterative knowledge discovery process by (Za-
iane, 1995) is used as framework. This process is
shown diagrammatically in Figure 2.
4.1 Data cleaning and data
integration
During these phases, noise and irrelevant data are re-
moved (data cleaning) and multiple data sources are
combined in a single source (data integration). For
this exercise, class lists of all modules taken by a
certain group of engineering students were extracted
from the SIS. These data were integrated to one di-
mensional table with the following grain: semester
mark and exam mark per student per semester.
In cleaning the data, the following were taken into
account:
ICEIS 2004 - ARTIFICIAL INTELLIGENCE AND DECISION SUPPORT SYSTEMS
112
Databases
Data warehouse
Pattern evaluation
Task-relevant data
Data mining
Knowledge
Data integration /
Data cleaning
Data selection
and trans-
formation
Figure 2: Iterative knowledge discovery process.
• There is a high variation in the skills, attitudes and
abilities of input material.
• Parallel learning processes are being performed on
the same product.
The average result per student provides a quantifi-
able approximation of the abilities, skills and attitudes
of each student. Hence, in order to reduce this ”noise”
caused by variation in input material, each result per
student per module is divided by the average result
of other modules taken by the student in a specific
semester. The number of modules (N) used to calcu-
late the average is determined by each student’s in-
dividual module selection. To reduce the assignable
variation in results caused by student skills and atti-
tudes, the following formula is used to calculate the
result index:
I
ij
=
R
ij
(N − 1)
P
n
k=1
R
ik
− R
ij
Iij = Result index per student per module
Rij = Result per student i for course j
N = Number of modules taken by student
The values of the result index are transferred to the
data warehouse.
Examples of other potential sources of assignable
variation that may be identified and reduces through
data mining are listed:
Module combination : Different students are en-
rolled in different combinations of modules. Some
modules may complement each other or the work-
load caused by this module combination can cause
variation in results.
Class attendance : It is expected that there is a cor-
relation between class attendance and academic
performance. If class attendance numbers are
known, the total assignable variation can be elim-
inated even further in order to expose the inherent
learning process variation even more accurately.
Time specific assignable variation e.g. health of
student, the influence of global events on student
motivation. For this experiment, this variation is
eliminated by selecting modules from the same
semester and year.
4.2 Data selection and
transformation
Data relevant to the analysis are retrieved from the
data collection (select) and transformed into forms ap-
propriate for the mining procedure (transformation).
For this experiment, all second-semester modules of
a first-year engineering group were selected and du-
plicate entries were deleted. The fact table was pivot
transformed with MS-Excel.
4.3 Data mining
As part of this phase, data mining techniques are ap-
plied to extract potentially useful patterns. The aim of
this exercise is to investigate if student results can be
treated in the same way as product inspection data in
order to monitor the (learning) process. Hence, sta-
tistical process control (SPC) techniques are applied.
The premise of statistical process control is that a
sample of product measurements indicates the perfor-
mance of the process (Chase, 2004). Various meth-
ods are followed to flag a process concern when the
mean and standard deviations of the sample of mea-
surements do not correlate with the expected mean
and deviation.
The following issues have to be addressed when ap-
plying SPC (Chase, 2004):
• Size of samples
• Number of and frequency of samples
• Control limits
For this exercise, two measurements for each prod-
uct (student) per module were available: Semester
mark and Exam mark.
Hence, the sample size (n) = 2 and the number of
samples = number of students.
The standard deviation (s) of the process distribu-
tion is often the basis for the calculation of the con-
trol limits. In practice, the standard deviation of the
process is not known (Chase, 2004). Hence, other
techniques were developed to determine control lim-
its. The most popular of these is to use the sample
WAREHOUSING AND MINING OF HIGHER EDUCATION DATA BY MEANS OF STATISTICAL PROCESS
CONTROL
113
range. For this exercise the difference between the
semester mark and exam mark was used accordingly
to determine the control limits.
The semester and exam marks are often the means
of samples of other assessment events. If data from
the learning management system (LMS) can be added
to the data warehouse, more information can be gath-
ered on the variation within these samples.
For this exercise the control limits were calculated
as follows:
U CL = x + 1.88R = 1.138
LCL = x − 1.88R = 0.619
where x = final result and R = range between exam
mark and semester mark.
The number of standard deviations = 3 in this case.
Hence, it is can be 99,7 per cent certain that all sam-
ple means must lie between the control limits. If not,
the process is not in control and/ or some assignable
variation still need to be eliminated.
4.4 Pattern evaluation and
knowledge representation
In these steps, strictly interesting patterns represent-
ing knowledge are identified and represented to the
user. For this exercise control charts (Figure 3 and
Figure 4) are used to present the patterns. Conven-
tionally the x-axis of a control chart is a time series.
The x-axes of Figure 3 and 4 represent the series of
students sorted according to average performance.
0.4
0.5
0.6
0.7
0.8
0.9
1
1.1
1.2
1.3
1.4
1.5
1.6
Students (sorted according to average performance)
Final result per student per course /
average of all results for all other courses
Figure 3: X control chart: Variation NOT reduced
The performance per student per module is shown
on the y-axis. Variation caused by student abilities
and attitudes are taken out of the data in Figure 4,
since each result per student per module is divided by
0.4
0.5
0.6
0.7
0.8
0.9
1
1.1
1.2
1.3
1.4
1.5
1.6
Students (according to average performance)
Final result per student per course /
average of all results for all other courses
Figure 4: X control chart: Input material variation reduced
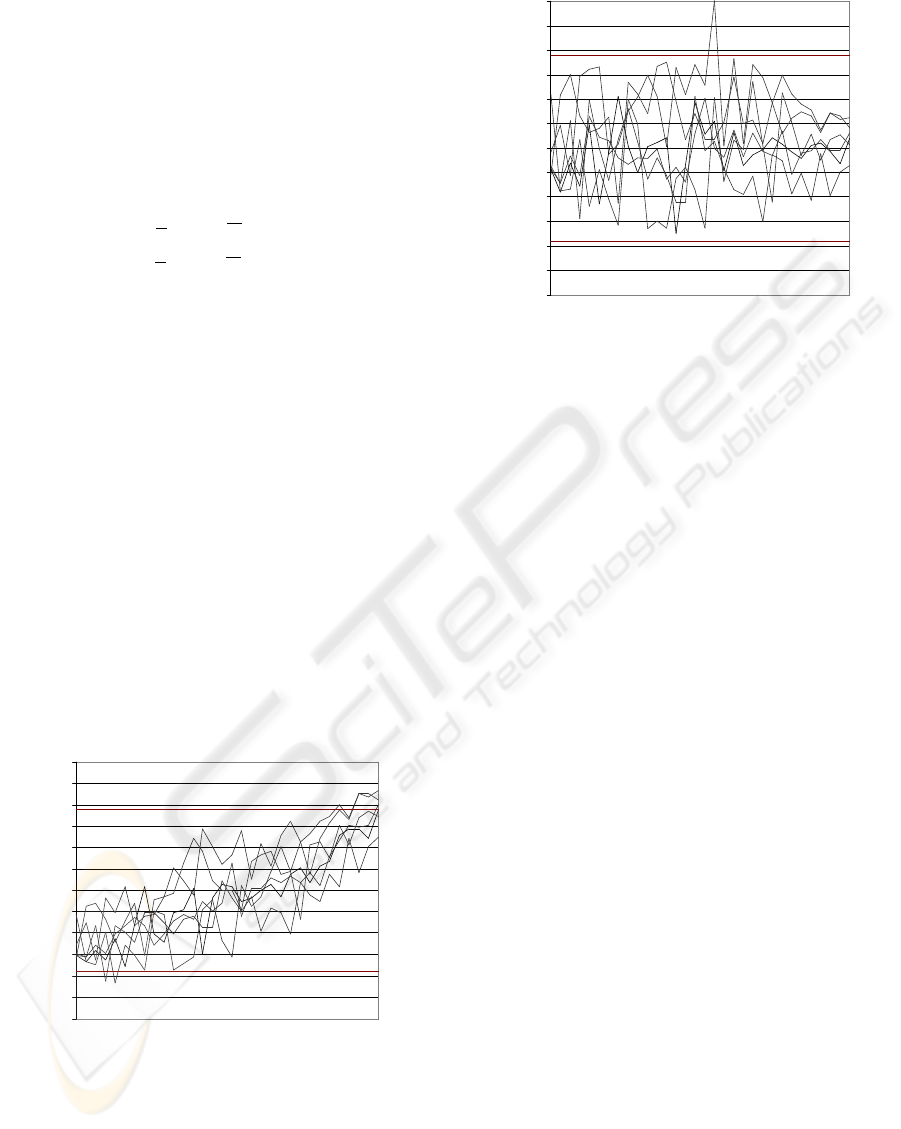
the average result for that student. The trend lines vis-
ible in Figure 3 is attributed the fact the input material
variation is not taken out. Each result is divided by
the average result for all students.
A considerable number of data points are found
outside the control limits, if input material variation is
not reduced (Figure 3). Only one data point is outside
the upper control limit after the results per student per
module are were divided by the average result for all
other modules (Figure 4). If the control limits are re-
visited, using other techniques or more data, some of
the out-of-control data points may fall within the con-
trol limits or more data points may fall outside the
control limits.
The ascending trend shown in Figure 3, disappears
when the input material variation is reduced. Inter-
estingly another trend is found in Figure 4. As the
average result per student increases the variation in
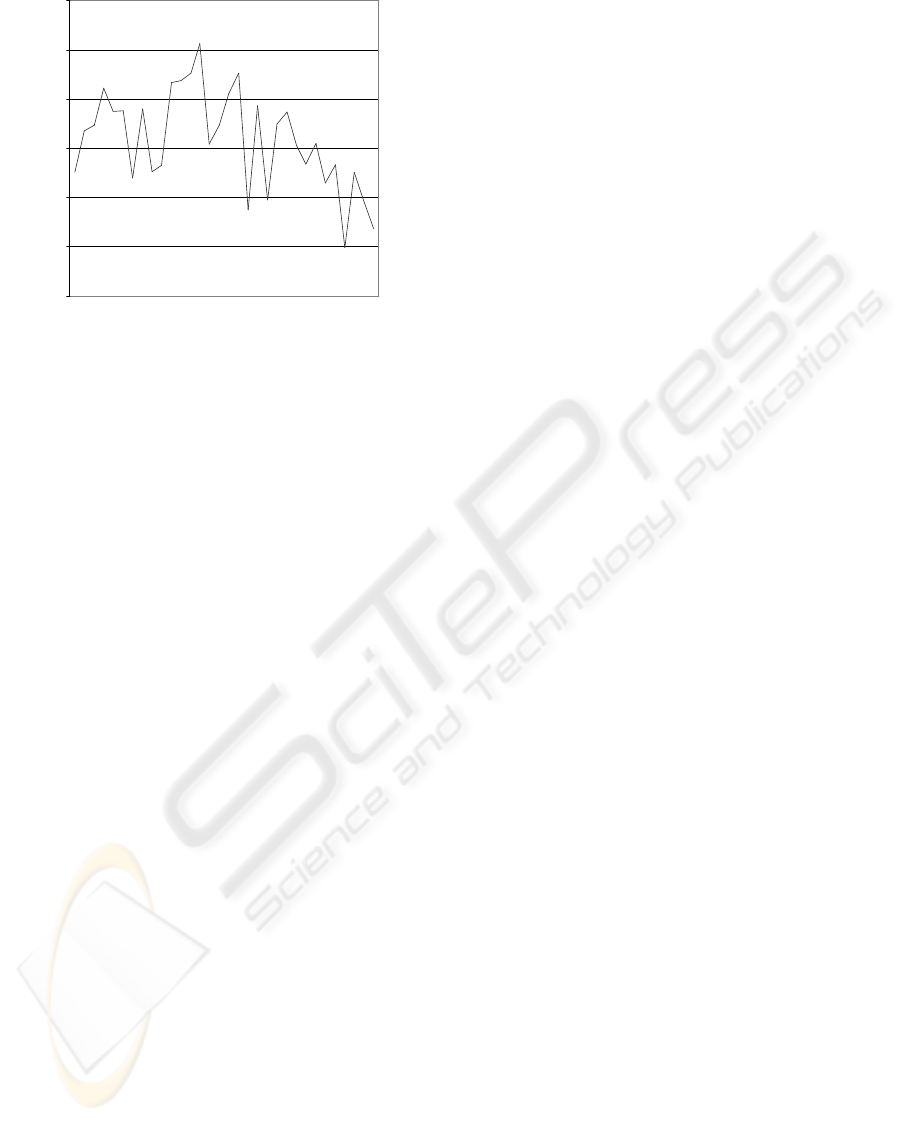
student result per module reduces. This trend can be
seen more clearly in Figure 5, which shows the stan-
dard deviation between results per module for each
student.
If this trend can be confirmed with more data, non-
liniar control limits may be established.
It is shown that when reducing the input material
noise, variation induced through the learning process
can be identified more specifically. The next step
would be to investigate reasons for this specific out
of control instance. However, this investigation does
not fall within the scope this article.
5 CONCLUSION
It is not unusual practice for HEIs to search for mean-
ingful correlations, patterns and trends in data created
ICEIS 2004 - ARTIFICIAL INTELLIGENCE AND DECISION SUPPORT SYSTEMS
114
0
0.05
0.1
0.15
0.2
0.25
0.3
Students sorted according to average results
Standard deviation of module results per student
Figure 5: Standard deviation: results / module / student
by transactional systems. It is argued in this article
that the types of correlation and the trends found, de-
pend on the mindset of the data miner. To support this
argument, it is shown that within the student = ma-
terial paradigm, the learning processes can be mon-
itored by applying established SPC techniques. The
limited scope of this exercise does not allow gener-
alised conclusions, but sets the scene for future re-
search that may include the following:
• Identifying and managing other assignable sources
of variation.
• Identifying and defining control limits for the learn-
ing process, based on more data, given assignable
variation.
• Given data of more learning events (as extracted
from the LMS), identifying common variation in
student performance per student. Applying regres-
sion to find correlation between different courses
Assessment results per student are captured by
transactional systems (LMS and SIS), whether or not
these are used for quality control purposes. If these
data could be used for quality control purposes, time
and effort could be saved in gathering quality data
through surveys and by other means.
REFERENCES
Berson, A. (1999). Building Data Mining Applications
for CRM. McGraw-Hill, Osborne Media, isbn:
0071344446 edition.
Besterfield-Sacre, M. (1998). Implications of statistical pro-
cess: Monitoring for abet 2000 program evaluation:
An example using freshman engineering attitudes. In
American Society for Engineering Education.
Braha, D. (1998). Data Mining for Design and Manufac-
turing: Methods and Applications. Kluwer academic
publishers, International, 1-4020-0034-0 edition.
Chase, R. (2004). Operations Management for Competitive
Advantage. Irwin, Boston, 10th ed edition.
Educase (2001). Higher education data warehouse config-
urations page. In Decision Support/ Data Warehouse
Contituency group. Retrieved August 5, 2003, from
http://www.georgetown.edu/users/allanr/dwconfig/.
Ingham, J. (2002). Data warehousing: A tool for the out-
comes assessment process. In In IEEE Transactions
on Education. IEEE,Vol. 43, no. 2.
Keller, G. (1992). Increasing quality on campus: What
should colleges to about tqm mania? In Change. Vol
24.
Kimball, R. (2002). The data warehouse toolkit. John Wiley
and Sons, International Edition, 0-07-113478-6 edi-
tion.
Lee, S. (2001). A review of data mining techniques. In
Industrial Management and Data Systems. Vol 101,
Issue 1, 0263-5577.
Luan, J. (2001). Data mining as driven by knowledge man-
agement in the higher education - persistance cluster-
ing and prediction. In Proceedings of SPSS Public
Conference. UCSF.
Lumsdaine, E. . M. (1995). Creative Problem Solving.
McGraw-Hill, International Edition, 0-07-113478-6
edition.
Lundy, J. (2002). Gartner’s e-learning glossary. In Research
Note. Gartner research note, M-14-9025.
Murray, C. (1 May 2001). A high level look at pace univer-
sity student information system, pace university. In
submitted to ERP Project Office, Report no. Issue 1.
Pace University.
SPSS (2003). Spss om higher education. In
SPSS. Retrieved August 10, 2003, from
http://www.spss.com/applications.
TwoCrows (1999). Introduction to data mining and knowl-
edge discovery. 3rd edition.
Weber, R. (2002). The use and value of data warehousing
in higher education. In Mountain Plains Journal of
Business and Economics. Vol. 10.
Willis, T. (1999). Total quality management and higher ed-
ucation: the employers’ perspective. In Total Quality
Management. Vol. 10, No. 7.
Yanow, E. (1998). Data warehouse stores mit infor-
mation in a central place. In MIT News Of-
fice, TechTalk. Retrieved September 21, 2003, from
http://web.mit.edu/newsoffice/tt/1998/sep30/
warehous.html.
Zaiane, O. (1995). Resource and knowledge discovery in
global information systems: A scalable multiple lay-
ered database approach. In Proceedings Conference
on Advances in Digital Libraries, Washington DC.
WAREHOUSING AND MINING OF HIGHER EDUCATION DATA BY MEANS OF STATISTICAL PROCESS
CONTROL
115
