
Supervised Classification of Metatranscriptomic Reads Reveals the
Existence of Light-dark Oscillations During Infection of Phytoplankton
by Viruses
Enzo Acerbi
1,∗
, Caroline Chenard
2,∗
, Stephan C. Schuster
1
and Federico M. Lauro
1,2
1
Singapore Centre on Environmental Life Sciences Engineering (SCELSE), Nanyang Technological University,
60 Nanyang Dr, 637551, Singapore
2
Asian School of the Environment, Nanyang Technological University, 50 Nanyang Avenue, 639798, Singapore
∗
These authors contributed equally.
Keywords:
Support Vector Machines, Empirical Mode Decomposition, Marine Microbial Ecology.
Abstract:
In the era of next generation sequencing technologies microbial species identification is typically performed
using sequence similarity and sequence phylogeny based approaches. Particularly challenging is the discri-
mination of closely related sequences such as auxiliary metabolic genes (AMGs) in cyanobacteria and their
viruses (cyanophages). Here we developed a method which combines Support Vector Machine based clas-
sification of AMGs short fragments and Empirical Mode Decomposition of periodic features in time-series.
We applied this method to investigate the transcriptional dynamics of viral infection in the ocean, using data
extracted from a previously published metatranscriptome profile of a naturally occurring oceanic bacterial
assemblage sampled Lagrangially over 3 days. We discovered the existence of light-dark oscillations in the
expression patterns of AMGs in cyanophages which follow the harmonic diel transcription of both oxygenic
photoautotrophic and heterotrophic members of the community. These findings suggest that viral infection
might provide the link between light-dark oscillations of microbial populations in the North Pacific Subtropi-
cal Gyre.
1 INTRODUCTION
Like most of life sciences, marine microbial ecology
has also been revolutionized by the advent of next
generation sequencing (NGS) technologies. Taxo-
nomical identification of DNA/RNA sequences (also
referred to as fragments) is typically performed by
checking for the existence of a similarity by alignment
to the genomes of all the known microbial species in a
brute force kind of fashion. If matches are found, phy-
logenetic analysis may subsequently be conducted to
unravel the evolutionary relationships among the spe-
cies. This similarity based identification approach has
two main limitations: Firstly, the extensive number
of comparison to be performed makes the task com-
putationally expensive, which translate in high costs
and long processing time. Secondly, NGS technolo-
gies can generate sequences of limited length (typi-
cally 250 bp). While this may not represent an issue
with distantly related sequences, it can make the dis-
crimination of closely related sequences (high simila-
rity) difficult. This is the case for auxiliary metabo-
lic genes (AMGs) in cyanobacteria and their associa-
ted viruses (also referred to as cyanophages). AMGs
are encoding key metabolic functions such as photo-
synthesis, carbon metabolism, etc. Upon infection,
viruses take over the control of the bacterial cell and
keep it alive expressing the AMGs that they are car-
rying, for which an high similarity with the bacterial
AMGs is required for a successful infection.
Being able to determine whether an AMG short
fragment (fragments that does not cover the entire
length of the AMG) belongs to a bacterial host or
its associated viruses is an extremely valuable re-
source in microbial ecology. In the past, alterna-
tive methods exploiting specific genetic content have
been used to characterize the origin of a gene (Sand-
berg et al., 2001). Recently, Tzahor et al. (Tzahor
et al., 2009) used a multi-class Support Vector Ma-
chine (SVM) to rapidly classify core-photosystem-
II gene and transcripts fragments coming from ma-
rine samples based on their oligonucleotide frequen-
cies. Here, we applied a SVM-based approach to
classify short fragments of two diffent AMGs, na-
Acerbi, E., Chenard, C., Schuster, S. and Lauro, F.
Supervised Classification of Metatranscriptomic Reads Reveals the Existence of Light-dark Oscillations During Infection of Phytoplankton by Viruses.
DOI: 10.5220/0006763200690077
In Proceedings of the 11th International Joint Conference on Biomedical Engineering Systems and Technologies (BIOSTEC 2018) - Volume 3: BIOINFORMATICS, pages 69-77
ISBN: 978-989-758-280-6
Copyright © 2018 by SCITEPRESS – Science and Technology Publications, Lda. All rights reserved
69

mely psbA and phoH, retrieved from a previously pu-
blished metatranscriptome profiling of multiple natu-
rally occurring oceanic bacterial populations sampled
in situ over 3 days (Ottesen et al., 2014). The short
psbA and phoH fragments (with length ranging bet-
ween 150 and 300bp) were classified based on their
origin (viral vs host) using GC content, mono-, di-,
tri-, tetra-nucleotide frequencies as discriminating fe-
atures.
The outputs were further processed using Empiri-
cal Mode Decomposition (EMD) to identify the un-
derlying frequency dynamics of transcription during
viral infection in environmental cyanobacterial popu-
lations. EMD can deconvolve natural time-series data
into composing frequencies also known as intrinsic
mode functions (IMFs). EMD has been used success-
fully to analyse time series data in other scientific
domains including the detection of periodically ex-
pressed genes in microarray data (Chen et al., 2014),
analysis of seismic data (Han and van der Baan,
2013), electrocardiograms (Chang, 2010) and ano-
maly in sea-surface height (Li et al., 2012). Our data
demonstrated an existence of light-dark oscillation in
the expression pattern of AMGs in cyanophages sug-
gesting that viral infection patterns might provide the
dynamic coupling between light-dark oscillations of
autotropic and heterotrophic microbial populations in
the North Pacific Subtropical Gyre.
2 BIOLOGICAL BACKGROUND
Marine picocyanobacteria from the genera Synecho-
coccus and Prochlorococcus are major primary pro-
ducers in the ocean at low- and mid-latitude and con-
tribute significantly to the global carbon cycle (Hess,
2004; Partensky et al., 1999). Given that light repre-
sents the main source of energy for cyanobacteria, it
also determines the tempo of carbon fixation, metabo-
lic and physiological activity such as the timing of cell
division, amino acid uptake, nitrogen fixation, photo-
synthesis and respiration (Ni and Zeng, 2016; Golden
et al., 1997). For example, nearly half of all Prochlo-
rococcus population in the North Pacific Subtropical
Gyre demonstrated a transcriptional diel cycle (Otte-
sen et al., 2014). Viral infection in the oceans might
also be synchronized with the light cycle. Some stu-
dies suggest a diel cycle in the number of infective vi-
ruses which could mainly be attributed to UV damage
during the peak of sunlight (Wilhelm et al., 1998;
Suttle and Chen, 1992). However, the timing of vi-
ral replication can also be influenced by the presence
and absence of light. For example, a temporal study
at a station in the Indian Ocean revealed a strong in-
crease in viral abundance in the middle of the night
(Clokie et al., 2006a). Logically, the synchronicity
between light and replication is especially important
for viruses infecting cyanobacteria, the cyanophages.
Indeed, it was shown that light influences viral fitness
as light is required for viral infection as it might in-
fluence the degradation of host genomic DNA, viral
transcription or production of new progeny (Thomp-
son et al., 2011).
In addition, cyanophages harbour AMGs which
are usually homologs of host genes involved in pho-
tosynthesis and carbon metabolism pathways. These
AMGs likely play a role in viral infection (Breitbart
et al., 2007). For example, the psbA gene which en-
code D1 protein involved in the photosystem II (PSII)
reaction centre is prevalent in cyanophage genomes.
PSII is particularly sensitive to photodamage cau-
sing a high turnover rate for the D1 protein. It was
shown that viral psbA can highly be transcribed du-
ring infection which suggests that viral-psbA expres-
sion might maintain the photosynthetic activity of the
infected host cells and therefore provide energy for
cyanophage replication (Clokie et al., 2006b; Lin-
dell et al., 2007). This is supported by the notion
that during the lytic cycle of infection of Prochlo-
rococcus MED4 by cyanophage P-SSP7 most of the
psbA transcript in infected cells were from viral origin
after 6hrs (Lindell et al., 2007). Similarly, the phoH
gene which is involved in phosphate metabolism was
previously found in both heterotroph and autotroph
phages (Goldsmith et al., 2011).
Based on sequence phylogeny, viral psbA can
generally be distinguished from Synechococcus and
Prochlorococcus (Sullivan et al., 2006; Chenard and
Suttle, 2008), while phoH genes cluster together ba-
sed on their origin (i.e. autotroph bacteria, hetero-
troph bacteria, cyanophage, heterotroph phage and
eukaryotic viruses (Goldsmith et al., 2011; Goldsmith
et al., 2015)).
3 METHODS
3.1 Support Vector Machines
Support Vector Machines (SVMs) are a supervised le-
arning algorithm in machine learning, first introdu-
ced by Vapnik (Stitson et al., 1996) and based on the
principle of structural risk minimization. Given la-
beled data (in our case, DNA fragment whose origin
is known), a SVM can be trained to individuate the
optimal hyperplane separating (classifying) new ex-
amples.
BIOINFORMATICS 2018 - 9th International Conference on Bioinformatics Models, Methods and Algorithms
70
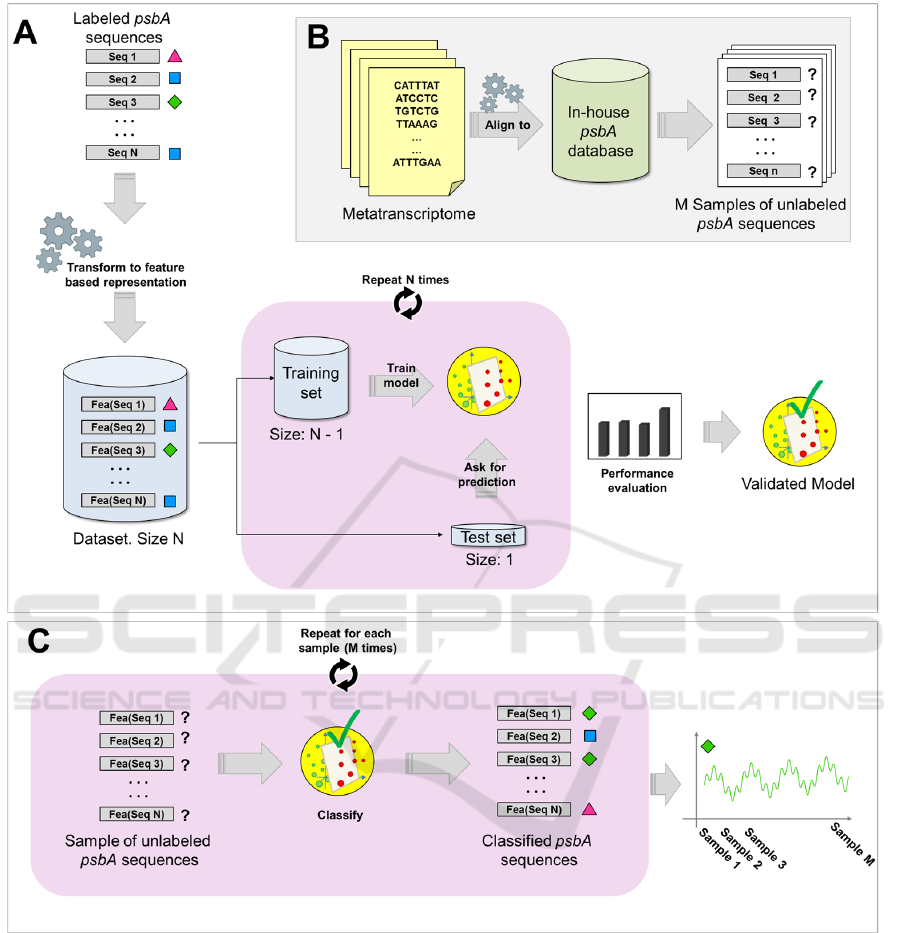
Figure 1: (A) Training and validation of the SVM-based classifier (B) Extraction of psbA fragments from the metatranscrip-
tome. (C) Classification of new sequences using the SVM-based classifier. The same procedure was performed for the phoH
gene.
3.2 Training Set Generation
Labelled DNA sequences for psbA and phoH genes
are scarce in the literature. In order to generate the
psbA training set for the SVM-based multiclassifi-
cator, we collected 203 psbA DNA sequences from
NCBI (including those used by Tzahor S. et al. (Tza-
hor et al., 2009)). Sequences in the dataset were la-
belled as belonging to one of the following five cate-
gories: Synechococcus bacteria (77), Synechococcus
virus (42), Prochlorococcus bacteria high-light (38),
Prochlorococcus bacteria low-light (26) and Prochlo-
rococcus virus (20). Sequences were long, having dif-
ferent lengths ranging from 720bp to 1083bp, with a
median of 1080bp. Analogously, phoH training set
was created by collecting 84 DNA sequences from
NCBI. Sequences in the dataset were labelled as be-
longing to one of the following five categories: Au-
totrophic host (i.e. cyanobacteria) (17), cyanophage
(29), heterotrophic host (13), heterotrophic phage
Supervised Classification of Metatranscriptomic Reads Reveals the Existence of Light-dark Oscillations During Infection of Phytoplankton
by Viruses
71

(14), phytoeukaryotic virus (10). PhoH sequences
were also long, having different lengths ranging from
603bp to 1770bp, with a median of 766.5 bp. In their
work, Tzahor et al. trained the SVM classifier using
full length psbA sequences and subsequently used it
for classification of other full length psbA sequences
(Tzahor et al. also tested their classifier on short psbA
fragments, but only limited to binary classification).
If the aim is to use the classifier on shorter psbA frag-
ments, the approach of Tzahor et al. may not always
give the best results. In fact, classification accuracy
may be low if the training is performed on clean sam-
ples (psbA full genes, rather than fragments) and the
real-world classification is performed on noisy sam-
ples (psbA fragments. i.e. sequences containing a part
of the psbA gene and other base pairs not related to the
psbA gene, as in metagenomic/metatranscriptiomic
data). For this reason, psbA and phoH training sets
were generated by randomly extracting sequences of
length 300bp from the original sets. In addition, to
deal with the original dataset being slightly unbalan-
ced (not equal number of instances for each class) a
combination of undersampling and oversampling was
applied to both psbA and phoH sequences in order to
obtain balanced training sets: 100 sequences for each
of the five classes (total of 500 sequences) for psbA
training set and 50 sequences for each of the five clas-
ses (total of 250 sequences) for phoH training set.
3.3 Feature Generation
GC, mono-, di-, tri-, tetra-nucleotide frequencies were
calculated for each sequence of the training sets (for
a total of 341 features per sequence) and used as in-
put feature vector for the SVM classifiers. When in-
cluding penta- and/or hexa-nucleotide frequencies, no
significant improvements in prediction accuracy were
observed (data not shown).
3.4 The SVM-based Model
Although through the document it will be referred to
as SVM-based classifier, the model is composed by
5 different SVM one-against-all classifiers with linear
kernel, each of them trained to separate one of the
five taxonomical categories (positive class) from all
the remaining ones (collapsed as negative class). As-
sociated with the prediction on whether a given se-
quence belongs or not to the positive class for which
it was trained, each classifier returns a numeric va-
lue representing the probability estimate of the pre-
diction. For each new sequence, the classifier retur-
ning the prediction associated with the highest proba-
bility estimate is the one determining the category of
the sequence.
3.5 Model Training, Parameter
Optimization and Validation
The LIBSVM toolbox (v3.22) (Chang and Lin, 2011)
for MATLAB was used for the experiments. The
SVM-based classifier was trained using the 500 and
250 sequences of the psbA and phoH training sets re-
spectively. In order to assess the ability of the mo-
del to correctly assign each sequence to the respective
taxonomical category, a cross validation of type leave-
one-out was performed. This validating procedure ite-
rates over all of the N sequences of a training set, each
time using N-1 sequences to train the classifier and 1
sequence as a test. Performances were assessed in
terms of precision, recall and f-measure, which for
binary classification are defined as follows:
precision =
true positive
true positive + false positive
(1)
recall =
true positive
true positive + false negative
(2)
F
1
= 2 ·
precision · recall
precision + recall
(3)
In statistics the recall is referred to as sensitivity
and the precision as positive predicted value. For
psbA, cross validation mean precision resulted to be
equal to 0.95, mean recall 0.92 and mean F
1
0.93. In
this phase, the optimal value for the parameter Cost
(cost of misclassification) was empirically established
as being equal to 8, while the optimal probability es-
timate cut-off resulted to be equal to 0.3 (resulting in
3.8% of the sequences being marked as unassigned).
A direct comparison of the SVM-based classifier with
the previous work of Tzahor et al. is not feasible as
in their study, Tzahor et al. performed the multi-class
classification using full length psbA sequences, while
tests with short fragments (100, 200 and 300 bp) were
limited to binary classification only. For phoH, the
mean precision resulted to be equal to 0.98, mean
recall 0.98 and mean F
1
0.98. No optimal probabi-
lity estimate cut-off was applied for phoH sequences
while the parameter cost was set to 8.
3.6 Classification of Sequences
Extracted from the
Metatranscriptiome
In order to extract psbA and phoH fragments from the
metatranscriptome data of Ottesen et al., we firstly
BIOINFORMATICS 2018 - 9th International Conference on Bioinformatics Models, Methods and Algorithms
72
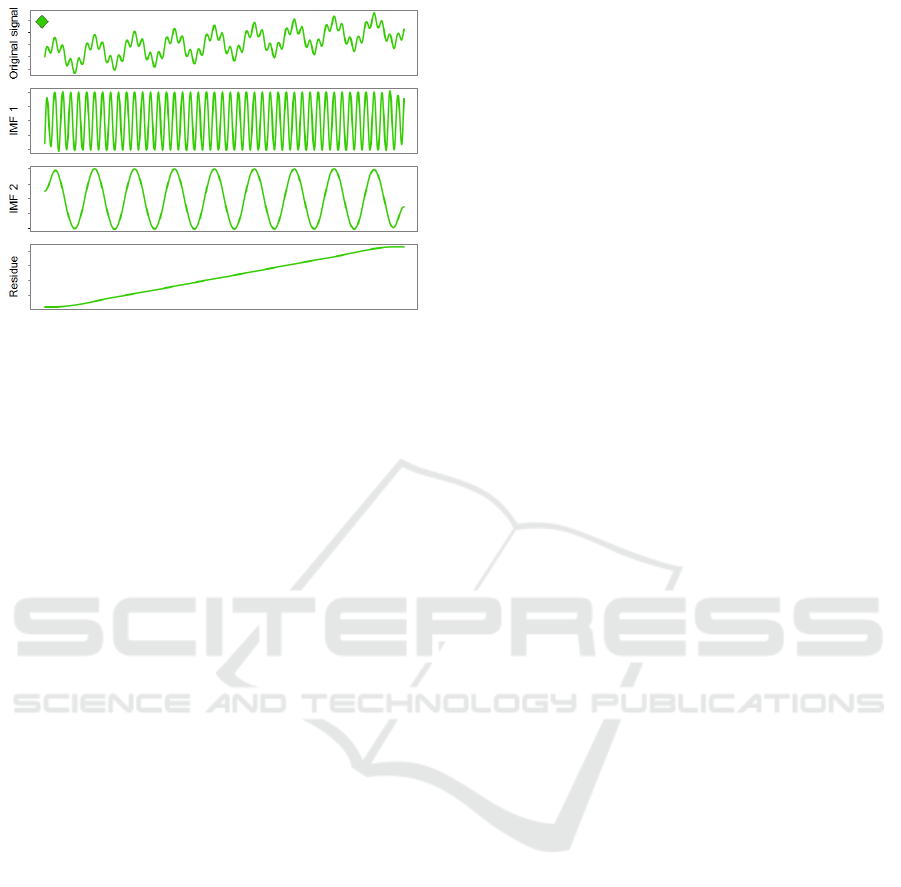
Figure 2: Example of Empirical Mode Decomposition of a
simulated signal. Each IMF represents a different oscilla-
tory component/frequency of the original signal and can be
used to identify the different underlying processes that are
responsible for generating the original signal. Oscillatory
components are extracted in decreasing order of frequency.
built in-house PsbA and PhoH protein databases. The
PsbA database was composed by 11,962 protein se-
quences retrieved from UniProtKB, while the PhoH
database was composed by 100,501 protein sequen-
ces downloaded from NCBI. Subsequently, metat-
ranscriptome data was screened for homology against
these databases using Rapsearch2 (Zhao et al., 2011)
(which allows protein similarity search by transla-
ting DNA/RNA queries into protein), retaining mat-
ches with alignment-length greater than 150 bp and
e-value smaller than 0.000001 Figure 1B). For each
time point, psbA and phoH fragments were then clas-
sified using the SVM-based classifier. Counts were
normalized using the cumulative sum scaling (CSS)
method (Paulson et al., 2013).
3.7 Empirical Mode Decomposition
Empirical mode decomposition (Huang et al., 1998),
is a data-driven method for analysing of non linear
and non stationary time frequency data, such as natu-
ral signals.
The EMD process iteratively decomposes the ori-
ginal signal into a finite number of intrinsic mode
functions (IMF), that is, functions with a single
mode/frequency 2. Each IMF represents a different
component/frequency of the original signal and can
be used to identify the different underlying processes
that are responsible for generating the original signal
(Figure 2). The EMD procedure works as follows:
first, all the time series local minima and maxima are
identified. Interpolation then is applied to connect the
local minima among them, generating the lower en-
velope of the data. The same is performed on the
local maxima, generating the upper envelope. Sub-
sequently, the mean value of the envelope is calcu-
lated and subtracted from the original signal. This
procedure takes the name of sifting and produces an
IMF. To be considered valid, an IMF needs to satisfy
the following conditions: (i) the number of extrema
and of zero-crossings must differ by no more than
one (ii) both lower and upper envelopes must have
a mean equal to zero. The sifting procedure is repe-
ated until no further IMF can be extracted from the
original signal or the specified terminating criterion
is met. IMFs are extracted in decreasing frequencies
levels. EMD is a relatively recent approach that still
holds some drawbacks. For instance, EMD may be
prone to suffer from sampling errors as those could
lead to incorrect placement of extema and therefore
lead to inaccurate IMFs. Similarly, the usage of diffe-
rent interpolation methods can also lead to slight dif-
ferences in the algorithm results, particularly in terms
of flexibly and smoothness of the IMFs (Bagherzadeh
and Sabzehparvar, 2015). IMFs are also challenging
to interpret in absence of knowledge about the under-
lying system, and IMFs of different orders on diffe-
rent time series may not be capturing the same phe-
nomena. In addition, analogous information may end
up being contained in multiple IMFs and there can
sometimes be lower-order IMFs that are just spurious
fluctuations (which have the purpose of correct errors
on other IMFs, so that they can sum up to the original
signal) (Chambers, 2015). In this work EMD was run
using the EMD R package (Kim and Oh, 2009), allo-
wing a maximum number of sift iterations equal to 50,
with a periodic type of boundary and constructing the
envelops by interpolation. No meaningful changes in
the results were observed when different boundaries
and interpolation methods were tested.
4 RESULTS AND DISCUSSION
A total of 20,235 psbA and 5,008 phoH short se-
quences (length ranging from 150 to 300b) extrac-
ted from the high-resolution metatranscriptome time
course (Ottesen et al., 2014) were classified using the
SVM-based classifier. As expected, retrieved psbA
transcripts were most abundant in samples collected
around mid-day and less abundant in samples col-
lected around mid-night. After SVMs-based classifi-
cation, most of the psbA sequences were identified as
Prochlorococcus, including high light and low light
ecotypes (54% and 12% on average respectively and
subsequently merged in one category for downstream
analysis) while only a minor fraction was classified
as Synechococcus psbA (1% on average). The re-
Supervised Classification of Metatranscriptomic Reads Reveals the Existence of Light-dark Oscillations During Infection of Phytoplankton
by Viruses
73
maining sequences were classified as Synechococcus
virus (27% on average) and Prochlorococcus virus
(6% on average). Given that Synechococcus repre-
sents only a small fraction of the bacterioplankton in
the time series of the North Pacific Subtropical Gyre
(Ottesen et al., 2014), we hypothesized that the viral-
psbA clustering into this group were not from Syne-
chococcus viruses but instead from viruses that in-
fect both Prochlorococcus and Synechococcus. In-
deed, some cyanophages have shown to have a broad
host range and infect strain from both genera (Sul-
livan et al., 2003). For example, the psbA found in
the cyanophage P-SSM1, which was isolated using
the Prochlorococcus strain MIT 9313 clustered with
the Synechococcus virus group (Sullivan et al., 2006).
Consequently, the two virus groups were redefined as
Virus Group I (VG1; Synechococcus virus) and Virus
Group II (VG2; Prochlorococcus virus). Prochloro-
coccus and Synechococcus are referred to in the figu-
res respectively as Pro Bac and Syn Bac.
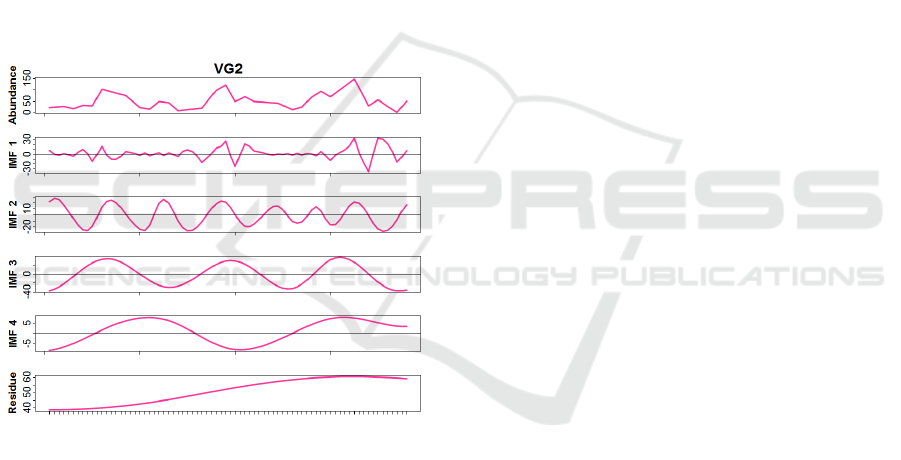
Figure 3: Empirical Mode Decomposition of Virus Group
II (VG2) profile (Prochlorococcus virus).
PhoH sequences retrieved from the metatranscrip-
tome did not show a change in abundance based on
the time of the day (data not shown). The lack of
variation for the phoH gene is probably due to the
fact that light has a limited influence on the phosp-
hate uptake. After SVMs-based classification, most
phoH transcripts were assigned to heterotrophic pha-
ges (HP, 31% on average) and autotrophic bacteria
host (A Host, 31% on average), followed by hete-
rotrophic bacterial host (H Host, 21% on average)
and autotrophic phages (AP, 14% on average). Few
phoH sequences were classified as eukaryotic phy-
toplankton viruses (2% on average) in agreement with
the notion that most of the primary production in the
North Pacific Subtropical was supported by cyano-
bacteria. As a consequence, the phoH group inclu-
ding viruses infecting eukaryotic phytoplankton was
removed from downstream analysis.
After classifying the sequences into their re-
spective subgroups, we performed an empirical
mode decomposition (EMD) (see Methods) on the
transcriptional profiles of the subgroups, from which
different diel patterns emerge within psbA and phoH
transcripts. EMD decomposed each profile of classi-
fied AMGs into simpler harmonic waveforms or in-
trinsic mode functions (IMFs). While the EMD met-
hod lacks a formal procedure to associate a correspon-
ding meaning/phenomena to each IMFs, complicating
their interpretation in situations of total absence of
knowledge about the system, in this case the under-
lying driving forces were not completely unknown.
We identified a plausible biological explanation to
each IMF to support our findings (in Figure 3 the
complete EMD results for VG2 is shown as example).
We hypothesize that the 1
st
order of IMFs captured
most of the stochastic noise in each time series. The
IMFs of the 3
rd
order could clearly identify a diel pat-
tern in the expression of all AMGs (Figure 4), while
the 2
nd
order IMF is able to detect what we believe
are differences in the population heterogeneity among
different groups (Figure 5).
4.1 Diel Pattern Difference between
Synechoccocus and Prochloroccocus
The IMFs of the 3
rd
order identified a diel pat-
tern in the expression of all AMGs (Figure 4).
The peak of expression of psbA from Prochloro-
coccus consistently occurred in the morning while
a less-pronounced cycling of Synechococcus psbA
transcripts occurred later in the afternoon (Figure
4A). This is consistent with a published dataset obtai-
ned using real-time PCR (Mella-Flores et al., 2012).
The remarkable difference between the psbA expres-
sion levels of Synechococcus and Prochlorococcus is
probably caused by the fact that Prochlorococcus is
not able to withstand solar irradiance as high as Sy-
nechococcus. Consequently, as Prochlorococcus D1
protein is more sensitive to light, psbA needs to be
highly expressed during the time of the day with the
more irradiance (Mella-Flores et al., 2012).
Both VG1 and VG2 peaked during the daytime but
the peak for VG2 was precisely matched to the peak
in Prochlorococcus psbA. On the other hand, maxi-
mal expression of VG1 was more variable, possibly
as a result of the variable proportions of the infected
strains of Prochlorococcus and Synechococcus hosts.
While transcripts from psbA-carrying virus had a very
tight coupling to the time of the day, much less diel
BIOINFORMATICS 2018 - 9th International Conference on Bioinformatics Models, Methods and Algorithms
74
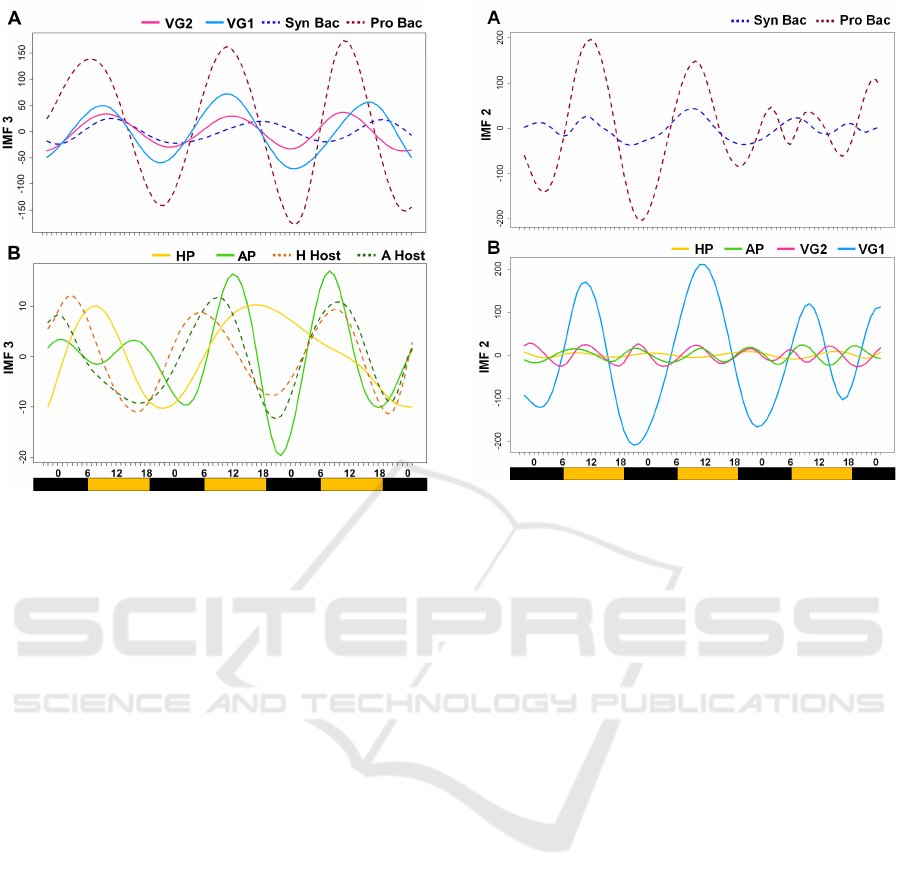
Figure 4: Intrinsic mode functions of 3
rd
order of psbA
and phoH groups. X-Axis shows the time of the day, with
the colored bar indicating the light-dark cycle. (A) psbA
groups. (B) phoH groups.
effect was observed in phoH transcripts (Figure 4B) .
VG1 and VG2 peaked at similar times as their hosts.
On the contrary the HP transcripts consistently pea-
ked later than the hosts homologs and, in general, the
cycling of the phoH transcripts was less strong in tune
with the daily light cycle.
4.2 The Population Structure Shows
Different Viral Groups
Underlying the primary diel harmonics of the 3
rd
or-
der IMF, the 2
nd
order was able to detect differences in
the population heterogeneity among different groups.
This was particularly evident during the final 30 hours
of the time series, when a significant increase in tem-
perature and salinity had been previously associated
to a change in the transcriptional profile of SAR324
(Ottesen et al., 2014). Here, the shift in environmental
conditions is detected as increased frequency in IMF2
for both Prochlorococcus and Synechococcus (Figure
5A), suggesting that the population heterogeneity of
the 2 groups has expanded to include more ecotypes.
Differences in population heterogeneity are also
observed as differences in IMF2 frequencies in VG1,
VG2, AP and HP (Figure 5B). Interestingly the hig-
hest population heterogeneity (i.e. the highest IMF2
frequency) was observed in VG2, which also had the
strongest correlation between AMG peak and the time
Figure 5: Intrinsic mode functions of 2
nd
order of psbA
and phoH groups. X-Axis shows the time of the day, with
the colored bar indicating the light-dark cycle. (A) popula-
tion heterogeneity for Synechoccocus and Prochloroccocus
groups. (B) Differences in population heterogeneity for all
viral groups (both psbA and phoH).
of the day. Taken together, these observations suggest
that VG2 includes many viral quasispecies with very
narrow host ranges and a very precise control replica-
tion timing as a function of the time of the day and
the low stability of the Prochlorococcus-type D1 pro-
tein. VG1 was less diverse but also appeared to have
broader host range and the expression peak shifted in
response to increased host diversity towards the end
of the time-series.
The timing of the peak expression of the viral
psbA also provided insights into the timing of cell ly-
sis. Based on studies conducted in the laboratory, the
viral psbA is transcribed at the end of the lytic cycle
(Clokie et al., 2006b) and if replication of viral DNA
is delayed until light, viral psbA expression should be
minimal in the morning and slowly increase throug-
hout the day.
Therefore, notwhitstanding the differences bet-
ween VG1 and VG2, our findings are consistent with
the hypothesis that most of the cell lysis and viral
shedding occurs in the end of the day. Using SeaF-
low cytometry which gives real-time continuous ob-
servations of cells abundance, Ribalet et al. (Ribalet
et al., 2015) showed that Prochlorococcus cell num-
bers were higher in the day and sharply decrease at
night, suggesting predation (viral and grazing) as the
cause of the oscillation. Our data further support their
Supervised Classification of Metatranscriptomic Reads Reveals the Existence of Light-dark Oscillations During Infection of Phytoplankton
by Viruses
75

hypothesis that viral infection might be a player in the
synchronized oscillations of Prochlorococcus abun-
dance from surface water of a Pacific Gyre (Ribalet
et al., 2015).
5 CONCLUSIONS
Using a combination of SVMs based classification of
short DNA sequences and EMD, we identified the ex-
istence of light-dark oscillations in the viral infection
of cyanobacterial populations in the North Pacific
Subtropical Gyre which can affect Prochlorococcus
cell numbers and activity from surface water. Ottesen
et al. (Ottesen et al., 2014) have observed diel cycling
in the expression of genes from heterotrophic bacteri-
oplankton and suggested that factors other than light
might be linking the diel behaviours of autotrophs and
heterotrophs.
Here we expand on that study to include cycling
of expression of the viral assemblages and, based on
the expression patterns of psbA and phoH, are able to
identify major viral groups that differed in their re-
sponse to light-dark cycles, population structure and
their host range. Undoubtedly many other groups of
cyanophages exist which do not carry those AMGs
and which might or might not display circadian cy-
cling, but a previous study suggests that as much as
88% of cyanophages do indeed carry a copy of the
psbA gene (Sullivan et al., 2006). Because cyanop-
hage ecotypes carrying similar AMGs are likely to
occupy very similar ecological niches, it is conceiva-
ble that the existence of different replication patterns
might allow coexistence of multiple ecotypes by sup-
pressing competitive exclusion. We posit that cyanop-
hages of the VG1-type overcome competititve exclu-
sion with a broad host range and being able to initi-
ate the replication cycle at different times of the day.
On the other hand, the tight coupling between repli-
cation and lower stability of the Prochlorococcus-like
D1 protein requires VG2 to have a much larger gene-
tic diversity and a higher degree of specialization in
host targets.
In addition to the ecological insights that this ap-
proach has provided in understanding cyanophage po-
pulations and their hosts, similar classification and
decomposition analyses may be used to identify fun-
damental frequencies of natural processes from other
time series data that otherwise would be overlooked.
ACKNOWLEDGEMENTS
The authors would like to acknowledge financial sup-
port from Singapores Ministry of Education Acade-
mic Research Fund Tier 3 under the research grant
MOE2013-T3-1-013, Singapores National Research
Foundation under its Marine Science Research and
Development Programme (Award No. MSRDP-P13)
and the Singapore Centre on Environmental Life
Sciences Engineering (SCELSE), whose research is
supported by the National Research Foundation Sin-
gapore, Ministry of Education, Nanyang Technolo-
gical University and National University of Singa-
pore, under its Research Centre of Excellence Pro-
gram. The authors would like to thank Fabio Stella,
Rohan Williams and James Houghton for their valua-
ble feedbacks.
REFERENCES
Bagherzadeh, S. A. and Sabzehparvar, M. (2015). A local
and online sifting process for the empirical mode de-
composition and its application in aircraft damage de-
tection. Mechanical Systems and Signal Processing,
54:68–83.
Breitbart, M., Thompson, L. R., Suttle, C. A., and Sulli-
van, M. (2007). Exploring the vast diversity of marine
viruses. Oceanography, 20(SPL. ISS. 2):135–139.
Chambers, D. P. (2015). Evaluation of empirical mode de-
composition for quantifying multi-decadal variations
and acceleration in sea level records. Nonlinear Pro-
cesses in Geophysics, 22(2):157–166.
Chang, C.-C. and Lin, C.-J. (2011). LIBSVM: A library
for support vector machines. ACM Transactions on
Intelligent Systems and Technology, 2:27:1–27:27.
Chang, K.-M. (2010). Ensemble empirical mode
decomposition for high frequency ecg noise re-
duction. Biomedizinische Technik/Biomedical Engi-
neering, 55(4):193–201.
Chen, C.-R., Shu, W.-Y., Chang, C.-W., and Hsu, I. C.
(2014). Identification of under-detected periodicity in
time-series microarray data by using empirical mode
decomposition. PloS one, 9(11):e111719.
Chenard, C. and Suttle, C. A. (2008). Phylogenetic diversity
of sequences of cyanophage photosynthetic gene psba
in marine and freshwaters. Applied and environmental
microbiology, 74(17):5317–5324.
Clokie, M. R., Millard, A. D., Mehta, J. Y., and Mann, N. H.
(2006a). Virus isolation studies suggest short-term va-
riations in abundance in natural cyanophage populati-
ons of the indian ocean. Journal of the Marine Biolo-
gical Association of the United Kingdom, 86(03):499–
505.
Clokie, M. R., Shan, J., Bailey, S., Jia, Y., Krisch, H. M.,
West, S., and Mann, N. H. (2006b). Transcription
of a photosynthetict4-type phage during infection of
a marine cyanobacterium. Environmental Microbio-
logy, 8(5):827–835.
BIOINFORMATICS 2018 - 9th International Conference on Bioinformatics Models, Methods and Algorithms
76

Golden, S. S., Ishiura, M., Johnson, C. H., and Kondo, T.
(1997). Cyanobacterial circadian rhythms. Annual
review of plant biology, 48(1):327–354.
Goldsmith, D. B., Crosti, G., Dwivedi, B., McDaniel, L. D.,
Varsani, A., Suttle, C. A., Weinbauer, M. G., Sandaa,
R.-A., and Breitbart, M. (2011). Development of phoh
as a novel signature gene for assessing marine phage
diversity. Applied and environmental microbiology,
77(21):7730–7739.
Goldsmith, D. B., Parsons, R. J., Beyene, D., Salamon, P.,
and Breitbart, M. (2015). Deep sequencing of the viral
phoh gene reveals temporal variation, depth-specific
composition, and persistent dominance of the same vi-
ral phoh genes in the sargasso sea. PeerJ, 3:e997.
Han, J. and van der Baan, M. (2013). Empirical mode de-
composition for seismic time-frequency analysis. Ge-
ophysics, 78(2):O9–O19.
Hess, W. R. (2004). Genome analysis of marine photosynt-
hetic microbes and their global role. Current opinion
in biotechnology, 15(3):191–198.
Huang, N. E., Shen, Z., Long, S. R., Wu, M. C., Shih, H. H.,
Zheng, Q., Yen, N.-C., Tung, C. C., and Liu, H. H.
(1998). The empirical mode decomposition and the
hilbert spectrum for nonlinear and non-stationary time
series analysis. In Proceedings of the Royal Society of
London A: Mathematical, Physical and Engineering
Sciences, volume 454, pages 903–995. The Royal So-
ciety.
Kim, D. and Oh, H.-S. (2009). Emd: a package for empiri-
cal mode decomposition and hilbert spectrum. The R
Journal, 1(1):40–46.
Li, F., Jo, Y.-H., Liu, W. T., and Yan, X.-H. (2012). A dipole
pattern of the sea surface height anomaly in the north
atlantic: 1990s–2000s. Geophysical Research Letters,
39(15).
Lindell, D., Jaffe, J. D., Coleman, M. L., Futschik, M. E.,
Axmann, I. M., Rector, T., Kettler, G., Sullivan, M. B.,
Steen, R., Hess, W. R., et al. (2007). Genome-wide
expression dynamics of a marine virus and host reveal
features of co-evolution. Nature, 449(7158):83–86.
Mella-Flores, D., Six, C., Ratin, M., Partensky, F., Boutte,
C., Le Corguill
´
e, G., Marie, D., Blot, N., Gourvil, P.,
Kolowrat, C., et al. (2012). Prochlorococcus and sy-
nechococcus have evolved different adaptive mecha-
nisms to cope with light and uv stress.
Ni, T. and Zeng, Q. (2016). Diel infection of cyanobacteria
by cyanophages. Frontiers in Marine Science, 2:123.
Ottesen, E. A., Young, C. R., Gifford, S. M., Eppley, J. M.,
Marin, R., Schuster, S. C., Scholin, C. A., and De-
Long, E. F. (2014). Multispecies diel transcriptional
oscillations in open ocean heterotrophic bacterial as-
semblages. Science, 345(6193):207–212.
Partensky, F., Hess, W. R., and Vaulot, D. (1999). Prochlo-
rococcus, a marine photosynthetic prokaryote of glo-
bal significance. Microbiology and molecular biology
reviews, 63(1):106–127.
Paulson, J. N., Stine, O. C., Bravo, H. C., and Pop, M.
(2013). Differential abundance analysis for microbial
marker-gene surveys. Nature methods, 10(12):1200–
1202.
Ribalet, F., Swalwell, J., Clayton, S., Jim
´
enez, V., Sudek,
S., Lin, Y., Johnson, Z. I., Worden, A. Z., and Arm-
brust, E. V. (2015). Light-driven synchrony of pro-
chlorococcus growth and mortality in the subtropical
pacific gyre. Proceedings of the National Academy of
Sciences, 112(26):8008–8012.
Sandberg, R., Winberg, G., Br
¨
anden, C.-I., Kaske,
A., Ernberg, I., and C
¨
oster, J. (2001). Captu-
ring whole-genome characteristics in short sequences
using a naive bayesian classifier. Genome research,
11(8):1404–1409.
Stitson, M., Weston, J., Gammerman, A., Vovk, V., and
Vapnik, V. (1996). Theory of support vector machi-
nes. Technical Report, CSD-TR-96–17, Computatio-
nal Intelligence Group, University of London.
Sullivan, M. B., Lindell, D., Lee, J. A., Thompson, L. R.,
Bielawski, J. P., and Chisholm, S. W. (2006). Preva-
lence and evolution of core photosystem ii genes in
marine cyanobacterial viruses and their hosts. PLoS
Biol, 4(8):e234.
Sullivan, M. B., Waterbury, J. B., and Chisholm, S. W.
(2003). Cyanophages infecting the oceanic cyano-
bacterium prochlorococcus. Nature, 424(6952):1047–
1051.
Suttle, C. A. and Chen, F. (1992). Mechanisms and rates
of decay of marine viruses in seawater. Applied and
Environmental Microbiology, 58(11):3721–3729.
Thompson, L. R., Zeng, Q., Kelly, L., Huang, K. H., Sin-
ger, A. U., Stubbe, J., and Chisholm, S. W. (2011).
Phage auxiliary metabolic genes and the redirection of
cyanobacterial host carbon metabolism. Proceedings
of the National Academy of Sciences, 108(39):E757–
E764.
Tzahor, S., Man-Aharonovich, D., Kirkup, B. C., Yogev, T.,
Berman-Frank, I., Polz, M. F., B
´
ej
`
a, O., and Mandel-
Gutfreund, Y. (2009). A supervised learning appro-
ach for taxonomic classification of core-photosystem-
ii genes and transcripts in the marine environment.
BMC genomics, 10(1):229.
Wilhelm, S. W., Weinbauer, M. G., Suttle, C. A., and Jef-
frey, W. H. (1998). The role of sunlight in the removal
and repair of viruses in the sea. Limnology and Ocea-
nography, 43(4):586–592.
Zhao, Y., Tang, H., and Ye, Y. (2011). Rapsearch2: a fast
and memory-efficient protein similarity search tool
for next-generation sequencing data. Bioinformatics,
28(1):125–126.
Supervised Classification of Metatranscriptomic Reads Reveals the Existence of Light-dark Oscillations During Infection of Phytoplankton
by Viruses
77
