
Improvement of Bias and Rising Threshold Algorithm based on Local
Information Sharing
Nhuhai Phung, Masao Kubo and Hiroshi Sato
Department of Computer Science, National Defense Academy, Yokosuka, Kanagawa, Japan
Keywords:
Agreement Algorithm, Local Information Sharing, Trial and Error.
Abstract:
This paper improves BRT algorithm based on Local Information Sharing (BRT-Lis) to apply to the practical
problems which locations related environments. We consider how to adjust the local parameters so that agreed
behavior could be obtained optimally. We also examine how the Local Information Sharing influences the
agreement with a simple position changing model.
1 INTRODUCTION
In a swarm, macro candidate behaviors are created by
micro interactions among individuals, and the behav-
ior of individuals is influenced by their macro behav-
ior. The relationship between the micro interactions
and the macro states is usually nonlinear. Thus, it is
not easy to analytically obtain micro behaviors that
lead to an appropriate macro state. Therefore, the
principle and method leading to a bottom-up mech-
anism by the highly organized behavior found in so-
cial organisms is still attracting the attention of re-
searchers. Therefore, the principle and method lead-
ing to a bottom-up mechanism by the highly orga-
nized behavior found in social organisms is still at-
tracting the attention of researchers. Research on
foraging behavior by ant and bee colonies has been
undertaken for a long time, and excellent models
have been proposed to assign individuals to feeding
and resting roles. Tofts et al. (1992) introduced
foraging-for -work (FFW) model in which individu-
als seek work and engage in task performance when
they encounter a stimulus. Page et al. (1991) de-
veloped a model of task allocation in bees based on
the threshold principle, where individuals are repre-
sented as boolean automata embedded within a net-
work. However, they did not try to relate quantita-
tively their results to any specific experimental ob-
servation. Gordon et al. (1992) developed a model
based on a connectionist model, which can be seen as
a more complex and a more experiment-driven ver-
sion of Page et al.’s boolean network. Bonabeau et
al. (1998) introduced a simple mathematical model
of the regulation of division of labor in social insects
based on a fixed response thresholds. They showed
that this simple model explains the experimental ob-
servation of Wilson (1984), it was possible to ex-
tend the model to a more complicated situation, ex-
plore its characteristics, and studied under conditions
that could explain temporary multifaceted phenom-
ena. Castello analyzed the simulation results using
the adaptive respond threshold model (ARTM), and
conducted experiments with real robots. And, in this
study, SARTM, a simplified version of ARTM, was
proposed in order to improve the adaptation and emer-
gent capabilities of robotic swarms in which the re-
sponse threshold is calculated dynamically.
On the other hand, there are cases where it is
not possible to adjust the division of labor, so it is
not possible to lead a swarm to attain the targeted
macroscopic state. Thus, general models about how
a swarm discovers, memorizes, and learns new mi-
cro interactions to enable the attainment of the de-
sired macro state have not been proposed. This results
in a bottleneck in the construction of swarm systems
(Kubo et. el’s reseach (2015)).
In previous work (Phungnhu et al., 2017), we have
developed an agreement algorithm using a trial and
error method at the macro level (BRT model, Bias and
Rising Threshold model) based on the hypothesis that
the opinion of a swarm is always made by agreements
between the individuals while the agreement content
changes on an hourly basis. In the conventional di-
vision of labor models, for example, fixed response
thresholds model Bonabeau et al.’s research (1998),
the swarm’s tasks are fixed. They considered only one
or some limited purposes of the swarm. In contrast,
in the BRT algorithm, the swarm can create various
Phung, N., Kubo, M. and Sato, H.
Improvement of Bias and Rising Threshold Algorithm based on Local Information Sharing.
DOI: 10.5220/0006751603390344
In Proceedings of the 10th International Conference on Agents and Artificial Intelligence (ICAART 2018) - Volume 1, pages 339-344
ISBN: 978-989-758-275-2
Copyright © 2018 by SCITEPRESS – Science and Technology Publications, Lda. All rights reserved
339
responses against environmental changes and the like
by switching its behaviors until discovering an suit-
able agreement behavior.
The BRT model is a model that expands the 2-
choice consensus-building model proposed by Na-
matame bias model (Namatame, 2001) that can be
used even in cases where more than two choices are
available. In the BRT model, an agent determines its
attitude by its own preference, in which the thresh-
old is rising with time, and by looking at the ratio of
the population. However, this ratio is the ratio of the
number of agents who are choosing the same behav-
ior to the total number. In other words, as shown in
Figure 1 (A), the information sharing must be global.
However, in reality, the global information sharing is
impossible. Moreover, even if the information on the
whole swarm can not be obtained, macro behaviors
will be able created by local interaction among neigh-
bors (Figure 1 (B)).
Thus, in this paper, we point out improving the
original BRT algorithm in order to make it more real-
istic and practical based on Local Information Shar-
ing. By using a simple position changing model, we
also find out that the suitable macro behavior can be
discovered more quickly than in the original BRT al-
gorithm when the number of agents is very small.
This paper is organized as follows. Section 2 de-
scribes the original BRT algorithm, Section 3 intro-
duces BRT-Lis, and then Section 4 shows the exper-
imental results and discussions. Conclusions and fu-
ture work are described in Section 5.
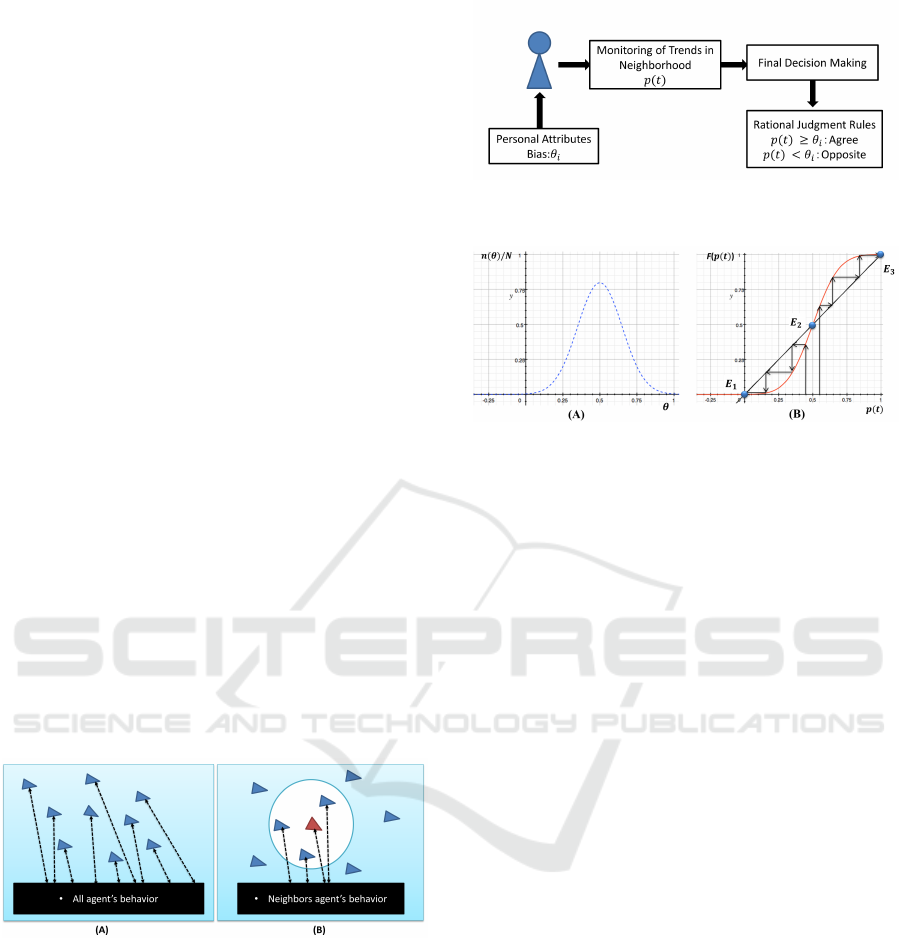
Figure 1: The image of (A) global information sharing in
BRT and (B) local information sharing in BRT-Lis.
2 ORIGINAL BRT MODEL
The BRT model is a model that expanded from Na-
matame model. First of all, we will introduce this
model.
2.1 Namatame Bias Model
Namatame got inspiration from the research in crit-
ical mass of Thomas Crombie Schelling. As shown
Figure 2: The role of social skin in individual decision-
making (Namatame, 2001).
Figure 3: Bias design method. (A) Probability density func-
tion. (B) Cumulative distribution function and equilibrium
point of collective consensus decision (E1 and E3 are stable
points, E2 is an unstable point).
in Figure 2, he concluded that individual decision-
making does not only depend on personal philosophy
and personal preferences (bias θ
i
), but it also depends
on the atmosphere of the whole group p(t). He pro-
posed a decision-making framework based on the in-
troduction of individual differences (bias value). An
agent determines its attitude by its own preference and
by looking at the ratio of the population in favor and
opposite to it. As shown in Eq.(1), the agents disagree
if the proportion of the consensus faction is less than
the threshold and agrees if it exceeds the threshold.
p(t) ≥ θ
i
: Agree
p(t) < θ
i
: Opposite
(1)
Namatame investigated various distributions and
clarifed that we distribute the bias value θ
i
in a bell
shape as shown on the left side of Figure 3, one unsta-
ble point and two stable points are generated, and all
members smoothly move their opinions to ultimately
agree or disagree, as shown on the right side of Figure
3. The number of iterations required to attain conver-
gence depends on the bell shape of the distribution
and not on the number of agents, so it is expected that
prompt convergence can be achieved even with a large
number of agents.
2.2 The BRT Model
Namatame bias model can only deal with two options
that agree or disagree with an opinion. In the BRT
model, we have proposed an algorithm that enables
HAMT 2018 - Special Session on Human-centric Applications of Multi-agent Technologies
340

agreement to be achieved promptly even when there
are multiple opinions (M ≥ 2).
Now, we assumed that there are N
agents P
1
,··· ,P
i
,··· ,P
N
(1 ≤ i ≤ N). A =
{a
1
,··· ,a
j
,··· ,a
M
} is the set of agent candi-
date behavior with M ≥ 2 (1 ≤ j ≤ M). A
i
(t) ∈ A
is the behavior of agent P
i
at time t. The agent P
i
has a bias θ
i
(0 < θ
i
< 1). n(a
j
) is the number of
agents selecting behavior a
j
. a
goal
is the desirable
candidate behavior (a
goal
∈ A). The agent does not
know a
goal
, in advance, only when all have agreed,
and it is understood that a
goal
is an agreed behavior.
At this time, the agent P
i
decides on behavior
A
i
(t +1) at the time t as follows: If
n(A
i
(t))/N ≥ θ
i
+ τ ·c ·(t −t
i,last
(t))
(2)
is satisfied, A
i
(t + 1) = A
i
(t). Otherwise, a behavior
other than A
i
(t) is stochastically chosen and becomes
A
i
(t + 1) ∈A\A
i
(t). Here, τ is a constant representing
the increment in the number of proponents.
In addition, t
i,last
(t) is the time at which the agent
P
i
last changed its behavior, and ((t −t
i,last
(t))) is the
time over which the same action continues to be se-
lected.
t
i,last
(t +1) =
t +1 A
i
(t +1) 6= A
i
(t)
t
i,last
(t) otherwise
(3)
c(t) is a function that is equal to 1 when the desir-
able macro purpose is not achieved as follows:
c =
0 ∀i,A
i
(t) = a
goal
1 otherwise
(4)
If the ratio of agents who select the same behavior
as theirs is lower than θ
i
+τ·c·(t −t
i,last
(t)), the agent
randomly selects a new behavior from other candidate
behaviors.
3 BRT-LIS
3.1 Proposed Method: BRT-Lis
In BRT model, an agent knows all the behaviors of
other agents. Therefore, it can know the number
of agents who choose the same behavior (n(A
i
(t))).
Here, we assume that the agent gets only the informa-
tion of neighbors that is within a fixed radius r. We
call NB
i
(t) is the set of neighbors of agent P
i
at time
step t. N
i
(t) is size of this set (the number of neigh-
bors).
Here, we also assume that there are
N agents P
1
,··· ,P
i
,··· ,P
N
(1 ≤ i ≤ N).
A = {a
1
,··· ,a
j
,··· ,a
M
} is the set of agent can-
didate behavior with M ≥ 2 (1 ≤ j ≤ M). A
i
(t) ∈ A
is the behavior of agent P
i
at time t. The agent P
i
has a bias θ
i
( 0 < θ
i
< 1). n
i
(a
j
) is the number of
neighbors selecting behavior a
j
. a
goal
is the desirable
candidate behavior (a
goal
∈ A). The agent does not
know a
goal
, in advance, only when all have agreed,
and it is understood that a
goal
is an agreed behavior.
At this time, the agent P
i
decides on behavior
A
i
(t +1) at the time t as follows: If
n
i
(A
i
(t))/N
i
(t) ≥ θ
i
+ τ ·c ·(t −t
i,last
(t))
(5)
is satisfied, A
i
(t + 1) = A
i
(t). Otherwise, a behavior
other than A
i
(t) is stochastically chosen and becomes
A
i
(t +1) ∈A\A
i
(t). Here, τ, c(t) and t
i,last
(t) are same
to BRT model.
In NB
i
(t), if the ratio of agents who select the
same behavior as theirs is lower than θ
i
+ τ ·c ·(t −
t
i,last
(t)), the agent randomly selects a new behavior
from other candidate behaviors.
3.2 Generation of the Bias Value θ
i
Here, we also use Gaussian distribution to generate
the bias value θ
i
.
The Gaussian distribution method:
θ
i
= min(1,max(0,G(µ,σ
2
g
)))
(6)
Where: G(µ,σ
2
g
) is a random variable with a Gaussian
distribution, µ is the expected distribution, σ
2
g
is the
variance.
G(µ,σ
2
g
) =
1
√
2Πσ
2
g
exp(−
(x−µ)
2
)
2σ
2
g
)
(7)
4 THE EXPERIMENTAL
RESULTS
4.1 Experimental Setup
In this section, we present the details of the environ-
ment that are important for completely understanding
our experimental setup. In this work, we use a simple
position changing model. Picture of domain is shown
in Figure 4. Black dot represents the agent P
i
and the
dotted circle represents the neighborhood of P
i
at the
center of the circle, light black dot represents a neigh-
bor of P
i
, blue dot represents an agent who is not the
neighbor of P
i
. Red arrows represent 4 behaviors of
agent (M = 4), behavior a
1
is Turn Left (move to the
left side of the domain), behavior a
2
is Go Up, behav-
ior a
3
is Turn Right, behavior a
4
is Go Down.
The experimental settings for variables are given
in Table 1. We chose the variables that yielded the
best results in our previous research on BRT model
Improvement of Bias and Rising Threshold Algorithm based on Local Information Sharing
341
[8]. The domain is toroidal. This means that agents
that move off one edge of our domain reappear on the
opposite edge moving in the same behavior.
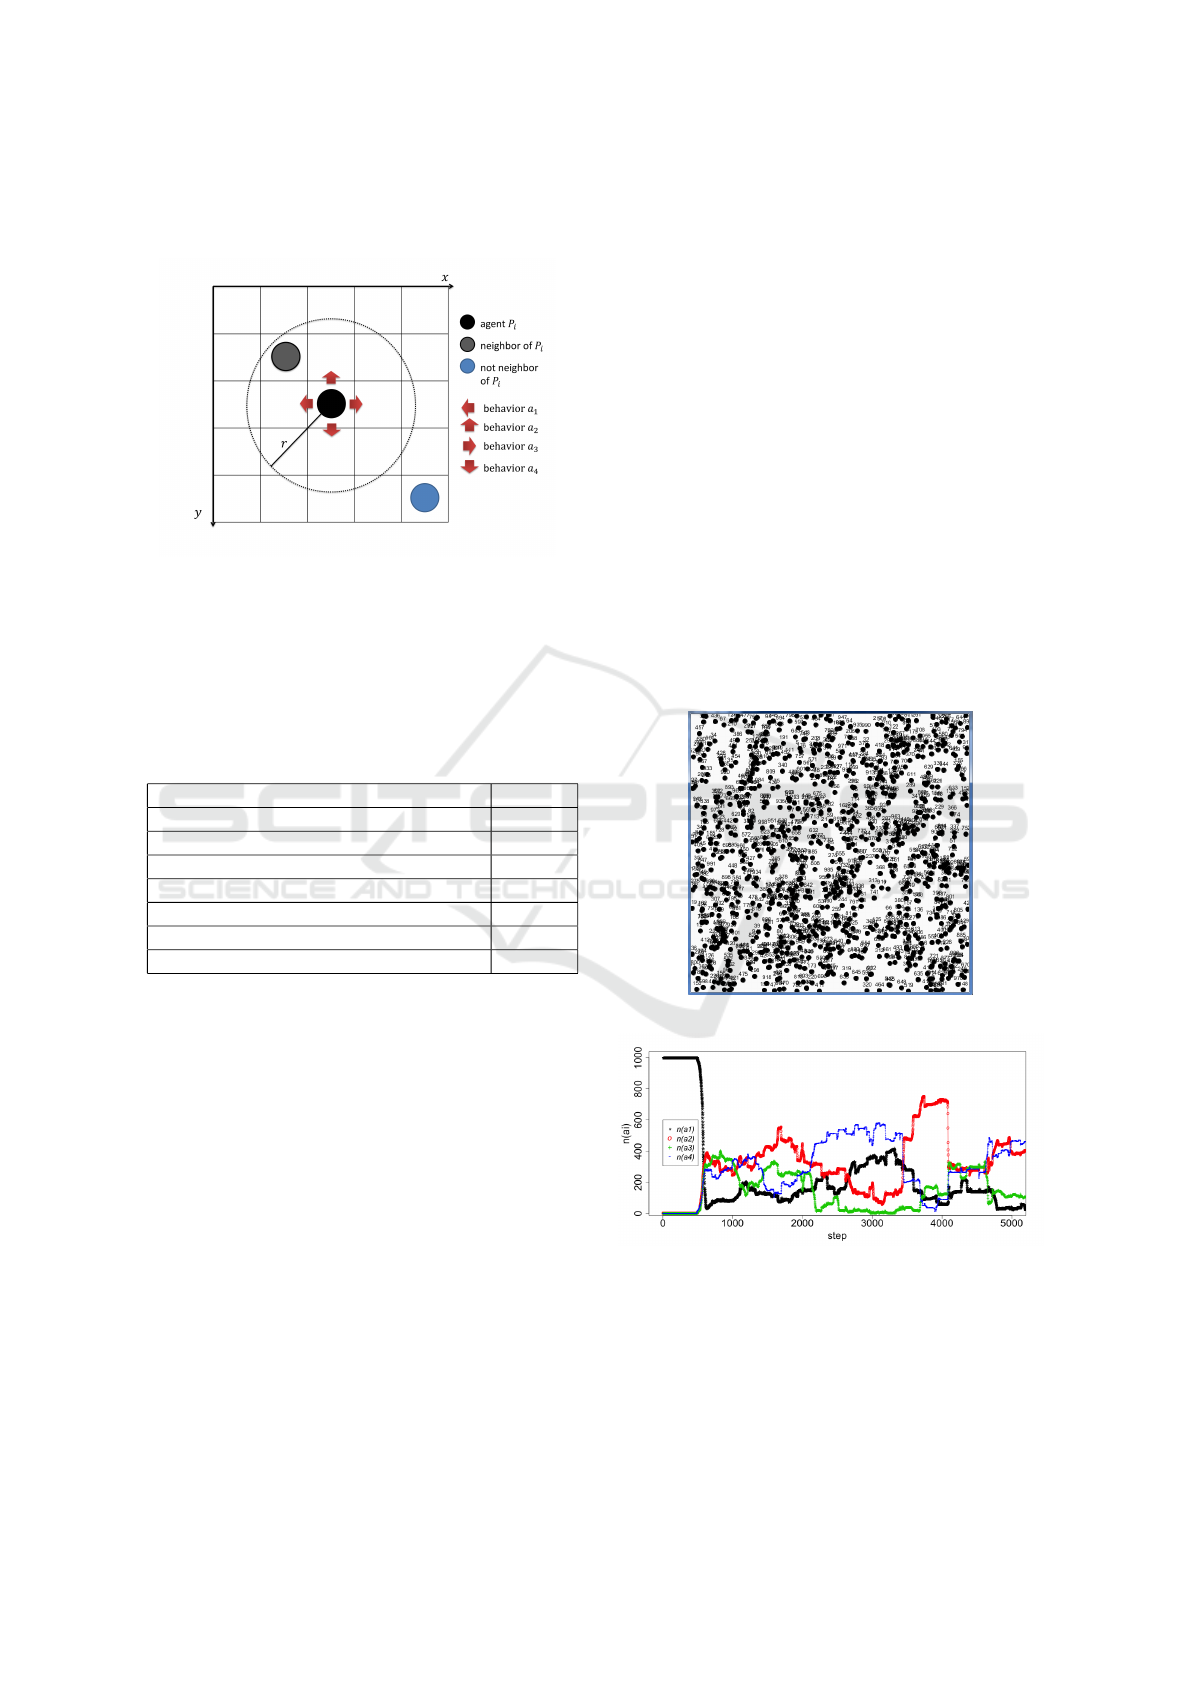
Figure 4: Image of the simple position changing model. The
black dot represents the agent P
i
and the dotted circle rep-
resents the neighborhood of P
i
at the center of the circle,
the light black dot represents a neighbor of P
i
, the blue dot
represents an agent who is not the neighbor of P
i
. The red
arrows represent 4 behaviors of agent (M = 4), behavior a
1
is Turn Left (move to the left side of the domain), behavior
a
2
is Go Up, behavior a
3
is Turn Right, behavior a
4
is Go
Down.
Table 1: Experimental setting for variables.
Variable Value
domain height 600
domain width 600
units moved by each agent per time step 1
the number of candidates behavior M 4
the expected distribution µ 1/M
the variance of Gaussian distribution σg 1/(3M)
the increment value τ 0.001
4.2 Confirmation of Behavior
In the following, we describe computer experiments
that were used to show how the agreement state can
be switched as a function of the BRT-Lis. In order
to observe the behavior-switching more clearly, we
assume that there is no desirable behavior (a
goal
) in
the set of agent candicate behavior A.
For this experiment, the number of agents was set
at N = 1000. We show the candidate behaviors se-
lection over time where all members started from an
agreed behavior at the initial time when the radius r is
r = 20, 50, 100, 200.
Figure 5 shows an example of agents, which are
randomly located in the domain, at the initial time.
Figures 6 ∼ 9 show a transition example of each case
of radius values. The horizontal axis represents time
step and the vertical axis represents n(a
i
),i = 1, 2, 3, 4,
which is the number of agents who choose behavior
a
i
. As can be seen in Figure 6, agreement by all indi-
viduals has never been emerged with too small radius
r (r = 20). In Figure 7, we see that the number of
agents who choose behavior a
4
increases rapidly in
first 1200 time steps and reachs 1000 instantaneously
several times. Thus, it can not be said that the agree-
ment behavior has be emerged. However, as can be
seen in Figure 7, when the radius r is set in high value
(r = 100), the number of agents choosing the same be-
havior is beginning to be maintained at a certain and
high value. This means that although the agreement
is unstable, it has been emerged. When the radius r
is set in very high value (r = 200), which means the
agent can share the information with about one-third
of all individuals (πr
2
/(wid th ∗height)), all individu-
als choose the same behavior for nearly constant time.
We found that all individuals switched behavior by
agreeing with a behavior.
Thess results show that the higher radius value we
set, the more clearly the agreement can be seen. In
the next subsection, we will examine the influence of
the radius r in more details.
Figure 5: An example of agents at the initial time.
Figure 6: Swiching behavior when r = 20.
4.3 Searching Ability of the Desired
Behavior and Its Features
In this subsection, we show that it is possible to dis-
cover the desired behavior using computer simula-
tions.
HAMT 2018 - Special Session on Human-centric Applications of Multi-agent Technologies
342
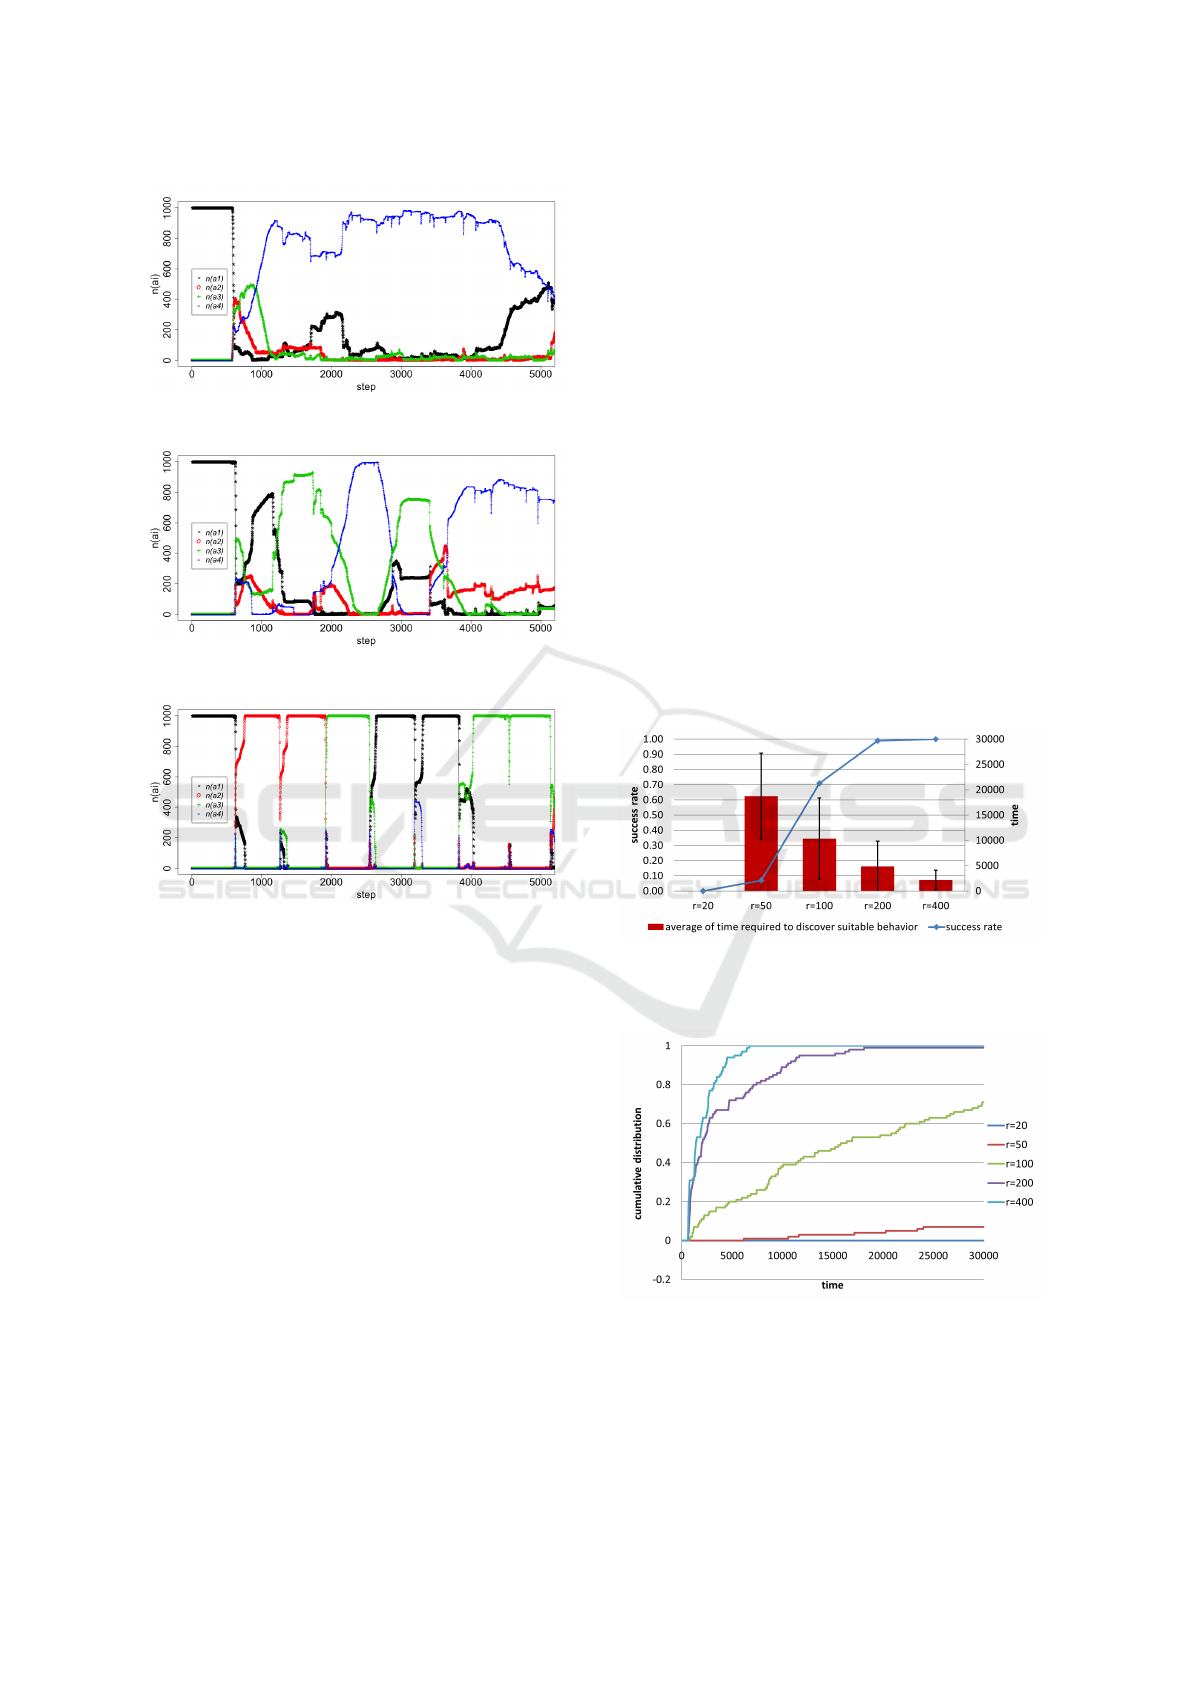
Figure 7: Swiching behavior when r = 50.
Figure 8: Swiching behavior when r = 100.
Figure 9: Swiching behavior when r = 200.
4.3.1 Influence of the Radius r
We conduct the experiment with the number of agents
N = 100. Assuming that all the agents selects
an agreed behavior at the initial time, we verified
whether it is possible to reach the desired behavior
by changing the radius r. We selected behavior a
4
and set it as the desired behavior (a
goal
= a
4
). Then,
we changed the radius r and counted the cases where
all of the agents were able to select a
4
, conducted
100 trials on each parameter set, and determined the
probability of discovery and average of time required
to reach the desired behavior from an agreed state.
We set time limit is 30000, and if this time limit was
reached the trial was stopped. These experimental re-
sults are shown in Figure 10 and 11.
Figure 10 shows the changing of the success ra-
tio and average of time required to reach the desired
behavior from an agreed state in the initial time. The
vertical axis on the left is the ratio at which behav-
ior a
4
was successfully agreed (blue line), the verti-
cal axis on the right is average of time required to do
that (red bar), and the horizontal axis is value of the
radius r. As we can see, the success ratio increased
with a decrease in r and when r was set to r = 200,
the success ratio was close to 100%. This means that
BRT-Lis model could achieve the same result as BRT
model, which is equivalent to BRT-Lis model with
r = 400. On the other hand, we can see that the higher
radius value we set, the more rapidly the desired be-
havior be discovered with a proportion.
Figure 11 shows the cumulative distribution of ra-
tios that reached the desired behavior from an agreed
state in initial time. As a result, it is found that when
the radius r was too small, the desired behavior could
not be discover any time. When the radius r is set
to the bigger value (about 50 ∼ 100), the number
of cases discovering the desired behavior increases.
When the radius r is set to even bigger value (around
200), the desired behavior is reached promptly in all
cases.
From the above, it can be concluded that BRT-Lis
model could discover the desired behavior in the same
as of BRT model with an suitable radius r.
Figure 10: The changing of the success ratio and the aver-
age of time required to discover the desired behavior from
an agreed state in the initial time. r = 20,50, 100,200.
Figure 11: The cumulative distribution of ratios that
reached the desired behavior from an agreed state in initial
time.
Improvement of Bias and Rising Threshold Algorithm based on Local Information Sharing
343
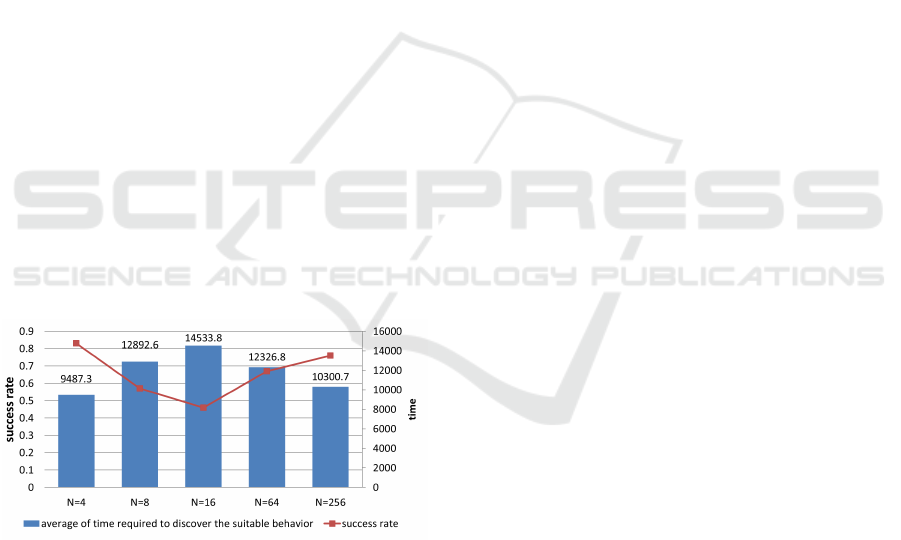
4.3.2 Influence of the Number of Agents N
Here, we make clear how the number of agents in-
fluence the searching ability of the desired behavior.
We set r = 100, a
goal
= a
4
. Assuming that all the
agents selects an agreed behavior at the initial time.
We changed the radius r and counted the cases where
all of the agents were able to select a
4
. Figure 12
shows the results of performing 100 trials for a num-
ber of agents N = 4,8,16,64,256. A trial is termi-
nated at time step 30000.
The vertical axis on the left is the ratio at which
behavior a
4
was successfully agreed (red line), the
vertical axis on the right is average of time required
to do that (blue bar), and the horizontal axis shows
the number of agents N. As can be seen, when the
number of agents is set a very small value (about 4
∼ 16), the success ratio surprisingly decreased with
an increase in N. It is considered that the number of
agents is too small, and there is almost no neighbor.
Therefore, each agent makes decisions without being
affected by other agents. At this time, the probability
of selecting the desired behavior a
4
by all individu-
als could be 1/(3N). Thus, the smaller the number of
agents N is, the higher success ratio could be. How-
erver, when the number of agents is set a bigger value,
the density of agents in the domain increases and the
number of neighbors of each agents increases too.
Therefore, the probability that individual information
is indirectly conveyed to everyone increases. As can
be seen, the success ratio increases when N ≥ 16.
Figure 12: The changing of the success ratio and the aver-
age of time required to reach the desired behavior from an
agreed state in the initial time. N = 4,8, 16,64,256.
5 CONCLUSIONS
In this paper, we introduced the improved BRT al-
gorithm based on Local Information Sharing (BRT-
Lis) and considered how to adjust the local parameters
so that the desired behavior could be obtained opti-
mally. We conducted the experiments that confirm the
behavior switching function of BRT-Lis with a sim-
ple position changing model. We also examined how
the Local Information Sharing influences the search-
ing ability of the desired behavior. The experimen-
tal result revealed that the following implications: (1)
BRT-Lis model can discover the desired behavior in
the same as of BRT model with an suitable radius r
and (2) the extremely low density or high density of
agents in the domain is the condition of high success
ratio of searching the desired behavior.
REFERENCES
Tofts, C. and N. R. Franks, “Doing the right thing: ants,
honeybees and naked molerats”, Trends Ecol, Vol. 7,
pp. 346–349, 1992.
Page, R. E. and S. D. Mitchell, “The genetics of division of
labour in honey beecolonies”, Adv. Ins. Physiol, Vol.
23, pp. 117–169, 1991.
Gordon, D. M., B. C. Goodwin and L. E. H. Trainor,
“A parallel distributed model of the behaviour of ant
colonies”, J. Theor. Biol, Vol. 156, pp. 293–307, 1992.
Eric Bonabeau, Guy Theraulaz and Jean-Louis
Deneubourg, “Fixed Response Thresholds and
the Regulation of Division of Labor in Insect Soci-
eties”, Bulletin of Mathematical Biology, Vol. 60, pp.
753–807, 1998.
E. Castello, T. Yamamoto, F.D. Libera, W. Liu, F. Alan,
T.Wineld, Y.Nakamura, H.Ishiguro, “Adaptive Forag-
ing for Simulated and Real Robotic Swarms: The dy-
namical response threshold approach”, Swarm Intelli-
gence DOI, Vol. 10, pp. 1–31, 2016.
Akira Namatame (In Japanese), “Strategic Decision Mak-
ing”, Asakura Publisher, pp. 119–149, 2001.
Masao Kubo, Nhu Hai Phung, Hiroshi Sato, Akira Na-
matame, “Direction switch behavior to enclose a pack
of targets based on phase transition”, Swarm2015,
2015.
Nhu Hai Phung, Masao Kubo, Hiroshi Sato, Saori Iwanaga,
Akira Namatame, “Agreement algorithm with trial
and error method at macro level”, Swarm2017, 2017.
Wilson, E. O., “The relation between caste ratios and
division of labour in the ant genus Pheidole (Hy-
menoptera: Formicidae)”, Behav. Ecol. Sociobiol,
1984.
HAMT 2018 - Special Session on Human-centric Applications of Multi-agent Technologies
344
