
HealthyClassroom
A Proof-of-Concept Study for Discovering Students’ Daily Moods and Classroom
Emotions to Enhance a Learning-teaching Process using Heterogeneous Sensors
Minh-Son Dao
1, 2
, Duc-Tien Dang-Nguyen
3
, Asem Kasem
1
and Hung Tran-The
4
1
Universiti Teknologi Brunei, Brunei
2
University of Information Technology, Vietnam
3
Dublin City University, Ireland
4
National Institute of Information and Communications Technology, Japan
Keywords:
Moods, Emotions, Personal Lifestyle, Physiological Data, Wearable Sensors, Teaching and Learning Process,
Data Visualization.
Abstract:
This paper introduces an interactive system that discovers students’ daily moods and classroom emotions to
enhance the teaching and learning process using heterogeneous sensors. The system is designed to enable
(1) detecting students daily moods and classroom emotions using physiological, physical activities, and event
tags data coming from wristband sensors and smart-phones, (2) discovering association/correlation between
students’ lifestyle and daily moods, and (3) displaying statistical reports and the distribution of daily moods
and classroom emotions of students, both in individual and group modes. A pilot proof-of-concept study was
carried out using Empatica E4 wristband sensors and Android smart-phones, and preliminary evaluation and
findings showing promising results are reported and discussed.
1 INTRODUCTION
The influence of moods/emotions on education has
been researched for decades. Many researches try to
understand the impact of moods/emotions on different
aspects of education in order to create a better lear-
ning environment for students (Pekrun, 1992)(Bryan
et al., 1996)(Titsworth, 2010).
Generally, there are four approaches to under-
stand the impact of moods/emotions in learning and
working environments: (1) paper-based questionnai-
res (Pekrun, 1992)(Bryan et al., 1996)(Lewine et
al., 2015)(Liew and Tan, 2016), (2) digital-based
event tags (Rachuri et al., 2010)(Sottilare and Proctor,
2012)(Kikamwa et al., 2013)(Gjoreski et al., 2015),
(3) physiological signals (Wioleta, 2013)(Hang et al.,
2014)(Valenza et al., 2014), and (4) hybrid (Sano and
Picard, 2013)(Zenonos et al., 2016).
The first approach mostly uses survey methods to
get samples. This leads to a small volume of sam-
ples, limitations in tracking mood/emotion states, sta-
tic and inflexible way to collect data, as well as bias
and delay in providing answers. These factors in-
fluence expected outcomes and make it hard to ge-
neralize the research into higher conceptual levels,
scale up into larger scopes, as well as enabling real-
time monitoring and prediction/detection of moods
and emotions of learners.
The second approach uses computers or smart-
phones as a portal to collect data from users for de-
tecting and/or predicting mood and emotion states.
It is common in the methods of this approach to de-
sign an application (or a website) accessed by smart-
phones or computers with predefined mood/emotion
categories and levels. Users interact with this appli-
cation to input related information for detection of
moods and emotions. Where relevant, prediction mo-
dels could be built using collected data to allow au-
tomatic prediction of users moods/emotions. Nevert-
heless, this approach cannot prevent bias of answers
since users sometimes find it difficult or inconvenient
to determine exactly how they feel at any given time.
The third approach leverages on physiological sig-
nals collected from users using wearable sensors.
Physiological data could be a good alternative to con-
veniently capture information from humans, and to
objectively detect moods/emotions. This is because
such data directly reflects, at least as far as the cho-
sen signal sources are concerned, how human bo-
dies react in a surrounding environment with respect
Dao, M-s., Dang-Nguyen, D-T., Kasem, A. and Tran-The, H.
HealthyClassroom - A Proof-of-Concept Study for Discovering Students’ Daily Moods and Classroom Emotions to Enhance a Learning-teaching Process using Heterogeneous Sensors.
DOI: 10.5220/0006749106850691
In Proceedings of the 7th International Conference on Pattern Recognition Applications and Methods (ICPRAM 2018), pages 685-691
ISBN: 978-989-758-276-9
Copyright © 2018 by SCITEPRESS – Science and Technology Publications, Lda. All rights reserved
685

to any faced issues (Wioleta, 2013). The wearable
sensors used to collect such physiological data vary
from uncomfortable bio-sensors (Hang et al., 2014),
comfortable t-shirts with integrated fabric electrodes
and sensors (Valenza et al., 2014), to wristband sen-
sors (Thapliyal et al., 2017)(Koskimaki et al, 2017).
Among these types of sensors, wristband sensors are
known to be more comfortable in terms of mobility,
mounting location, and continuous skin connection.
The last approach combines smart-phones and we-
arable sensors to collect physiological data, human
behaviour, and moods/emotions tags from users as
well as displaying the detected results to users via
smart-phones (Sano and Picard, 2013)(Zenonos et al.,
2016). This approach leverages all advantages of
smart-phones and wearable sensors to collect data and
detect moods/emotions while still maintaining high
level of convenience and freedom for users.
From psychological perspective, moods and emo-
tions are used to express feelings that people expe-
rience. Although these words are frequently used
interchangeably, there are many differences between
moods and emotions (Beedie et al., 2005). The main
ones are related to intensity, the objects people react
to, and the duration they last. While emotions are
intense feelings directed at someone or something,
moods are feelings that tend to be less intense and
often (though not always) lack a contextual stimu-
lus (Robbins et al., 2010). Besides, a mood may last
longer than an emotion (e.g. hours/days versus se-
conds/minutes) (Beedie et al., 2005).
In order to avoid any misunderstanding, in this pa-
per we use emotions for expressing the feelings of stu-
dents in a classroom where students (university level
in current study) react to a lecturer, a lesson activity,
or their classmates within a limited time; and moods
for out-of-classroom feelings that are heavily influen-
ced by the environment, physiology, or mental state.
In other words, the contexts of emotions and moods
are within-a-classroom and throughout-the-day, re-
spectively.
Many researches have tried to understand the im-
pact of moods and emotions on education based
on two independent contexts: in classroom (Hang
et al., 2014)(Lewine et al., 2015)(Liew and Tan,
2016)(Mainhard et al., 2017), and on campus (Bryan
et al., 1996)(Febrilia and Warokka, 2011)(Kikamwa
et al., 2013)(Gjoreski et al., 2015). Although these
studies have found useful results, there are still open
questions that need to be investigated thoroughly:
1. The research carried out by (Mainhard et al.,
2017) highlights that the students’ emotional ex-
periences can be driven by evolving the specific
relationship between lecturers and students during
class time. Therefore, it would be very useful
to have a tool that can visualize students’ emo-
tions during a class to allow a lecturer to flexibly
change his/her educational method or activity in
order to stimulate positive emotions that enhance
the teaching-learning process.
2. There seem to be no work we are aware if on
discovering association/correlation between daily
moods and classroom emotions of learners. For
example, if one student comes to a class with ne-
gative moods (e.g. nervous, stressed) due to not
yet finishing his/her assignment though staying
late last night, whether this student can have ex-
cited and relaxed emotions during the class time
though a classroom’s atmosphere is very exciting?
3. There are few studies that investigated associa-
tion/correlation between a student’s lifestyle and
his/her daily moods. In this study, we are inte-
rested to investigate, for example, if long-term ne-
gative moods of a student are correlated with a
certain lifestyle (e.g. staying up late, exercising
too much, lack of physical activity, etc.). This
may enable student’s counseling to be triggered
automatically and provides valuable input for the
counseling process.
This paper addresses the above questions at a uni-
versity level by creating a framework, namely He-
althyClassroom, which uses wristband sensors and
smart-phones to collect physiological, physical acti-
vities, and event tags data to detect and visualize
students’ daily moods and classroom emotions, as
well as to discover any association/correlation bet-
ween students’ lifestyles and daily moods.
2 HEALTHYCLASSROOM
Figure 1 illustrates an overview of the Healthy-
Classroom framework. In this context, mood and
emotion can be used interchangeably according to
the context (i.e. if the framework is applied inside a
classroom, emotion is considered, otherwise mood
is used). The physiological, location, and event
tags data (when users provide input by tagging
specific events) are sent from wristband sensors
and smart-phones to a cloud-computing platform.
Using this data, students moods and emotions
are then detected/recognized and displayed on a
website that can be accessed by lecturers and/or
administration users. The timeliness of such in-
formation provides valuable input to understand
the ongoing teaching-learning process and improve
the delivery and interaction between lecturers and
INDEED 2018 - Special Session on INsights DiscovEry from LifElog Data
686
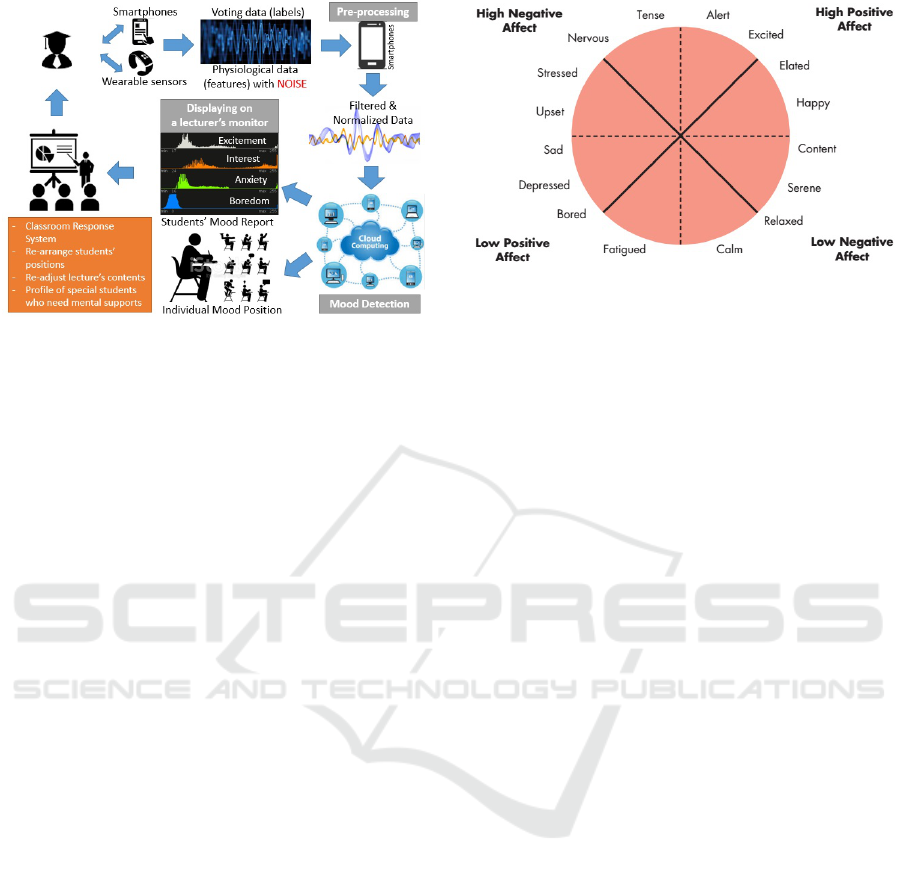
Figure 1: The HealthyClassroom Overview.
students. The data generated from activities outside
the classroom can be used not only to directly influ-
ence the learning process, but also to understand the
social daily activities of students and their mental he-
alth, in addition to triggering necessary counseling in-
tervention.
The system works as follows: The wristband de-
vices worn by students frequently send physiologi-
cal and location signals to smart-phones via Blue-
tooth protocol. The smart-phones do preprocessing
(i.e. data filtering and normalizing) and capture tag-
ging data from students (if provided). For example,
students may choose at different times to give feed-
back about the current mood/emotion they feel, or the
physical activity they are doing. This is performed
using a smart-phone application synchronized with
the wristband sensor, and essentially helps in gene-
rating labeled data crucial at the starting phase of our
study. The data is then sent to a cloud-computing sy-
stem for storage and analysis. In the cloud, training
and re-training tasks to create classifiers for each type
of mood/emotion are triggered according to predefi-
ned models and thresholds. These classifiers will de-
tect mood/emotion along a time-axis. The results can
be displayed - in different forms - on a website that
can be accessed by concerned users for further acti-
ons such as re-arranging students classroom positions,
re-adjusting lessons content, activating classroom re-
sponse system, counseling identification for students
who exhibit negative moods and emotions for a long
time, etc.
2.1 Models of Moods/Emotions
In our work, we refer to (Wioleta, 2013) for a survey
on emotion’s models based on various theories of
emotions and affect models developed for different
application fields. The conclusion is that creating a
Figure 2: The structure of mood, reused from (Robbins et
al., 2010).
model of emotion is not a trivial problem. In this rese-
arch, we use the affect structure presented in (Robbins
et al., 2010), and illustrated in Figure 2.
2.2 Affect Detection and Lifestyle-Mood
Pattern Discovery
Figure 3 illustrates how the association/correlation
among lifestyle, daily moods, classroom emotions,
and classroom interaction can be taken into account
and visualized properly. There are four processes
run synchronously: (1) physical activities (PA) de-
tection using accelerometer and gyroscope data ex-
tracted from smart-phones, (2) daily moods (DM)
recognition using physiological data collected from
wristband sensors, (3) classroom emotions (CE) dis-
covery using physiological data collected from wrist-
band sensors, and (4) association/correlation uncove-
ring using the outputs of the three previous processes.
The first process is built by utilizing the PHA-
SOR system (Dao et al., 2017) where accelerometer
and gyroscope collected from smart-phones are trans-
lated into a set of human daily activities, namely stan-
ding, walking, jogging, up-stairs, downstairs, and sit-
ting. We have also added one more activity, driving,
to this set.
The second and third processes are constructed
based on the concepts shown in Figure 1. Figure 4
illustrates the mechanism used to detect moods and
emotions using physiological signals and event tags.
The fourth process leverages the research presen-
ted in (Laleh et al., 2015) to discover lifestyle-mood
patterns (i.e. association/correlation between lifestyle
and daily moods of students). In this case, we as-
sume that human daily activities could have associ-
ation/correlation with moods. In other words, a se-
quence of activities could lead to a certain mood sta-
tus during a period of time. We formalize this associ-
ation as follows. Let E
i
denote an activity at time t, ∆t
i
HealthyClassroom - A Proof-of-Concept Study for Discovering Students’ Daily Moods and Classroom Emotions to Enhance a
Learning-teaching Process using Heterogeneous Sensors
687
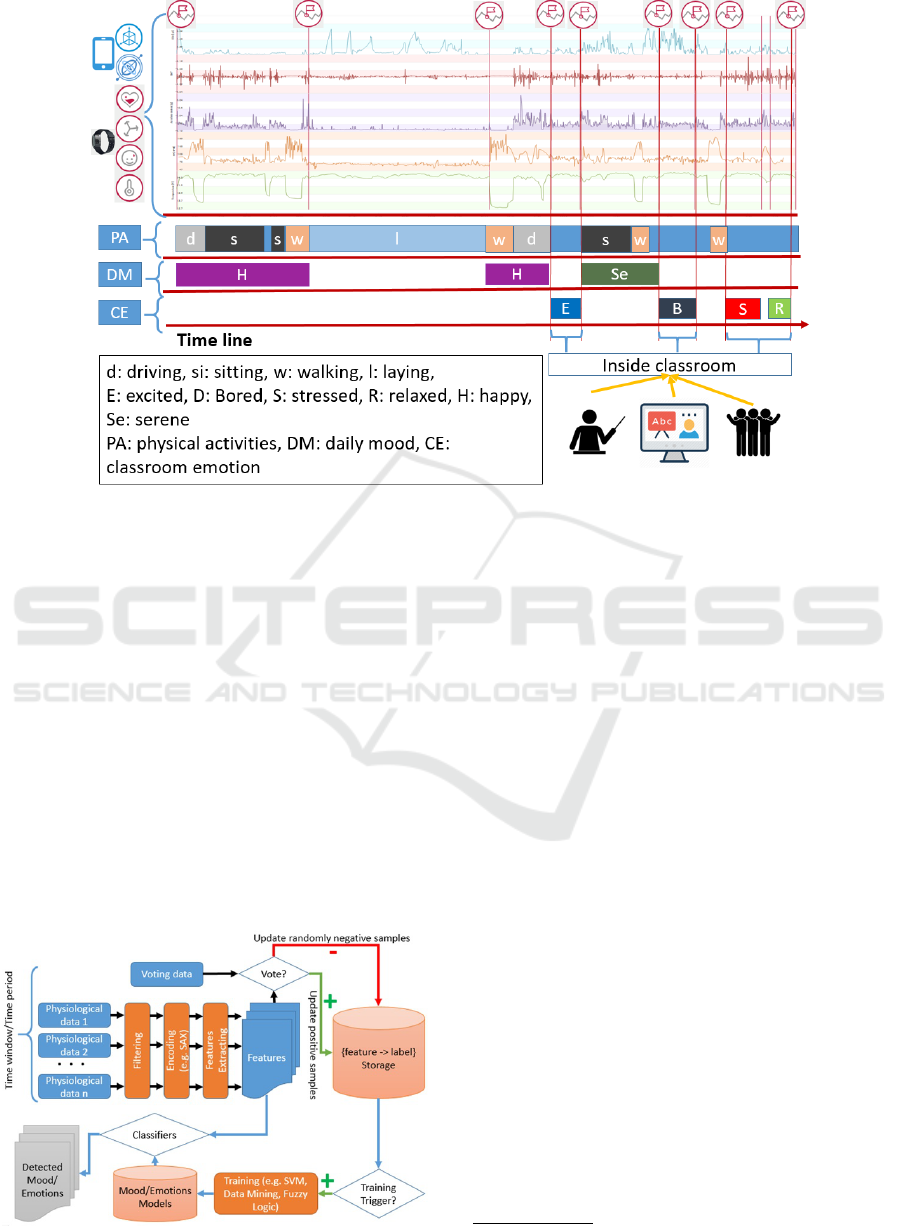
Figure 3: The personal dashboard of associations/correlations among lifestyle, daily moods, and classroom emotions of a
student visualized in HealthyClassroom.
denote the ”time lag” between two consecutive activi-
ties E
i
and E
i+1
, and F
j
represent a mood’s label. The
association/correlation between n consecutive activi-
ties and mood status F can be expressed by the pattern
ρ = (F
p
: E
1
;∆t
1
E
2
;∆t
2
E
3
;...;∆t
n−1
E
n
: F
c
) (1)
where F
p
and F
c
is the previous and current mood sta-
tuses. Then, the pattern recognition component em-
ploys an extended finite-state automata (FSA). The
automaton is designed to contain a finite number of
states and state transitions. The FSA is a 5-tuple,
(OS, T S, E, F
p
, F
c
), consisting of a finite set of ordi-
nary states (OS), time states (TS), directed edges (E),
a start state F
p
∈ OS and a final or acceptance state
F
c
∈ OS. The ”Algorithm 1” described in (Laleh et al.,
2015) is utilized to count the frequencies of patterns.
Figure 4: The Mood/Emotion Detection Mechanism.
If a pattern occurs frequently, it might be significant
and could be, in our context, argued as a lifestyle-
mood pattern.
3 EXPERIMENTAL RESULTS
In this section, we describe HealthyClassroom’s wor-
king environment and performance evaluation. Cur-
rently, the HealthyClassroom works as a proof-
of-concept framework for discovering students’
daily moods and classroom emotions to enhance a
teaching-learning process. Therefore, only the three
questions mentioned in Section 1, as a significant con-
tribution of the HealthyClassroom, are considered for
evaluation.
3.1 Working Environment Setting
We use the Empatica E4 wristband (E4)
1
as a weara-
ble sensor for our system.
The E4 is recently used to collect physiologi-
cal data for early detection of migraine attacks (Ko-
skimaki et al, 2017), and it is shown that this data is
good enough for doing experiments. The E4 has the
following sensors: (1) Photoplethysmograph (PPG)
sensor: measures blood volume pulse (BVP) from
1
https://www.empatica.com/e4-wristband
INDEED 2018 - Special Session on INsights DiscovEry from LifElog Data
688
which heart rate, heart rate variability (HRV), and ot-
her cardiovascular features may be derived; (2) 3-axis
Accelerometer (ACC): captures motion-based acti-
vity; (3) Electrodermal Activity (EDA) sensor: me-
asures sympathetic nervous system arousal and to de-
rive features related to stress, engagement, and exci-
tement; and (4) Infrared Thermopile (TEMP): reads
peripheral skin temperature. Besides, E4 also has a
function called Event Mark Button that is used to tag
events and associate them with physiological signals.
There are three working modes by which users can
collect their data: (1) Recording Mode: uses an inter-
nal memory to store data that can be copied via USB
port later; (2) Streaming Mode: connects to a smart-
phone or desktop computer via Bluetooth using Real-
time App and mobile API for desktop and mobile de-
vices, respectively; and (3) Upload to Connect: uses
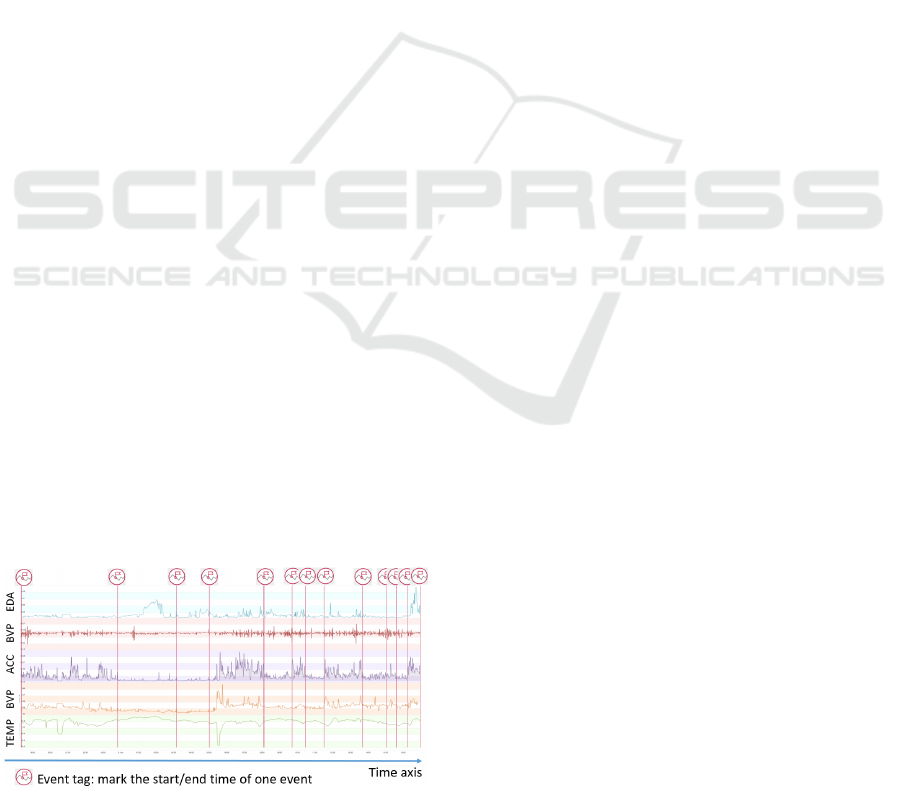
Empatica’s secure cloud platform. Figure 5 displays
one example of data collected from E4.
We have developed a smart-phone app that gets
activated by the E4 Event Mark Button, which is used
to tag the events using the list of mood/emotion labels
mentioned in subsection 2.1. This app can run with
manual and semi-automatic options. The former gets
a label from the user, and the latter generates a label
by using the second and third processes described in
subsection 2.2. A user can re-tag an auto-generated
label if he/she does not agree with the label generated
by the system.
We have also built a website through which users
can login to visualize their information including phy-
sical activities (PA), daily moods (DM), and class-
room emotions (CM). If the user has a lecturer role,
he/she can visualize his/her students information in
real-time mode, to enable taking quick actions such
as adjusting lesson activities (maybe to achieve more
positive in-class emotions).
We have also implemented four system compo-
nents corresponding to the four processes mentioned
in subsection 2.2: (1) Physical Activities Detection,
(2) Mood Detection, (3) Emotion Detection, and (4)
Lifestyle-mood Pattern Discovery.
Figure 5: Physiological data collected by E4, recorded from
18:20 November 7, 2017 to 17:00 November 8, 2017.
3.2 Evaluation
We have asked students and lecturer of one univer-
sity course to join our pilot experiment (15 students, 1
lecturer, Introduction to Programming course). Each
student is requested to wear the E4 wristband for con-
tinuous three weeks time, except during the time the
take bath.
The first week: we collect samples for training
mood/emotion detection models. Students reported
some inconvenience in continuously tagging events
(e.g. choosing mood/emotion labels), especially du-
ring class time since emotions change very fast. We
also use the data of this week to track the ratio of over-
all positive and negative emotions.
The second week: we automatically detect in-
class emotions, and ask the lecturer to monitor the
students emotions visualized by the system, and to
adjust teaching activity or classroom setting to im-
prove classroom emotional climate. The system sho-
wed that high positive emotions have increased by
20% compared to previous week. Currently, we do
not have strong evidence to attribute this improvement
to the adjustment alone, but we argue that knowing
students’ emotions is an important factor that helps to
improve classroom emotional climate. In this week as
well, we start to discover the lifestyle-mood patterns.
The third week: at the beginning of this week,
we released the lifestyle-mood patterns with the hig-
hest negative emotions for each student, and asked
them to try to change these patterns. For example, one
pattern was that staying up late was associated with
”stressed” emotion. Another pattern was that sitting
for long time in campus was associated with ”bored”
emotion. At the end of this week, we noticed an in-
crease of 30% for high positive emotions compared to
the first week. Again, we do not have strong support
for the reason of this improvement, but we argue that
discovering the lifestyle-mood pattern could be anot-
her factor that improves classroom emotional climate.
It is important to note that from the second
week onwards, the system can automatically detect
moods/emotions and daily activities, and therefore the
events tagging has decreased (i.e. only for correcting
wrong labels). Therefore, students expressed feeling
more comfortable with the HealthyClassroom compa-
red to the first week.
By surveying students feedback, ten out of fifteen
students (66.7%) agreed that HealthyClassroom can
help them control their lifestyle-mood relation as well
as improve their passion in studying. Two students
(13.3%) felt nothing changed with the use of Healt-
hyClassroom. Three students (20%) had neutral com-
ments.
HealthyClassroom - A Proof-of-Concept Study for Discovering Students’ Daily Moods and Classroom Emotions to Enhance a
Learning-teaching Process using Heterogeneous Sensors
689

The lecturer felt excited when using Healthy-
Classroom. Nevertheless, continuously monitoring
the percentage of positive emotions and finding a way
to cheer up the class somehow distract the teaching
process. There should be a function that can alert the
lecturer when the emotion climate reaches a certain
level so that the lecturer can adjust himself/herself
better. This solution can alleviate the burden of moni-
toring the fluctuation of classroom emotions continu-
ously. This matter is recognized and will be adopted
in future works.
Since the human daily activity, mood, and emo-
tion detectors are built by using PHASOR (Dao et al.,
2017), we have used the same evaluation scheme to
evaluate the first three processes. According to our
evaluation, the first process (i.e. activities detection)
reaches 90% accuracy while the second (i.e. moods
detection) and the third (i.e. emotions detection) gain
65.2% and 57.3%, respectively.
4 CONCLUSIONS
In this paper, we introduced the HealthyClassroom
framework that works with wristband sensors, smart-
phones, and cloud computing environment to analyze
the impact of students’ daily moods, classroom emo-
tions, and lifestyle on the teaching-learning process.
The HealthyClassroom provides a data visualization
for lecturers to track classroom emotions in real-time,
to enable adjusting lessons’ activities in order to im-
prove students positive emotions. Last but not le-
ast, by getting insights from recorded personal-lifelog
data, including lifestyle-moods patterns, students can
be counseled on how to improve their studying pro-
cess by changing their lifestyle activities.
Although the HealthyClassroom currently is a pi-
lot proof-of-concept study, important findings have
have been gained. Some interesting lifestyle-moods
patterns are discovered that can help lecturers and stu-
dents adjust their teaching-learning behaviors.
We recognize that our current experimental setup
is limited to a small uncontrolled study, and in the fu-
ture it is important to address this issue in order to
reliably conclude if the use of HealthyClassroom re-
flects positively on the teaching-learning process. Be-
sides, it will be interesting to further analyze the cor-
relation between the emotions of different students,
and to see if a students mood/emotion could be in-
fluenced by another student(s). To tackle such in-
vestigations, it might be important to monitor class-
room environment using some sort of crowd-sensing
(e.g. activating smart-phones’ microphones to mea-
sure noise levels, monitoring smart-phone-user inte-
raction to identify students’ distraction, indoor loca-
tion to detect possible students interactions, etc.).
ACKNOWLEDGMENTS
This work is supported by the Internal Research
Grant of Universiti Teknologi Brunei, grant number:
UTB/GSR/1/2016 (10). The authors would like to
thank the students and lecturers of Universiti Tekno-
logi Brunei for their voluntary participation in this
project.
REFERENCES
Beedie, C.J. and Terry, P.C. and Lane, A.M. (2005). Dis-
tinctions between emotion and mood. COGNITION
AND EMOTION. 19 (6), 847-878
Bryan, T. and Mathur, S. and Sullivan, K. (1996). The Im-
pact of Positive Mood on Learning. Learning Disabi-
lity Quarterly. 19 (3), 153-162
Dao, M.S. and Dang-Nguyen, D.T. and Riegler, M. and
Gurrin, C. (2017) Smart lifelogging: recognizing hu-
man activities using PHASOR. In Proc. of 6th Int.
Conf. on Pattern Recognition Applications and Met-
hods (ICPRAM 2017). 24-26.
Febrilia, I. and Warokka, A. (2011). The Effects of Positive
and Negative Mood on University Students Learning
and Academic Performance: Evidence from Indone-
sia. In Proc. of 3rd Int. Conf. on Humanities and So-
cial Sciences. 1-12
Gjoreski, M. and Gjoreski and H. and Lustrek, M. and
Gams, M. (2015). Automatic detection of perceived
stress in campus students using smartphones. Intelli-
gence Environment. 132-135
Hang, A. and Goronzy, S. and Schaich, P. and Williams,
J. (2014). Emotion Recognition Using Bio-Sensors:
First Steps Towards an Automatic System. Tutorial
and Research Workshop on Affective Dialogue Sys-
tems. 36-48
Kikamwa, R. and Liu, Y.X. and Lane, N.D. and Zhong, L.
(2013). MoodScope: Building a Mood Sensor from
Smartphone Usage Patterns. In Proc. of MobiSys13.1-
13
Koskimaki, H. et al (2017). Early detection of migraine at-
tacks based on wearable sensors: experiences of data
collection using Empatica E4. In Proc. of the 2017
ACM Int. Joint Conf. on Pervasive and Ubiquitous
Computing and the 2017 ACM Int. Symposium on We-
arable Computers (UbiComp ’17). 506-511
Laleh, J. and Dao, M.S. and Jain, R. and Zettsu, K. (2015)
Complex asthma risk factor recognition from hetero-
geneous data streams. In Proc. of IEEE Int. Conf. on
Multimedia and Expo Workshops (ICMEW)
Lewine, R. and Sommers, A. and Waford, R. and Robert-
son, C. (2015). Setting the Mood for Critical Thinking
INDEED 2018 - Special Session on INsights DiscovEry from LifElog Data
690

in the Classroom. Int. Journal for the Scholarship of
Teaching and Learning. 9 (2), Article 5, 1-4
Liew, T.W. and Tan, S.M. (2016). The Effects of Posi-
tive and Negative Mood on Cognition and Motivation
in Multimedia Learning Environment. Educational
Technology and Society. 19 (2), 104115
Mainhard, T. and Oudmana, S. an Hornstra, L. and Bosker,
R.J. and Goetz, T. (2017) Student emotions in class:
The relative importance of teachers and their inter-
personal relations with students. Learning and In-
struction. ISSN 0959-4752
Pekrun, R. (1992). The Impact of Emotions on Lear-
ning and Achievement: Towards a Theory of Cogni-
tive/Motivational Mediators. Applied Psychology: An
International Review. 41 (4), 359-376
Rachuri, K.K. et al. (2010). EmotionSense: A Mobile Pho-
nes based Adaptive Platform for Experimental Social
Psychology Research. In Proc. of UbiComp10. 281-
290
Robbins, S.P. and Judge, T.A. and Campbell, T. (2010)
Organizational Behaviour. Pearson. ISBN-10:
0273719394, ISBN-13: 9780273719397
Sano, A. and Picard, R.W. (2013). Stress Recognition using
Wearable Sensors and Mobile Phones. In Proc. of
Humaine Association Conference on Affective Com-
puting and Intelligent Interaction. 671-676
Sottilare, R.A. and Proctor, M. (2012). Passively Classi-
fying Student Mood and Performance within Intelli-
gent Tutors. Educational Technology and Society. 15
(2)
Thapliyal, H and Khalus, V. and Labrado, C. (2017). Stress
Detection and Management: A Survey of Wearable
Smart Health Devices. IEEE Consumer Electronics
Magazine. 6 (4). 64-69
Titsworth, S. and Quinlan, M.M. and Mazer, J.P. (2010)
Emotion in Teaching and Learning: Development and
Validation of the Classroom Emotions Scale. Commu-
nication Education. 59 (4), 431-452
Valenza, G. et al. (2014). Wearable Monitoring for Mood
Recognition in Bipolar Disorder based on History-
Dependent Long-Term Heart Rate Variability Analy-
sis. IEEE Journal of Biomedical and Health Informa-
tics. 18 (5), 1625-1635
Wioleta, S. (2013). Using Physiological Signals for Emo-
tion Recognition. In Proc. of 6th Int. Conf. on Human
System Interactions (HSI). 556-561
Zenonos, A. et al. (2016). HealthyOffice: Mood Recogntion
At Work Using Smartphones and Wearable Sensors.
In Proc. of PERCOM Workshop. 1-6
HealthyClassroom - A Proof-of-Concept Study for Discovering Students’ Daily Moods and Classroom Emotions to Enhance a
Learning-teaching Process using Heterogeneous Sensors
691
