
A Machine Learning Approach for Carotid Diseases using Heart Rate
Variability Features
Laura Verde
1
and Giuseppe De Pietro
2
1
Department of Technology, University of Naples Parthenope, 80143 Naples, Italy
2
Institute of High Performance Computing and Networking (ICAR),
National Research Council of Italy (CNR), 80131 Naples, Italy
Keywords:
Carotid Diseases, Atherosclerosis, HRV Analysis, Machine Learning Techniques, Support Vector Machine.
Abstract:
In the last few years the incidence of carotid diseases has been increasing rapidly. Atherosclerosis constitutes
a major cause of morbidities and mortalities worldwide. The early detection of these diseases is considered
necessary to avoid tragic consequences and automatic systems and algorithms can be a valid support for
their diagnosis. The main objective of this study is to investigate and compare the performances of different
machine learning techniques capable of detecting the presence of a carotid disease by analysing the Heart Rate
Variability (HRV) parameters of opportune electrocardiographic signals selected from an appropriate database
available online on the Physionet website. All the analyses are evaluated in terms of accuracy, precision, recall
and F-measure.
1 INTRODUCTION
During the recent decade the incidence of carotid
atherosclerosis has been increasing dramatically.
This disease accounts for 20% of ischemic stroke
(H
¨
ogberg et al., 2016; Lockau et al., 2015;
Yesilot Barlas et al., 2013) constituting a major cause
of morbidities and mortalities worldwide (Rafieian-
Kopaei et al., 2014). Atherosclerosis is a multifacto-
rial vascular disorder with several genetic and envi-
ronmental causes involving multiple arterial vessels.
It is characterized by an accumulation of lipids, fi-
brous materials and mineral in the arteries, that causes
the formation of placque (Riccioni et al., 2003). This,
in turn, causes a decrease of the blood flow and dam-
age to the organs with, in some cases, very serious
consequences.
To prevent and reduce the resulting disabilities,
appropriate medical therapy and risk factor control
can be adopted. In addition, the early detection and
accurate diagnosis of this disorder are necessary.
Several medical techniques are used to diagnose
carotid diseases. Carotid Doppler ultrasonography
(US) is the most frequently used tool for the evolution
of atherosclerosis of the carotid artery (H
¨
ogberg et al.,
2016; Grant et al., 2003). It is preferable to other
diagnostic techniques, such as computed tomography
or magnetic resonance, due to non-invasiveness, easy
repeatability and low cost. It allows you to perform
an accurate morphological and hemodynamic study
of the arterial axis, and to locate and evaluate the site
and severity of the arterial lesion responsible for the
symptomatology. In particular, it is used to measure
the intima-media thickness (IMT), the best biomarker
for atherosclerosis, useful for the placque characteri-
zation.
Unfortunately, there is no standardization for the
execution of carotid US examinations. This can cause
errors in the performance of this examination. The
most common mistakes are due to an incorrect posi-
tioning of the Doppler probe at the wrong Doppler
angle (Grant et al., 2003), with as a result the possi-
bility of serious errors in the diagnosis. In addition,
the Doppler signals can be influenced by any motion
of the walls of the blood vessels, whose fluctuations
can cause incorrect estimates of these disorders.
To avoid unwanted diagnostic errors and the ex-
cessive costs of other medical examinations, we have
aimed to identify a helpful supplementary diagnostic
supplementary tool that can relate the carotid arterial
wall thickness and Heart Rate Variability (HRV) anal-
ysis using machine learning techniques. Such a tech-
nique represents one of the main estimators of car-
diovascular systems (Camm et al., 1996), whose rela-
tionship with carotid diseases is demonstrated in sev-
eral studies existing in literature (Kwon et al., 2008;
Verde L. and De Pietro G.
A Machine Learning Approach for Carotid Diseases using Heart Rate Variability Features.
DOI: 10.5220/0006730806580664
In Proceedings of the 11th International Joint Conference on Biomedical Engineering Systems and Technologies (HEALTHINF 2018), pages 658-664
ISBN: 978-989-758-281-3
Copyright
c
2018 by SCITEPRESS – Science and Technology Publications, Lda. All rights reserved

Kaufman et al., 2007; Chao et al., 2003). Many of
these report, in fact, a decrease of the HRV parameters
in subjects suffering from atherosclerosis, an associa-
tion that could be due to ischemic damage to the car-
diac nerves (Fakhrzadeh et al., 2012; Gotts
¨
ater et al.,
2006). In addition, due to the easy derivation of HRV
measurements, many commercial devices provide for
their automated measurement.
In detail, in this study we have investigated and
compared the performance of several machine learn-
ing techniques capable of identifying the presence
of carotid diseases using the HRV parameters as the
features for different classifiers. The performances
are evaluated in terms of accuracy, precision, recall
and F-measure for each considered machine learning
method considered.
The paper is organized as follows. In Section 2,
we present the main studies about techniques able to
estimate the carotid diseases existing in literature. In
Section 3, we introduce our experimental phase, in
detail we focus on dataset used in data analysis, the
HRV features considered for the classification and the
machine learning techniques evaluated. The obtained
results are presented in Section 4, while conclusions
are provided in Section 5.
2 RELATED WORK
The analysis of heart rate variability (HRV) from elec-
trocardiographic (ECG) signals has become an im-
portant method for the assessment of cardiovascular
regulation (Huikuri et al., 1999). Several algorithms
have been developed for the automated characteriza-
tion of coronary artery disease (CAD) using linear
and non-linear (Kim et al., 2007; Verma et al., 2016)
HRV features, often using artificial intelligence tech-
niques. Kim et al. (Kim et al., 2016), for example,
proposed an extraction methodology from ultrasound
images for carotid diseases and HRV parameters use-
ful in the diagnosis of cardiovascular diseases. Addi-
tionally, Lee et al. (Lee et al., 2008) investigated the
identification of cardiovascular diseases by evaluating
various features of HRV and carotid wall thickness,
comparing several machine learning techniques.
There are, however, not many studies concern-
ing the automated characterization of carotid diseases
and, unfortunately, these use private and not public-
ity available databases limiting the reproducibility of
the test. Polat et al. (Polat et al., 2007), for exam-
ple, identify atherosclerosis analysing carotid doppler
signals with the Fuzzy weighted pre-processing and
Least Square Support Vector Machine (LSSVM). The
doppler signals used were acquired from 114 subjects
and analysed to evaluate the power spectral density
and sonogram using the Autoregressive (AR) method.
Additionaly, Dirgenali et al. (Dirgenali and Kara,
2006) evaluated Doppler sonograms to distinguish be-
tween healthy subjects and those with atherosclerosis.
The adopted technique classified the Doppler signals,
selected from, also in this case, a private database, us-
ing Artificial Neural Networks (ANN) and Principles
Component Analysis (PCA) for the data reduction.
A combining neural network model was imple-
mented by Ubeyli et al. (
¨
Ubeyli and G
¨
uler, 2005),
instead, for the diagnosis of ophthalmic and inter-
nal carotid arterial disorders. Also in this case
the Doppler signals were selected from a private
database.
3 MATERIALS AND METHODS
In this study we have evaluated the performance of
several machine learning techniques capable of iden-
tifying the presence of atherosclerosis using HRV
features. The analyses have been performed using
WEKA Data Mining toolbox (Witten et al., 2016),
one of the most commonly used systems due to its
reliability, efficiency and ease of use.
In our experimental phase, we have selected sev-
eral ECG signals from an appropriate database. These
signals were processing to extract the features of in-
terest useful in the classification phase using different
machine learning techniques, thanks to we have esti-
mated the presence of carotid diseases or not. This
procedure, used in the development of the classifica-
tion method, is shown in the Figure 1.
In the following subsections we introduce the
dataset used in data analysis, the HRV features con-
sidered for the classification and the machine learning
techniques evaluated.
Figure 1: The flowchart of carotid health state classification.
3.1 Dataset
In our research, we selected the ECG Holter record-
ings of 126 patients from the ”Smart Health for As-

Table 1: HRV features.
HRV Features Description
Linear
Features
Mean RR Mean of RR intervals
SDRR Standard deviation of the RR intervals
SDNN Standard deviation of NN intervals
SDSD Standard deviation of the successive difference RR in-
tervals
RMSSD Square root of the mean of the squares of the succes-
sive differences between adjacent NNs
HF Components High Frequency power, from 0,15 Hz to 0,4 Hz
LF Components Low Frequency power, from 0,04 Hz to 0,15 Hz
VLF Components Very Low Frequency power, from 0 Hz to 0,04 Hz
Nonlinear
Features
SD1 Standard deviation of the distance of RR(i) from the
line y=x in the Poincar
`
e plot
SD2 Standard deviation of the distance of RR(i) from the
line y=-x+2RR in the Poincar
`
e plot
sessing the Risk of Events via ECG database (Melillo
et al., 2012)” available online on the Physionet web-
site (Goldberger et al., 2000).
It consists of the recordings of 89 subjects suffer-
ing from carotid diseases and 37 healthy subjects, in-
cluding 80 males (59 pathological and 21 healthy),
and 46 females (30 pathological and 16 healthy).
The pathological state was identified by analysing
the IMT value, evaluated with the B-mode ultrasound
and considered to be a objective maker for the esti-
mate of atherosclerosis.
3.2 Feature Extraction
Heart Rate Variability is, generally, used as a clin-
ical tool to evaluate the cardiac autonomic function
(Camm et al., 1996). It is based on the analysis of RR
intervals, the series of time intervals between heart-
beats.
Traditional HRV measures are distinguished into
two categories: time domain measures and frequency
domain measures. The mean, standard deviation,
square root of the mean of successive RR intervals
difference and other time domain measures are widely
utilized to quantify the overall variability of the heart
rate. Frequency domain features of HRV, instead, pro-
vide information about the cardiac autonomic regula-
tion. Finally, the HRV analysis provides several non-
linear features useful to estimate the variability and
regularity of the regulatory system of the heart rate.
In detail, the HRV features used in our study are
reported in Table 1, where normal-to-normal (NN) in-
tervals are defined as intervals between adjacent QRS
complexes resulting from sinus node depolarizations.
All features are calculated by means of the Pan-
Tompkins algorithm (Pan and Tompkins, 1985) using
the Matlab software.
3.3 Classification Methods
To classify the signals we executed several test choos-
ing different machine learning algorithms. These
techniques are:
Support Vector Machine (SVM): The idea of the
SVM algorithm is to create a hyperplane between
datasets and indicate which class it belongs to. The
main advantages of the SVM method are its flexi-
bility, remarkable resistance to overfitting and sim-
plicity. The accuracy performance obtained with the
SVM technique can be improved by changing the ker-
nel function K(x,y) (Sch
¨
olkopf et al., 1999; Vapnik,
1999), choosing a polynomial kernel function or ra-
dial basis function (RBF). In this study, we applied the
sequential minimum optimization (SMO) algorithm
(Platt, 1998).
Bayesian Classification: This approach takes its
name from Thomas Bayes, who proposed the Bayes
Theorem. The classification is based on a probabilis-
tic model that represents a set of random variables
and their conditional dependencies, identified, respec-
tively, as nodes and strings, by means of an acyclic
oriented graph (John and Langley, 1995).
Decision Tree: This algorithm is one of the most
widely used and practical methods to classify cate-
gorical data based on their attributes, features that
described each considered case. Decision tree algo-
rithms begin with a set of cases and create a tree data
structure. We used J48, an implementation of algo-
rithm C4.5 (Salzberg, 1994).

Table 2: Results obtained for several q values for polynomial kernel.
q 1 2 3 4 5 6
Accuracy (%) 72.22 72.22 70.63 70.63 70.63 70.63
Recall (%) 97.75 98.88 98.88 98.88 100.00 100.00
Precision (%) 72.50 72.13 70.97 70.97 70.63 70.63
F-measure (%) 83.25 83.41 82.63 82.63 82.79 82.79
Table 3: Results obtained for several γ values for RBF kernel.
γ 0.01 0.50 0.70 0.90 1.00 1.50 2.00
Accuracy (%) 70.63 69.84 70.63 69.84 69.05 69.05 70.63
Recall (%) 100.00 98.88 98.88 95.51 94.38 95.51 98.88
Precision (%) 70.63 70.40 70.97 71.43 71.19 70.83 70.97
F-measure (%) 82.79 82.24 82.63 81.73 81.16 81.34 82.63
Multilayer Perceptron: In 1958 Rosenblatt pre-
sented the notion of the single perceptron, concept on
which the Multilayer Perceptron algorithm is based.
He introduced the idea that a single output from mul-
tiple real-valued inputs is calculated by a perceptron,
a network of simple neurons. A linear combination
according to its input weights is developed and the
output is presented through some non-linear activa-
tion functions (Ruck et al., 1990).
Logistic Model Tree: In this technique the logis-
tic regression models is combined with tree induc-
tion. It consists of a standard decision tree structure
where the leaves are the logistic regression functions.
In Weka this algorithm is implemented by the Simple
Logistic class (Landwehr et al., 2005).
Instance-based Learning algorithm: This ap-
proach generates classification predictions using only
specific instances. The algorithms used are k-nearest
neighbor (k-NN) (Aha et al., 1991), that looks at the
k nearest neighbors of a new instance to decide which
class the new instance should belong to (Ibk in Weka)
and K* (Cleary et al., 1995), an instance-based clas-
sifier that uses an entropy-based distance function un-
like other instance-based learners (kStar in Weka).
4 RESULTS AND DISCUSSION
Due to the limited number of samples, cross-
validation was used to validate the feature vector cal-
culated. In detail we used a 10-fold cross-validation,
such as we partitioned randomly the dataset into k=10
equal size subsdatasets. From these latter, a single
subset is considered as the validation set for testing
the model while the remaining k-1 subdatasets consti-
tute the training data. This process is repeated k times
where each k subdatasets is used to validate data.
We defined the following measurements:
• True positive (TP): the input sample is pathologi-
cal and the algorithm recognizes this;
• True Negative (TN): the input sample is healthy
and the algorithm recognizes this;
• False Positive (FP): the input sample is healthy but
the algorithm recognizes it as pathological;
• False Negative (FN): the input sample is patho-
logical but the algorithm recognizes it as healthy.
The final results were evaluated in terms of accu-
racy, precision, recall and F-measure, defined as fol-
lows:
Accuracy =
(T P + T N)
(T P + T N + FP + FN)
(1)
Precision =
T P
(T P + FP)
(2)
Recall =
T P
(T P + FN)
(3)
F − measure =
(2 ∗ Precision ∗ Recall)
(Precision + Recall)
(4)
In the first phase of the experimental analysis we
performed a series of tests using the Support Vector
Machine classifier, one of the most usually used ma-
chine learning algorithms. As indicated in the Sub-
section 3.3, it is possible to improve the classifica-
tion accuracy of this algorithm by changing the Ker-
nel value and expression. The Kernel function can,
in fact, be indicated in the polynomial form or with
the radial basis function (RBF) (Burges, 1998). In
the first case, the kernel is expressed as a polynomial
function of degree q, that is:
K(x
i
, x
j
) = (x
T
i
x
j
+ 1)
q
(5)
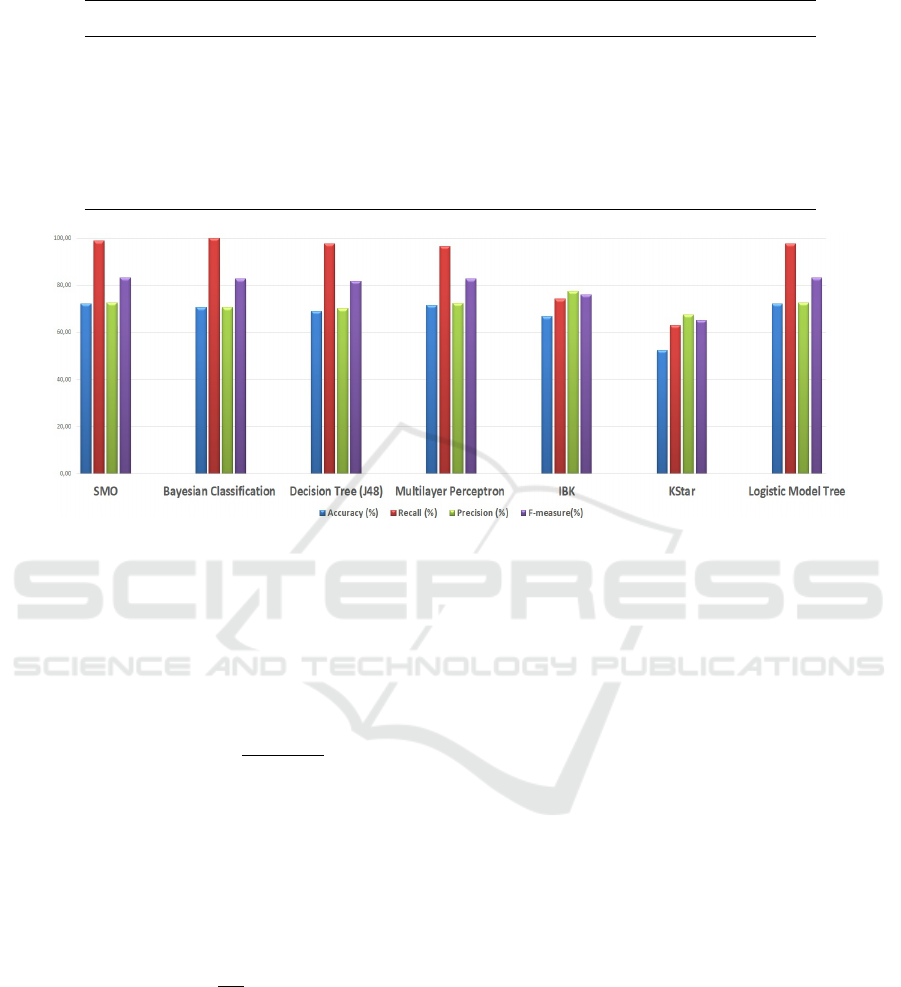
Table 4: Results achieved with the main machine learning techniques.
Classifier Accuracy (%) Recall (%) Precision (%) F-measure (%)
SMO 72.22 98.88 72.50 83.25
Bayesian Classification 70.63 100.00 70.63 82.79
Decision Tree (J48) 69.05 97.75 70.16 81.69
Multilayer Perceptron 71.43 96.63 72.27 82.69
Ibk 66.67 74.16 77.65 75.86
Kstar 52.38 62.92 67.47 65.12
Logistic Model Tree 72.22 97.75 72.50 83.25
Figure 2: Results achieved with the main machine learning techniques.
where x
i
and x
j
are two input samples, x
T
is trans-
posed and q is the degree of the polynomial function,
which can be selected by the user. When q = 1, we
have the linear kernel that corresponds to the original
formulation.
The RBF kernel, instead, is indicated as:
K(x
i
, x
j
) = exp[−
||x
i
− x
j
||
2
2s
2
] (6)
where x
i
and x
j
are two input samples and s is se-
lected by user. It can be, also, expressed as:
K(x
i
, x
j
) = exp[−γ(||x
i
− x
j
||)
2
], γ > 0 (7)
defining the parameter γ as:
γ =
|1|
2s
2
(8)
In this work the q parameter for the kernel poly-
nomial and the γ one for RBF were experimentally
investigated to achieve the best classification result.
Several performances obtaining changing q pa-
rameters for the kernel polynomial are indicated in the
Table 2. Overall, the best performances were obtained
for q = 2 in terms of accuracy, recall and F-measure,
although, the precision result is slightly lower than
that obtained for q = 1.
In the Table 3 several results for different γ values
are shown. In this case the several obtained perfor-
mance are similar. The best performance are obtained
with a γ value equal to 0.01.
Analysing the results obtained using both the
polynomial kernel and RBF kernel, the best perfor-
mance in terms of accuracy was achieved by using
the polynomial function.
The results obtained were compared with results
achieved with the main machine learning techniques
considered. These results are shown in the Table 4 and
in the Figure 2. The lowest performances were ob-
tained using the Instance-based Learning algorithms
(Ibk and kStar), while the best results were achieved
using the SMO classifier.
5 CONCLUSIONS
Nowadays, the incidence of degenerative atheroscle-
rosis is rapidly increasing. Automated classification
systems can constitute a valid support for the early
detection of this disorder, offering several advantages:
they are fast, non-invasive, easy to perform and inex-
pensive.
In this study, a comparison between the most fre-
quently used machine learning techniques has been
carried out, by evaluating their performance in clas-

sifying the presence of carotid diseases using HRV
features. HRV analysis represents one of the main
approach able to estimate functionality of cardiovas-
cular system, in relationship with carotid diseases
as demonstrated by several studies existing in liter-
ature. We have considered several machine learning
methods including Support Vector Machine, Bayesian
Classifiers, Decision Tree, Multilayer Perceptron, Lo-
gistic Model Tree and Instance-based Learning algo-
rithms. The Support Vector Machine has proved to be
more effective than any of the other methods consid-
ered.
In future work, we will explore the possibility of
improving the classification obtained by using a hy-
brid system constructed by combining several ma-
chine learning techniques and methods for data reduc-
tion, such as for example the Principles Component
Analysis (PCA), necessary to reduce computational
complexity and execution times.
ACKNOWLEDGEMENTS
This work has received funding from the European
Unions Horizon 2020 Framework Programme for
Research and Innovation under grant agreement no
727528 (KONFIDO). The authors would like to ac-
knowledge Prof. Luigi Romano, of the Department
of Technology, University of Naples Parthenope for
his technical contribution.
REFERENCES
Aha, D. W., Kibler, D., and Albert, M. K. (1991).
Instance-based learning algorithms. Machine learn-
ing, 6(1):37–66.
Burges, C. J. (1998). A tutorial on support vector machines
for pattern recognition. Data mining and knowledge
discovery, 2(2):121–167.
Camm, A. J., Malik, M., Bigger, J., Breithardt, G., Cerutti,
S., Cohen, R. J., Coumel, P., Fallen, E. L., Kennedy,
H. L., Kleiger, R. E., et al. (1996). Heart rate vari-
ability: standards of measurement, physiological in-
terpretation and clinical use. task force of the euro-
pean society of cardiology and the north american so-
ciety of pacing and electrophysiology. Circulation,
93(5):1043–1065.
Chao, A., Chern, C., Kuo, T., Chou, C., Chuang, Y., Wong,
W., and Hu, H. (2003). Noninvasive assessment of
spontaneous baroreflex sensitivity and heart rate vari-
ability in patients with carotid stenosis. Cerebrovas-
cular Diseases, 16(2):151–157.
Cleary, J. G., Trigg, L. E., et al. (1995). K*: An instance-
based learner using an entropic distance measure. In
Proceedings of the 12th International Conference on
Machine learning, volume 5, pages 108–114.
Dirgenali, F. and Kara, S. (2006). Recognition of early
phase of atherosclerosis using principles component
analysis and artificial neural networks from carotid
artery doppler signals. Expert Systems with Applica-
tions, 31(3):643–651.
Fakhrzadeh, H., Yamini-Sharif, A., Sharifi, F., Tajal-
izadekhoob, Y., Mirarefin, M., Mohammadzadeh, M.,
Sadeghian, S., Badamchizadeh, Z., and Larijani, B.
(2012). Cardiac autonomic neuropathy measured
by heart rate variability and markers of subclinical
atherosclerosis in early type 2 diabetes. ISRN en-
docrinology, 2012.
Goldberger, A., Amaral, L., Glass, L., Hausdorff, J., Ivanov,
P. C., Mark, R., Mietus, J., Moody, G., Peng, C., and
Stanley, H. (2000). Physiobank, physiotoolkit, and
physionet: Components of a new research resource for
complex physiologic signals. circulation [online]. 101
(23), pp. e215–e220.
Gotts
¨
ater, A., Ahlgren,
˚
A. R., Taimour, S., and Sundkvist,
G. (2006). Decreased heart rate variability may pre-
dict the progression of carotid atherosclerosis in type
2 diabetes. Clinical Autonomic Research, 16(3):228–
234.
Grant, E. G., Benson, C. B., Moneta, G. L., Alexandrov,
A. V., Baker, J. D., Bluth, E. I., Carroll, B. A.,
Eliasziw, M., Gocke, J., Hertzberg, B. S., et al. (2003).
Carotid artery stenosis: gray-scale and doppler us di-
agnosissociety of radiologists in ultrasound consensus
conference. Radiology, 229(2):340–346.
H
¨
ogberg, D., Dellagrammaticas, D., Kragsterman, B.,
Bj
¨
orck, M., and Wanhainen, A. (2016). Simplified ul-
trasound protocol for the exclusion of clinically signif-
icant carotid artery stenosis. Upsala journal of medi-
cal sciences, 121(3):165–169.
Huikuri, H. V., M
¨
akikallio, T., Airaksinen, K. J., Mitrani,
R., Castellanos, A., and Myerburg, R. J. (1999). Mea-
surement of heart rate variability: a clinical tool or
a research toy? Journal of the American College of
Cardiology, 34(7):1878–1883.
John, G. H. and Langley, P. (1995). Estimating continuous
distributions in bayesian classifiers. In Proceedings
of the Eleventh conference on Uncertainty in artificial
intelligence, pages 338–345. Morgan Kaufmann Pub-
lishers Inc.
Kaufman, C. L., Kaiser, D. R., Steinberger, J., and Dengel,
D. R. (2007). Relationships between heart rate vari-
ability, vascular function, and adiposity in children.
Clinical Autonomic Research, 17(3):165–171.
Kim, H., Ishag, M. I. M., Piao, M., Kwon, T., and Ryu,
K. H. (2016). A data mining approach for cardiovas-
cular disease diagnosis using heart rate variability and
images of carotid arteries. Symmetry, 8(6):47.
Kim, W.-S., Jin, S.-H., Park, Y., and Choi, H.-M. (2007).
A study on development of multi-parametric mea-
sure of heart rate variability diagnosing cardiovascu-
lar disease. In World Congress on Medical Physics
and Biomedical Engineering 2006, pages 3480–3483.
Springer.

Kwon, D.-Y., Lim, H. E., Park, M. H., Oh, K., Yu, S.-
W., Park, K.-W., and Seo, W.-K. (2008). Carotid
atherosclerosis and heart rate variability in ischemic
stroke. Clinical Autonomic Research, 18(6):355–357.
Landwehr, N., Hall, M., and Frank, E. (2005). Logistic
model trees. Machine learning, 59(1-2):161–205.
Lee, H. G., Noh, K. Y., and Ryu, K. H. (2008). A data
mining approach for coronary heart disease predic-
tion using hrv features and carotid arterial wall thick-
ness. In BioMedical Engineering and Informatics,
2008. BMEI 2008. International Conference on, vol-
ume 1, pages 200–206. IEEE.
Lockau, H., Liebig, T., Henning, T., Neuschmelting, V.,
Stetefeld, H., Kabbasch, C., and Dorn, F. (2015). Me-
chanical thrombectomy in tandem occlusion: proce-
dural considerations and clinical results. Neuroradiol-
ogy, 57(6):589–598.
Melillo, P., Izzo, R., De Luca, N., and Pecchia, L. (2012).
Heart rate variability and target organ damage in hy-
pertensive patients. BMC cardiovascular disorders,
12(1):105.
Pan, J. and Tompkins, W. J. (1985). A real-time qrs de-
tection algorithm. IEEE transactions on biomedical
engineering, (3):230–236.
Platt, J. (1998). Sequential minimal optimization: A fast
algorithm for training support vector machines.
Polat, K., Kara, S., Latifo
˘
glu, F., and G
¨
unes¸, S. (2007). Pat-
tern detection of atherosclerosis from carotid artery
doppler signals using fuzzy weighted pre-processing
and least square support vector machine (lssvm). An-
nals of biomedical engineering, 35(5):724–732.
Rafieian-Kopaei, M., Setorki, M., Doudi, M., Baradaran,
A., and Nasri, H. (2014). Atherosclerosis: process,
indicators, risk factors and new hopes. International
journal of preventive medicine, 5(8):927.
Riccioni, G., De Santis, A., Cerasa, V., Menna, V., Di Ilio,
C., Schiavone, C., Ballone, E., and D’Orazio, N.
(2003). Atherosclerotic plaque formation and risk fac-
tors. International journal of immunopathology and
pharmacology, 16(1):25–31.
Ruck, D. W., Rogers, S. K., Kabrisky, M., Oxley, M. E.,
and Suter, B. W. (1990). The multilayer perceptron
as an approximation to a bayes optimal discriminant
function. IEEE Transactions on Neural Networks,
1(4):296–298.
Salzberg, S. L. (1994). C4. 5: Programs for machine learn-
ing by j. ross quinlan. morgan kaufmann publishers,
inc., 1993. Machine Learning, 16(3):235–240.
Sch
¨
olkopf, B., Burges, C. J., and Smola, A. J. (1999). Ad-
vances in kernel methods: support vector learning.
MIT press.
¨
Ubeyli, E. D. and G
¨
uler,
˙
I. (2005). Improving medical diag-
nostic accuracy of ultrasound doppler signals by com-
bining neural network models. Computers in Biology
and Medicine, 35(6):533–554.
Vapnik, V. N. (1999). An overview of statistical learn-
ing theory. IEEE transactions on neural networks,
10(5):988–999.
Verma, L., Srivastava, S., and Negi, P. (2016). A hybrid data
mining model to predict coronary artery disease cases
using non-invasive clinical data. Journal of medical
systems, 40(7):1–7.
Witten, I. H., Frank, E., Hall, M. A., and Pal, C. J. (2016).
Data Mining: Practical machine learning tools and
techniques. Morgan Kaufmann.
Yesilot Barlas, N., Putaala, J., Waje-Andreassen, U., Vas-
silopoulou, S., Nardi, K., Odier, C., Hofgart, G., En-
gelter, S., Burow, A., Mihalka, L., et al. (2013). Etiol-
ogy of first-ever ischaemic stroke in european young
adults: the 15 cities young stroke study. European
journal of neurology, 20(11):1431–1439.
