
Development of the Decision Support System in Treatment of Arterial
Hypertension
Application of Artificial Neural Networks for Evaluation of Heart Rate Variability
Signals
Anton Dolganov
1
, Vladimir Kublanov
1
, David Belo
2
and Hugo Gamboa
2
1
Ural Federal University, Mira 19, 620002, Yekaterinburg, Russian Federation
2
Laboratório de Instrumentação, Engenharia Biomédica e Física da Radiação (LIBPhys-UNL),
Departamento de Física, Faculdade de Ciências e Tecnologia da Universidade Nova de Lisboa,
Monte da Caparica, 2892-516 Caparica, Portugal
Keywords: Heart Rate Variability, Artificial Neural Networks, Classification, Arterial Hypertension.
Abstract: The article presents first step of the decision support system development in treatment of arterial hypertension.
Results of arterial hypertension diagnostic task by short-term signals of heart rate variability are presented.
The tilt test study was used as the functional load. The peculiarity of this work is application of neural
networks for this task. The different number of hidden layers in the neural networks and different number of
neurons in hidden layers were tested in this study. The classification accuracy of the neural networks was
compared with those of simple machine learning classifiers. The following steps of the decision support
system development are declared.
1 INTRODUCTION
According to the WHO experts the arterial hyper-
tension is the most frequent pathology of cardio-
vascular system. It is occurring among 15-25% of
adult population. Hypertension is one of the most
important factors of such diseases as coronary heart
disease, stroke and heart failure. The arterial hyper-
tension has a multi-factor origin and for a long time
is asymptomatic. However, fairly soon it might lead
to acute events. Therefore the task of early preclini-
cal diagnostic is relevant (Feng et al., 2014; Mancia
et al., 2013; Mendis et al., 2010).
The arterial hypertension emerges as a result of
regulatory mechanisms disorders of the vascular tone.
The most important indicator of the vascular tone is
the arterial pressure. It is well known that arterial
pressure is supported by the several regulatory
mechanisms, including neuronal and humoral. Here
is the exceptional role of the autonomic nervous
system (ANS).
Often, in accordance with recommendations of
the medical societies, arterial hypertension treatment
consists of several medications. These may lead to
polypragmasy and several side effect (Mancia et al.,
2013). The alternative to the pharmacological
approach is application of the physiotherapy
equipment dedicated to improvement of the
cardiovascular system. The ‘SYMPATHOCOR-01’
neuro-electrostimulator is one of such devices. The
device provides correction of the sympathetic
department of the ANS. Through the sympathetic
department the device has constricted control of the
vascular tone (Kublanov et al., 2010). Thereby it is
appropriate to apply in the development of the decision
support system in treatment of arterial hypertension
such methods that allow monitoring current state of the
ANS.
One of the indirect ways to access functioning of
the ANS is the heart rate variability (HRV). (Kseneva
et al., 2016). Non-invasiveness and easy derivation of
the HRV measurement make it widely studied and
practical tool to monitor ANS function (Zadeh et al.,
2010). The R-R intervals of the ECG signals forms
the Heart Rate Variability (HRV) signals. The digital
HRV signal processing has a long history and
methodological recommendation for practical usage
were reflected in work of various scientific groups in
many countries around the globe (Malik, 1996;
Tarvainen et al., 2014; Ushakov et al., 2013).
Dolganov, A., Kublanov, V., Belo, D. and Gamboa, H.
Development of the Decision Support System in Treatment of Arterial Hypertension - Application of Artificial Neural Networks for Evaluation of Heart Rate Variability Signals.
DOI: 10.5220/0006728903250331
In Proceedings of the 11th International Joint Conference on Biomedical Engineering Systems and Technologies (BIOSTEC 2018) - Volume 4: BIOSIGNALS, pages 325-331
ISBN: 978-989-758-279-0
Copyright © 2018 by SCITEPRESS – Science and Technology Publications, Lda. All rights reserved
325

In some works authors suggest that common
features of HRV have low sensitivity. However, joint
application of common features with non-linear
estimations could be of great benefit for more
practical identification of patients at risk
(Chattipakorn et al., 2007)
The Artificial Neural Networks (ANN) Artificial
neural networks is a computing approach, which was
inspired by the functioning of the biological neural
networks. Such approach have proven to be
successful in solving different task on variety of
data(Belova et al., 2007; Lee et al., 2005; Tkacz and
Kostka, 2000). There are several works in which
ANN is applied for HRV signals computing (Patel et
al., 2011; Rajendra Acharya et al., 2003). However,
in that works a limited number of HRV features were
used.
On the other hand, there are works that apply
ANN for classification of arterial hypertension
among people suffering from obesity (Pytel et al.,
2015). There, anthropometric measures were used as
the hypertension indicators. However such approach
does not allows to evaluate dynamic reaction of the
organism on the functional load.
To our knowledge this study is the first attempt to
apply ANN for diagnostic of the arterial hypertension
using big vector of the HRV features. The goal of the
present work is first stage in the development of the
decision support system in treatment of arterial
hypertension. For this in present work classification
accuracy of ANN was evaluated for two groups –
relatively healthy volunteers and patients suffering
from arterial hypertension. Additionally, obtained
results were compared with evaluations of other
machine learning classifiers.
2 MATERIALS AND METHODS
2.1 Clinical Data
The clinical data was recorded at the Sverdlovsk
Clinical Hospital of Mental Diseases for Military
Veterans (Yekaterinburg, Russian Federation). This
pilot study had an approval of the local Ethics
Committee (Ural State Medical University,
Yekaterinburg, Russian Federation). The dataset
itself includes the recorded data of 28 healthy people
and 40 patients. All the patients were diagnosed with
the II/III degree of arterial hypertension. All
participants were volunteers and had signed the
participation consent.
The exclusion criteria were: liver failure, kidney
failure, diabetes of I type, diffusion collagen disease,
heart failure of III-IV class (NYHA classification),
respiratory failure, acute impairment of cerebral
circulation (6 month prior to the study), unstable
angina or myocardial infarction (6 month prior to the
study), permanent atrial fibrillation, women during
pregnancy and lactation period.
Electrocardiography (ECG) signals were recorded
by the electroencephalograph-analyzer “Encephalan-
131-03” (“Medicom-MTD”, Taganrog, Russian
Federation) in the first limb lead (Kleiger et al.,
2005). After the ECG signal recording the
“Encephalan-131-03” software automatically derive
the HRV signals.
The clinical data was recorded in three functional
states involving the rotating table Lojer (Vammalan
Konepaja DY, Finland). During the first state the
participant calmly lies on the exanimating table (state
F). At the second state the so-called tilt-test is
performed – the head end of the table is lifted up to
70
o
from the horizontal position (state O). At the final
state the participant returns to the horizontal position
(state K). The functional load was supervised by the
physician. The duration of the signal record in each
state was 300 seconds. In this study only features of
state O were used, as this state was the most efficient
classification accuracy wise (Kublanov et al., 2017).
2.2 Heart Rate Variability Features
Usually in state-of-art works that involve HRV signal
processing the Kubios software package is used to
extract HRV-related features (Tarvainen et al., 2014).
Tables 1-6 present summary of the features used in
this study. That list of features consist of time-domain
(tables 1 and 2) and frequency-domain features (table
3) established by the European Society of Cardiology
(Malik, 1996) as well as relevant non-linear features
(table 4) (Sivanantham and Shenbaga Devi, 2014). In
our study, in addition to commonly used features, the
wavelet transform features were used (tables 5 and 6)
(Egorova et al., 2014). Overall, a comprehensive list
of 64 features was considered.
Before features calculation, the outliers were
removed from the original R-R time series. By
outliers in this study, we have considered values of R-
R time series that differed from the mean of time-
series by more than three times of the standard
deviation. Across the entire signal samples less than
1.7 % of data were removed. This processed version
of the signal will be referred as a NN (Normal-to-
Normal) time series.
NENT 2018 - Special Session on Neuro-electrostimulation in Neurorehabilitation Tasks
326

Table 1: HRV statistical features.
Feature
Description
M
Mean value of the NN time-series
HR
Heart Rate
SDNN
Standard Deviation of the NN time-series
skewness
Skewness of the NN time-series
kurtosis
Kurtosis of the NN time-series
CV
the Coefficient of Variation
RMSSD
Square Root of the Mean of Squares of the
NN time-series
NN50
Variation higher than 50ms in the NN time-
series
pNN50
Normalized NN50 by the length of NN time-
series
SDSD
Standard Deviation of Differences between
Successive elements in NN time-series
ZCR
Zero Crossing Rate
Statistical features included general estimation,
like mean and standard deviation. Moreover, there
were HRV-specific ones, which concern interaction
between consequent intervals (Malik, 1996). In table
1 the ZCR feature is evaluated in relation to the mean
value of the NN time series.
Table 2: HRV geometric features.
Feature
Description
M0
Mode of the NN time-series
VR
Variation Range
AM0
Amplitude of the Mode
SI
Stress Index
IAB
Index of Autonomic Balance
ARI
Autonomic Rhythm Index
IARP
Index of Adequate Regulation
Processes
St. George Index
The triangular Index
In table 2 the standard features are the mode,
amplitude of the mode, variation range and St.
George Index (Malik, 1996). Remaining features are
calculated using the standard ones, in accordance
with recommendations (Baevskiy, 2001).
In the case of the Fourier and wavelet transform
evaluation, the original R-R intervals were
interpolated, for a corresponding sampling frequency
of 10Hz, using cubic splines before the spectral
analysis (De Boor, 1978). For the wavelet transform
computation the Gaussian wavelet of the 8-th order
was used (Mallat, 2009). Main frequency components
of HRV are: high frequency (HF), from 0.15 to 0.4
Hz; low frequency (LF), from 0.04 to 0.15 Hz; very
low frequency (VLF), from 0.003 to 0.04 Hz.
Table 3: HRV Fourier spectral features.
Feature
Description
HF(Fr)
High Frequency Fourier Spectral Power
LF(Fr)
Low Frequency Fourier Spectral Power
VLF(Fr)
Very Low Frequency Fourier Spectral
Power
TP(Fr)
Total Power of the Fourier Spectrum
LF/HF(Fr)
Autonomic Balance Exponent Power of
the Fourier Spectrum
HFmax(Fr)
Maximum power of the HF
HFn(Fr)
Normalized Power of the HF Fourier
Spectrum
LFn(Fr)
Normalized Power of the LF Fourier
Spectrum
VLFn(Fr)
Normalized Power of the VLF Fourier
Spectrum
IC
Index of Centralization
IAS
Index of the Subcortical Nervous Center’s
Activation
HFmax
the maximal power of the HF spectral
component
RF
Respiration Frequency
LFmax
the maximal power of the LF spectral
component
f(LFmax)
the frequency that corresponds to the
LFmax
VLFmax
the maximal power of the VLF spectral
component
f(VLFmax)
the frequency that corresponds to the
VLFmax
In table 4 the SD1 and SD2 values are evaluated
for the Poincare plot – graph of the NN time-series,
when each interval is plotted against the following
interval. The Entropy indexes are indicators of the
time series complexity and regularity (Yentes et al.,
2013).
Table 4: HRV non-linear features.
Feature
Description
En
Shannon entropy
EnInterp
Shannon entropy of the interpolated time-
series
ApEn
Approximate Entropy
SamEn
Sample Entropy
SD1
Standard Deviation perpendicular the line-
of-identity
SD2
Standard Deviation along the line-of-identity
SD1/SD2
Ratio of Poincare Plot’s Standard Deviations
In table 5, in addition to the common HRV
spectral features, the Standard Deviations and
Shannon entropies of the time series, obtained by the
wavelet transform are presented.
Development of the Decision Support System in Treatment of Arterial Hypertension - Application of Artificial Neural Networks for
Evaluation of Heart Rate Variability Signals
327

Table 5: HRV wavelet spectral features.
Feature
Description
HF(wt)
High Frequency Wavelet Spectral Power
LF(wt)
Low Frequency Wavelet Spectral Power
VLF(wt)
Very Low Frequency Wavelet Spectral
Power
TP(wt)
Total Power of the Wavelet Spectrum
HFn(wt)
Normalized Power of the HF Wavelet
Spectrum
LFn(wt)
Normalized Power of the LF Wavelet
Spectrum
VLFn(wt)
Normalized Power of the VLF Wavelet
Spectrum
LF/HF(wt)
Autonomic Balance Exponent Power of
the Wavelet Spectrum
mHF(wt)
Mean High Frequency Wavelet Spectral
Power
mLF(wt)
Mean Low Frequency Wavelet Spectral
Power
mVLF(wt)
Mean Very Low Frequency Wavelet
Spectral Power
SDHF(wt)
Standard deviation of the HF(t) Wavelet
time series
SDLF(wt)
Standard deviation of the LF(t) Wavelet
time series
SDVLF(wt)
Standard deviation of the VLF(t) Wavelet
time series
EnHF(wt)
Shannon entropy of the HF(t) Wavelet
time series
EnLF(wt)
Shannon entropy of the LF(t) Wavelet
time series
EnVLF(wt)
Shannon entropy of the VLF(t) Wavelet
time series
Table 6 presents features of the (LF/HF)[t]
informational characteristics. (LF/HF)[t] is the
continuous function of the LF/HF ratio, obtained by
means of the wavelet analysis. Local dysfunctions of
this function represent relevant information of the
functional changes during the loads. The
effectiveness of such features was shown previously
in (Egorova et al., 2014).
Table 6: HRV wavelet dysfunctions features.
Feature
Description
(LF/HF)max
Maximal value of dysfunctions
(LF/HF)int
Intensity of dysfunctions
Nd
Number of dysfunctions
pNd
the number of dysfunctions divided by
the length of the (LF/HF)[t].
All 64 features for all 68 subjects have formed
single matrix of features X (matrix size 68x64). In
addition, the class matrix was created (matrix size
68x2): for relatively healthy volunteers the line in
matrix is (1,0); for patients suffering from arterial
hypertension is (0,1).
2.3 Artificial Neural Networks
The ANN learn a set of parameters that are adjusted
to the input data, while comparing the their prediction
with the output in the training phase. In current work,
several Multilayer Perceptrons (MLP) with different
number of hidden layers and neurons were
considered. The general view of the used neural
networks structure is presented on figure 1.
Figure 1: Neural networks schematic.
Neural networks were used as the classifier: based
on the input matrix X the network is expected to
define affiliation to either group of healthy volunteers
or patients suffering from arterial hypertension. Input
layer consists of 64 nodes – neurons. Each node
represents one of the considered heart rate variability
features. Prior to feeding the features to the network,
the feature vector was normalized to have a zero mean
value and uniform standard deviation (Sola and
Sevilla, 1997).
Output layer consisted of 2 neurons; one neuron is
responsible for defining affiliation to group of healthy
volunteers, second is responsible for defining
affiliation to the group of patients. Therefore, the
network is expected to give an answer (1,0) if the
subject belongs to the group of healthy volunteers,
and to give an answer (0,1) if the subject belongs to
the group of patients suffering from the arterial
hypertension. The number of neurons in the hidden
layers varied. Two types of neural networks were
analyzed: with one hidden layer, and with two hidden
layers. In addition number of neurons in each layer
varied from 1 to 64.
In order to define weights and biases the back
propagation method was used. The learning method
was set to be 0.1. As the stopping criteria the maximal
error level was used, which should not suppress 0.01.
Input Layer
Output Layer
Hidden Layers
1
2
NENT 2018 - Special Session on Neuro-electrostimulation in Neurorehabilitation Tasks
328
Maximal number of iterations was set to be 10000.
However, all networks configuration converged
prior. As the activation function the logistic function
was used. One of the features of this function is
relative easiness of prime evaluation (Demuth et al.,
2014; Hornik et al., 1989; Schmidhuber, 2015) .
In order to evaluate efficacy of the network
configuration, the leave-one-out cross-validation
(LOOCV) technique was used. LOOCV is the so-
called exhaustive cross-validation type which uses
one of the observations in the dataset as the test set,
while remaining data is used as the training set. This
procedure is repeated for all the observations in the
dataset (Refaeilzadeh et al., 2009). The total accuracy
(ACC) is evaluated as the number of correctly
predicted test set during whole LOOCV application.
Using the LOOCV approach allows one to prevent
overfitting on the training set while evaluating
classification efficacy on the external data.
3 RESULTS
In our previous works (Kublanov et al., 2017) we
have analyzed the following machine learning
classifiers – linear and quadratic discriminant
analysis (LDA and QDA); k-nearest neighbors (k-
NN), for k = 3,4,5; Decision Tree (DT) and Naïve
Bayes (NB). The table presents results of the
classification using all features for different
classifiers.
Table 7: Classifiers accuracy, %.
LDA
QDA
3-NN
4-NN
5-NN
DT
NB
66.2
58.8
75.0
72.1
75.0
73.5
66.2
Data in table show that application of all features
gives unsatisfactory results for all tested classifiers.
Therefore it is appropriate to search for way to
improve classification accuracy.
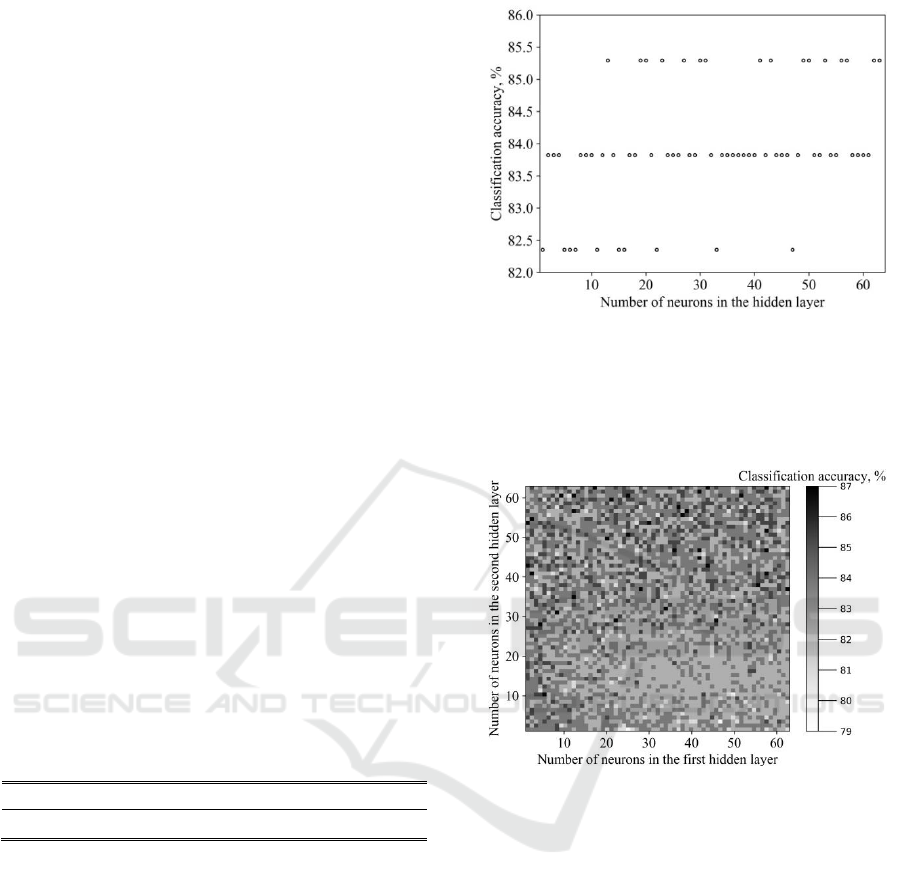
Firstly, the ANN classification accuracy was
evaluated for single hidden neuron configuration.
Results of the single layer configurations evaluation
accuracy are summarized on figure 2.
The minimal accuracy among all 64
configurations was 82.4; maximal – 85.3; average –
83.96. The maximal accuracy was achieved by 16
different configurations and includes (13, 19, 20, 23,
27, 30, 31, 41, 43, 49, 50, 53, 56, 57, 62, 63) neurons
in hidden layer. Overall the single hidden layer
configuration has consistent results.
Figure 2: Single hidden layer classification accuracy.
Then, the possibilities of the two hidden layers
configuration was evaluated. Results of the two layer
configurations evaluation accuracy are summarized
on figure 3.
Figure 3: Two hidden layer classification accuracy.
The minimal accuracy among all 4096
configurations was 79.4; maximal – 86.8; average –
83.26. The maximal accuracy was achieved by 38
different configurations.
It is worthy to point out that, all configurations,
studied in this work have shown result higher than
simple classifiers while using all features. Obtained
in this work accuracy is comparable with those
presented in (Pytel et al., 2015). However, in men-
tioned work, the anthropometric features were used.
This reduce application for the dynamic reaction
evaluation to the neuro-electrostimulation.
It is worthy to point out that the highest accura-cy,
when using only features in state F, was 72.1 %. This
furthermore highlights the importance of the tilt-test
in the arterial hypertension diagnosing.
However the overall accuracy can be still
improved. One of the possible solutions is prior
application of the efficient features selection.
Development of the Decision Support System in Treatment of Arterial Hypertension - Application of Artificial Neural Networks for
Evaluation of Heart Rate Variability Signals
329

4 DISCUSSIONS AND
CONCLUSIONS
The present works shows results of the artificial
neural networks application in task of the arterial
hypertension diagnostics. The distinctive feature of
the present work is application of the heart rate
variability signals data recorded during tilt-test study.
The vector of 64 time-domain, frequency-domain and
non-linear features was used. The results, obtained in
this work will become foundation of the decision
support system in treatment of arterial hypertension.
Results of this study showed, that application of
Artificial Neural Networks reaches higher
classification accuracy results than such machine
learning classifiers as discriminant analysis, Naïve
Bayes, Decision Tree, Nearest Neighbors. Relatively
high values of accuracy were obtained – 86.8. We
want to point out that this work was the first step in
the neural networks application study. In the
following we are interested in continuing more
complex networks that could perform prior features
selection for accuracy improvement. One of the
possible ways of the future development is usage of
different networks architectures, like auto-encoding,
for dimension reduction (Hinton and Salakhutdinov,
2006).
The next step in the development of the decision
support system in treatment of arterial hypertension is
evaluation of the treatment efficiency. We are
planning to evaluate efficiency of the standard
pharmacological therapy and neuro-
electrostimulation by the ‘SYMPATHOCOR-01’
device. Such study will allow to estimate possibility
of the proposed system application for evaluation of
the treatment efficiency and prognosis of the
treatment process.
ACKNOWLEDGEMENTS
The work was supported by Act 211 Government of
the Russian Federation, contract № 02.A03.21.0006.
REFERENCES
Baevskiy, R.M., 2001. Аnaliz variabelnosti serdechnogo
ritma pri ispolzovanii razlichnykh
ehlektrokardiograficheskikh sistem (metodicheskie
rekomendatsii) [Analysis of heart rate variability using
different electrocardiographic systems (guidelines)].
Vestn. Aritmologii Her. Arhythmology 65–87.
Belova, N.Y., Mihaylov, S.V., Piryova, B.G., 2007.
Wavelet transform: A better approach for the evaluation
of instantaneous changes in heart rate variability.
Auton. Neurosci. 131, 107–122.
Chattipakorn, N., Incharoen, T., Kanlop, N., Chattipakorn,
S., 2007. Heart rate variability in myocardial infarction
and heart failure. Int. J. Cardiol. 120, 289–296.
De Boor, C.A., 1978. Practical Guide to Splines. Springer-
Verlag.
Demuth, H.B., Beale, M.H., De Jess, O., Hagan, M.T.,
2014. Neural network design. Martin Hagan.
Egorova, D.D., Kazakov, Y.E., Kublanov, V.S., 2014.
Principal Components Method for Heart Rate
Variability Analysis. Biomed. Eng. 48, 37–41.
Feng, X.L., Pang, M., Beard, J., 2014. Health system
strengthening and hypertension awareness, treatment
and control: Data from the China health and retirement
longitudinal study. Bull. World Health Organ. 92, 29–
41.
Hinton, G.E., Salakhutdinov, R.R., 2006. Reducing the
dimensionality of data with neural networks. science
313, 504–507.
Hornik, K., Stinchcombe, M., White, H., 1989. Multilayer
feedforward networks are universal approximators.
Neural Netw. 2, 359–366.
Kleiger, R.E., Stein, P.K., Bigger, J.T., 2005. Heart rate
variability: measurement and clinical utility. Ann.
Noninvasive Electrocardiol. 10, 88–101.
Kseneva, S.I., Borodulina, E.V., Trifonova, O.Y., Udut,
V.V., 2016. Cardiac Autonomic Drive during Arterial
Hypertension and Metabolic Disturbances. Bull. Exp.
Biol. Med. 161, 237–240.
Kublanov, V.S., Dolganov, A.Y., Belo, D., Gamboa, H.,
2017. Comparison of Machine Learning Methods for
the Arterial Hypertension Diagnostics. Appl. Bionics
Biomech. 2017.
Kublanov, V.S., Shmirev, V.I., Shershever, A.S., Kazakov,
J.E., 2010. About Innovative Possibilities of Device
“SIMPATOCOR-01” in Management of Functional
Disorders of Vegetative and Central Nervous System in
Neurology, Kremljovskaya Medicine. Clin. Vestn. 4,
60–64.
Lee, C.K., Yoo, S.K., Park, Y., Kim, N., Jeong, K., Lee, B.,
2005. Using Neural Network to Recognize Human
Emotions from Heart Rate Variability and Skin
Resistance. In: 2005 IEEE Engineering in Medicine and
Biology 27th Annual Conference. Presented at the 2005
IEEE Engineering in Medicine and Biology 27th
Annual Conference, pp. 5523–5525.
Malik, M., 1996. Heart rate variability: Standards of
measurement, physiological interpretation, and clinical
use. Circulation 93, 1043–1065.
Mallat, S., 2009. A Wavelet Tour of Signal Processing, A
Wavelet Tour of Signal Processing.
Mancia, G., Fagard, R., Narkiewicz, K., Redon, J.,
Zanchetti, A., Böhm, M., Christiaens, T., Cifkova, R.,
Backer, G.D., Dominiczak, A., Galderisi, M., Grobbee,
D.E., Jaarsma, T., Kirchhof, P., Kjeldsen, S.E., Laurent,
S., Manolis, A.J., Nilsson, P.M., Ruilope, L.M.,
Schmieder, R.E., Sirnes, P.A., Sleight, P., Viigimaa,
NENT 2018 - Special Session on Neuro-electrostimulation in Neurorehabilitation Tasks
330

M., Waeber, B., Zannad, F., 2013. 2013 ESH/ESC
Guidelines for the management of arterial hypertension.
Eur. Heart J. 34, 2159–2219.
Mendis, S., Johnston, S.C., Fan, W., Oladapo, O., Cameron,
A., Faramawi, M.F., 2010. Cardiovascular risk
management and its impact on hypertension control in
primary care in low-resource settings: A cluster-
randomized trial. Bull. World Health Organ. 88, 412–
419.
Patel, M., Lal, S.K.L., Kavanagh, D., Rossiter, P., 2011.
Applying neural network analysis on heart rate
variability data to assess driver fatigue. Expert Syst.
Appl. 38, 7235–7242.
Pytel, K., Nawarycz, T., Ostrowska-Nawarycz, L., Drygas,
W., 2015. Anthropometric predictors and Artificial
Neural Networks in the diagnosis of hypertension. In:
2015 Federated Conference on Computer Science and
Information Systems (FedCSIS). Presented at the 2015
Federated Conference on Computer Science and
Information Systems (FedCSIS), pp. 287–290.
Rajendra Acharya, U., Subbanna Bhat, P., Iyengar, S.S.,
Rao, A., Dua, S., 2003. Classification of heart rate data
using artificial neural network and fuzzy equivalence
relation. Pattern Recognit. 36, 61–68.
Refaeilzadeh, P., Tang, L., Liu, H., 2009. Cross-validation.
In: Encyclopedia of Database Systems. Springer, pp.
532–538.
Schmidhuber, J., 2015. Deep learning in neural networks:
An overview. Neural Netw. 61, 85–117.
Sivanantham, A., Shenbaga Devi, S., 2014. Cardiac
arrhythmia detection using linear and non-linear
features of HRV signal. In: 2014 International
Conference on Advanced Communication Control and
Computing Technologies (ICACCCT). pp. 795–799.
Sola, J., Sevilla, J., 1997. Importance of input data
normalization for the application of neural networks to
complex industrial problems. IEEE Trans. Nucl. Sci.
44, 1464–1468.
Tarvainen, M.P., Niskanen, J.-P., Lipponen, J.A., Ranta-
Aho, P.O., Karjalainen, P.A., 2014. Kubios HRV–heart
rate variability analysis software. Comput. Methods
Programs Biomed. 113, 210–220.
Tkacz, E.J., Kostka, P., 2000. An application of wavelet
neural network for classification of patients with
coronary artery disease based on HRV analysis. In:
Proceedings of the 22nd Annual International
Conference of the IEEE Engineering in Medicine and
Biology Society (Cat. No.00CH37143). Presented at
the Proceedings of the 22nd Annual International
Conference of the IEEE Engineering in Medicine and
Biology Society (Cat. No.00CH37143), pp. 1391–1393
vol.2.
Ushakov, I.B., Orlov, O.I., Baevskii, R.M., Bersenev, E.Y.,
Chernikova, A.G., 2013. Conception of health: Space-
Earth. Hum. Physiol. 39, 115–118.
Yentes, J.M., Hunt, N., Schmid, K.K., Kaipust, J.P.,
McGrath, D., Stergiou, N., 2013. The Appropriate Use
of Approximate Entropy and Sample Entropy with
Short Data Sets. Ann. Biomed. Eng. 41, 349–365.
Zadeh, A.E., Khazaee, A., Ranaee, V., 2010. Classification
of the electrocardiogram signals using supervised
classifiers and efficient features. Comput. Methods
Programs Biomed. 99, 179–194.
Development of the Decision Support System in Treatment of Arterial Hypertension - Application of Artificial Neural Networks for
Evaluation of Heart Rate Variability Signals
331
