
Comparison of a Custom Functional Near-infrared Spectroscopy
Sensor, a Peripheral SpO2 Sensor, and a Standard Laboratory
Sensor (Biopac) for RR-Interval Assessment
Bethany K. Bracken
1
, Polemnia G. Amazeen
2
, Aaron D. Likens
2
, Mustafa Demir
2
and Cameron T. Gibbons
2
1
Charles River Analytics, 625 Mount Auburn St., Cambridge, MA 02138, U.S.A.
2
Department of Psychology, Arizona State University, P.O. Box 871104, Tempe, AZ 85287, U.S.A.
Keywords: Functional Near-infrared Spectroscopy (fNIRS), Cognitive Workload, Real-world Environment Sensors.
Abstract: Across many careers, individuals face alternating periods of high and low cognitive workload which can
impair cognitive function and undermine job performance. We have designed and are developing an
unobtrusive system to Monitor, Extract, and Decode Indicators of Cognitive Workload (MEDIC) in real-
world environments. With our partners at Biosignals Plux, we designed and manufactured a functional near-
infrared spectroscopy (fNIRS) device that measures brain blood oxygenation and cardiac information in a
form-factor that can be mounted on the inside of a baseball cap or headband. Because MEDIC is designed to
be used in realistic, sometimes high-motion environments, changes in blood oxygenation to the brain must be
put in context of current levels of physical activity without intruding on the activity of the user. Therefore, we
also developed a NIRS Armband device made up of a combination of Plux sensors including: SpO2 sensor to
measure cardiac information, a galvanic skin response sensor, a 6-axis accelerometer, and a non-contact skin
temperature sensor. Because these were custom sensors, we tested them against a standard laboratory sensor
(a Biopac RSPEC-R) while participants completed an obstacle course of cognitive and physical tasks.
1 INTRODUCTION
Across many careers, individuals face alternating
periods of high and low cognitive workload which
can impair cognitive function and undermine job
performance. We have designed and are developing
an unobtrusive system to Monitor, Extract, and
Decode Indicators of Cognitive Workload (MEDIC)
in real-world environments. With our partners at
Biosignals Plux, we designed and manufactured a
functional near-infrared spectroscopy (fNIRS) device
in a form-factor that can be mounted on the inside of
a baseball cap or headband. fNIRS is useful to detect
blood oxygenation changes associated with cognitive
states of interest, such as cognitive workload
(Tichauer, Hadway, Lee et al., 2005; Keller, Nadler,
Alkadhi et al., 2003). When cognitive workload
increases, there is a corresponding increase in
prefrontal blood oxygenation until the task becomes
too difficult, at which point blood oxygenation
decreases (Bunce, Izzetoglu, Ayaz et al., 2011; Ayaz,
Cakir, Izzetoglu et al., 2012; Ayaz, Shewokis, Bunce
et al., 2012). Because MEDIC is designed to be used
in realistic, sometimes high-motion environments,
changes in blood oxygenation to the brain must be put
in context of current levels of physical activity
without intruding on the activity of the user.
Therefore, we also developed a near infrared
spectroscopy (NIRS) Armband device that includes a
SpO2 sensor to measure cardiac information, a
galvanic skin response sensor, a 6-axis accelerometer,
and a non-contact skin temperature sensor. Because
these were custom sensors, we tested them against a
standard laboratory sensor – a Biopac RSPEC-R–
while participants completed an obstacle course of
cognitive and physical tasks.
2 METHODS
We first designed a forehead sensor device that
includes a custom fNIRS sensor and a three-axis
accelerometer designed to be integrated into a
baseball cap or headband, or standard issue gear such
Bracken, B., Amazeen, P., Likens, A., Demir, M. and Gibbons, C.
Comparison of a Custom Functional Near-infrared Spectroscopy Sensor, a Peripheral SpO2 Sensor, and a Standard Laboratory Sensor (Biopac) for RR-Interval Assessment.
DOI: 10.5220/0006728402810285
In Proceedings of the 11th International Joint Conference on Biomedical Engineering Systems and Technologies (BIOSTEC 2018) - Volume 4: BIOSIGNALS, pages 281-285
ISBN: 978-989-758-279-0
Copyright © 2018 by SCITEPRESS – Science and Technology Publications, Lda. All rights reserved
281
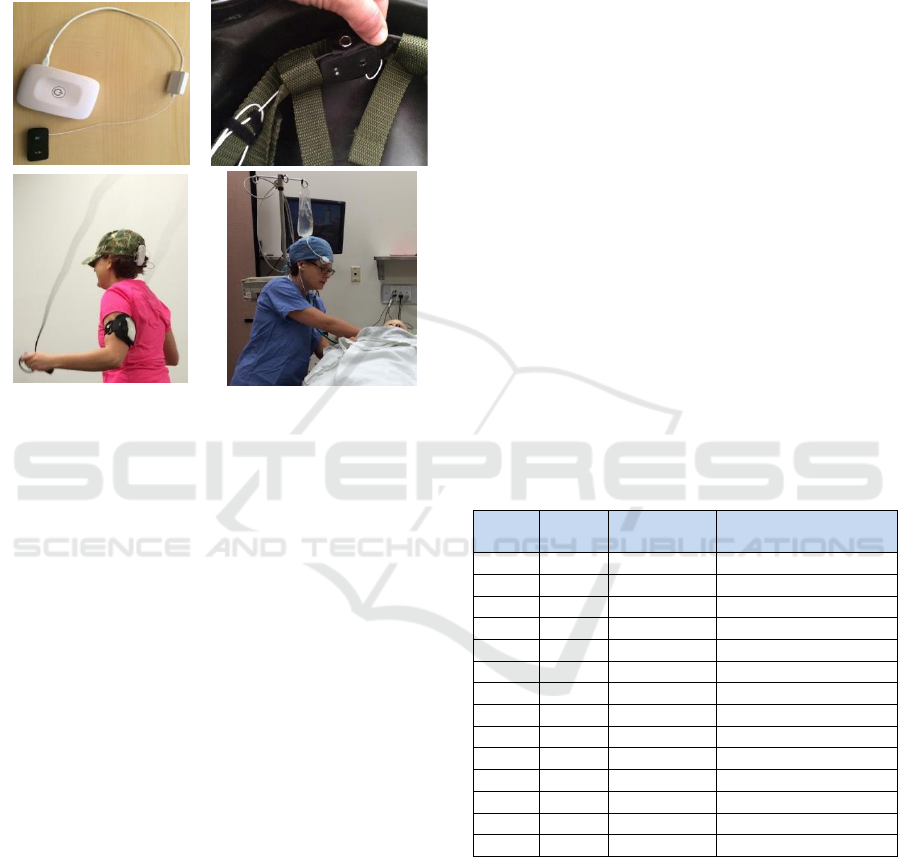
as a helmet or surgeon’s cap. This sensor is more
portable and less obtrusive than most commercially-
available sensors. alone (top left), mounted inside a
helmet (top right), being worn during a jump roping
task (bottom left), and being worn during a medical
training simulation (bottom right).
Figure 1: Custom fNIRS sensor alone (top left), mounted
inside a helmet (top right), worn during jump roping
(bottom left), and worn during a medical training
simulation (bottom right).
Participants wore Charles River Analytics/Plux
sensors and standard sensors (Biopac) while
completing well-validated cognitive tasks, physical
tasks, and combinations of cognitive and physical
tasks. This allowed us to assess the accuracy of
Charles River Analytics/Plux sensors (by comparing
them to Biopac data).
The evaluation of this sensor suite included 21
teams of three undergraduates completing physical
and cognitive challenges. (1) Baseline involved
sitting quietly. (2) Word list memorization (Miller,
1956) required participants to remember as many
words as possible. (3) Balance board required
participants to coordinate rolling a ball edge to edge
on a large, flat, weighted board without dropping it
for a specified amount of time. (4) For twenty
questions (Denney, 1987), participants asked yes-or-
no questions (up to 20) of the experimenter to identify
a pre-specified object. (5) For the puzzle task
(Shepard & Metzler, 1971; Guastello et al., 2014),
participants put together standard cardboard or plastic
puzzles of varying difficulty. (6) For hot potato,
participants each maintained balance on a BOSU ball
while passing weighted (medicine) balls from one
individual to the next. (7) For logic problems (Braine,
1990), individuals were given logic puzzles to solve
(e.g., http://www.brainbashers.com/logic.asp). (8)
For moving boxes (Amazeen, 2013), participants
lifted and moved boxes of variable weights and sizes
to construct a wall. (9) For jump rope, participants
jumped synchronously to complete a specified
number of consecutive jumps.
3 RESULTS
Sixty-three participants were recruited from Arizona
State University (ASU) and surrounding areas in
Mesa to participate in a study examining team
coordination. Informed consent was obtained prior to
the start of the experimental session. Each participant
received $20 upon completion of the experimental
session. The experimental protocol was approved by
ASUs Institutional Review Board and participants
were treated in accordance with the ethical guidelines
of the American Psychological Association.
Participants were grouped into three-member
teams, for a total of 21 teams. Data from seven teams
were removed from analysis due to logistical (e.g.,
incomplete teams) and technical (e.g., equipment
failure) difficulties. The following results comprise
data from the remaining 14 teams (see Table 1).
Table 1: Sample demographics. Mean (standard deviation).
Team
Male/
Female
Age (years)
Weekly Exercise
(hours)
3
1/2
26.7 (5.5)
4.7 (2.5)
4
3/0
24.0 (1.7)
5.7 (1.5)
5
2/1
23.3 (0.6)
5.3 (2.3)
6
2/1
24.3 (2.9)
4.2 (1.4)
7
3/0
21.7 (2.5)
6.0 (5.3)
9
3/0
24.3 (0.6)
6.7 (2.1)
10
2/1
27.7 (6.4)
9.0 (9.6)
12
3/0
23.7 (0.6)
5.3 (1.5)
13
3/0
23.7 (1.2)
1.3 (1.5)
14
2/1
25.3 (2.1)
7.7 (2.1)
17
2/1
22.3 (0.6)
8.3 (5.1)
18
2/1
25.3 (0.6)
4.8 (2.0)
19
3/0
26.3 (0.6)
4.7 (2.5)
21
2/1
22.3 (0.6)
8.8 (5.4)
Various physiological measures were collected
from each participant. Plux sensors were positioned
on the non-dominant arm (i.e., Armband) and
forehead (i.e., fNIRS Device) of each of the three
participants. A Biopac wireless ECG transmitter
(Biopac Systems Inc., Goleta, California, USA) was
used to collect electrocardiogram (ECG) data from
two of the three participants. Output from the Biopac
transmitter was transmitting in real time to a PC and
Real 2018 - Special Session on Assessing Human Cognitive State in Real-World Environments
282
recorded at 1000 Hz using AcqKnowledge software
(Biopac Systems Inc.). ECG signals were filtered and
down-sampled to 250 Hz for later calculation of RR
interval, the time (sec) between two consecutive QRS
complexes, using MATLAB (Mathworks, Inc.).
The experimental session consisted of one four-
minute baseline and nine two-minute cognitive and
physical tasks. Teams completed the baseline once, at
the beginning of the experimental session. They then
completed two repetitions of the coordination task
sequence. Experimental sessions lasted
approximately 75 minutes.
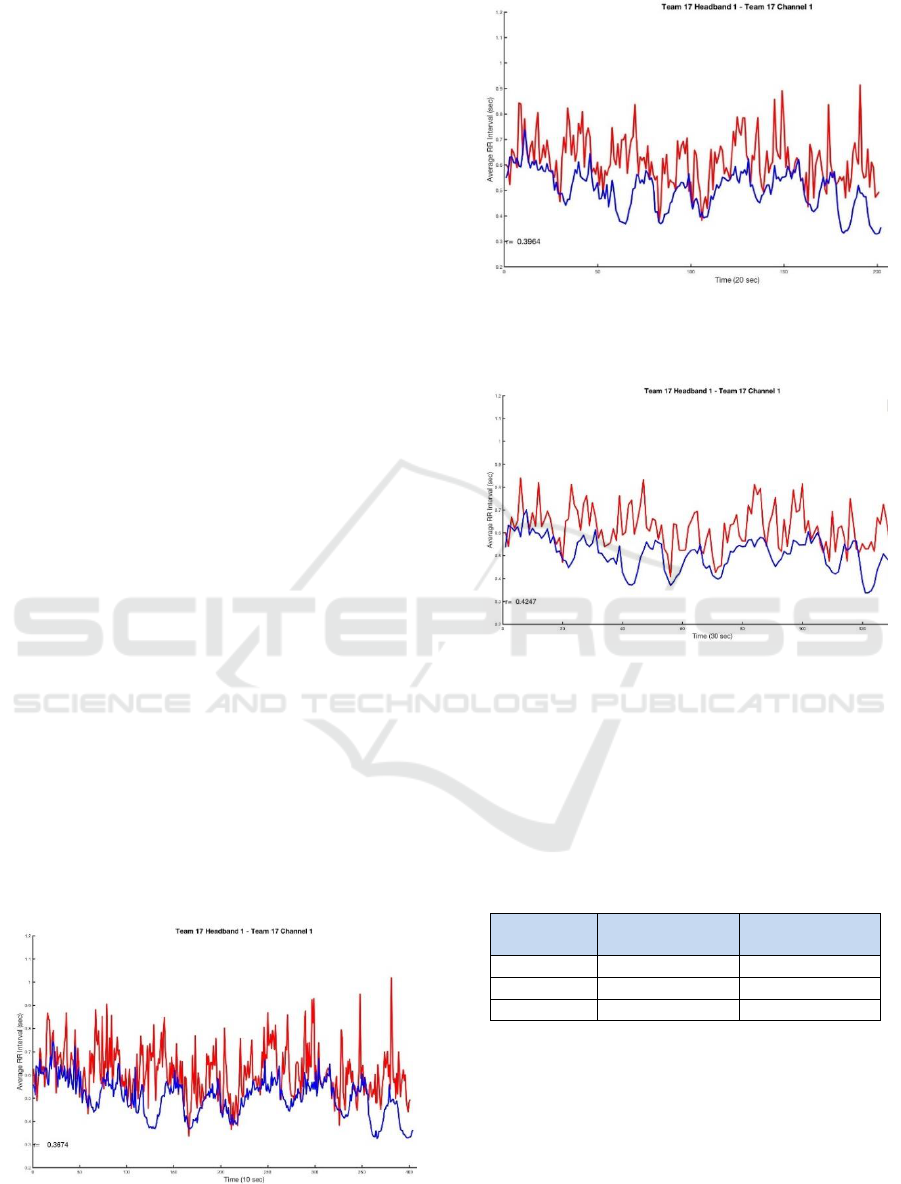
3.1 Signal Comparison
Figure 1, Figure 2, and Figure 3 depict the RR interval
time series from the Charles River Analytics/Plux
fNIRS device (red line) and Biopac transmitter (blue
line) for one participant over the entire experimental
session. Time series’ were smoothed using a 10-
(Figure 1), 20- (Figure 2), and 30-point (Figure 3)
moving average. Across all figures, the measured
heart beat was similar for both devices. Fluctuations
in RR interval can be seen as the participant’s heart
rate oscillates between physical (smaller RR
interval/higher heart rate) and non-physical tasks
(larger RR interval/lower heart rate). To determine
the relationship between the two time series (Charles
River Analytics/Plux fNIRS, Biopac), we computed
the cross-correlation (r) using the “crosscorr”
function in MATLAB. Correlations are depicted in
the bottom left region of each figure. Examination of
those correlations reveals stronger relationships
between the data sets for the 30 second window size.
This trend is also observed in Table 2. This suggests
that a 30 second window is sufficient to preserve and
enhance the dominant (slower) frequencies of the
participant’s RR interval_signal during physical and
non-physical tasks.
Figure 1: Charles River Analytics/Plux fNIRS device (red)
and Biopac (blue) RR interval averaged across 10s
windows.
Figure 2: Charles River Analytics/Plux fNIRS device (red)
and Biopac (blue) RR interval averaged across 20s
windows.
Figure 3: Charles River Analytics/Plux fNIRS device (red)
and Biopac (blue) RR interval averaged across 30s
windows.
Note that the correlations in Table 2 are small but
positive, indicating that the sensors are picking up on
similar information, but there is weak
correspondence.
Table 2: Cross-correlation (mean ± standard deviation) for
each window size.
Window Size
(sec)
Armband–
Biopac
fNIRS Device –
Biopac
10
0.188 ± 0.180
0.211 ± 0.196
20
0.206 ± 0.189
0.230 ± 0.211
30
0.228 ± 0.195
0.249 ± 0.227
Figure 4, Figure 5, and Figure 6 depict RR
interval data from the Armband (red line) and
corresponding Biopac transmitter (blue line) from the
same participant in Figure 1, Figure 2, and Figure 3.
For all figures, we constrained the RR interval scale
from 0 to 4 so that fluctuations in the Biopac signal
could still be seen. However, it should be noted that
RR intervals sometimes extended well past 4,
meaning that the time between heart beats was 4
Comparison of a Custom Functional Near-infrared Spectroscopy Sensor, a Peripheral SpO2 Sensor, and a Standard Laboratory Sensor
(Biopac) for RR-Interval Assessment
283
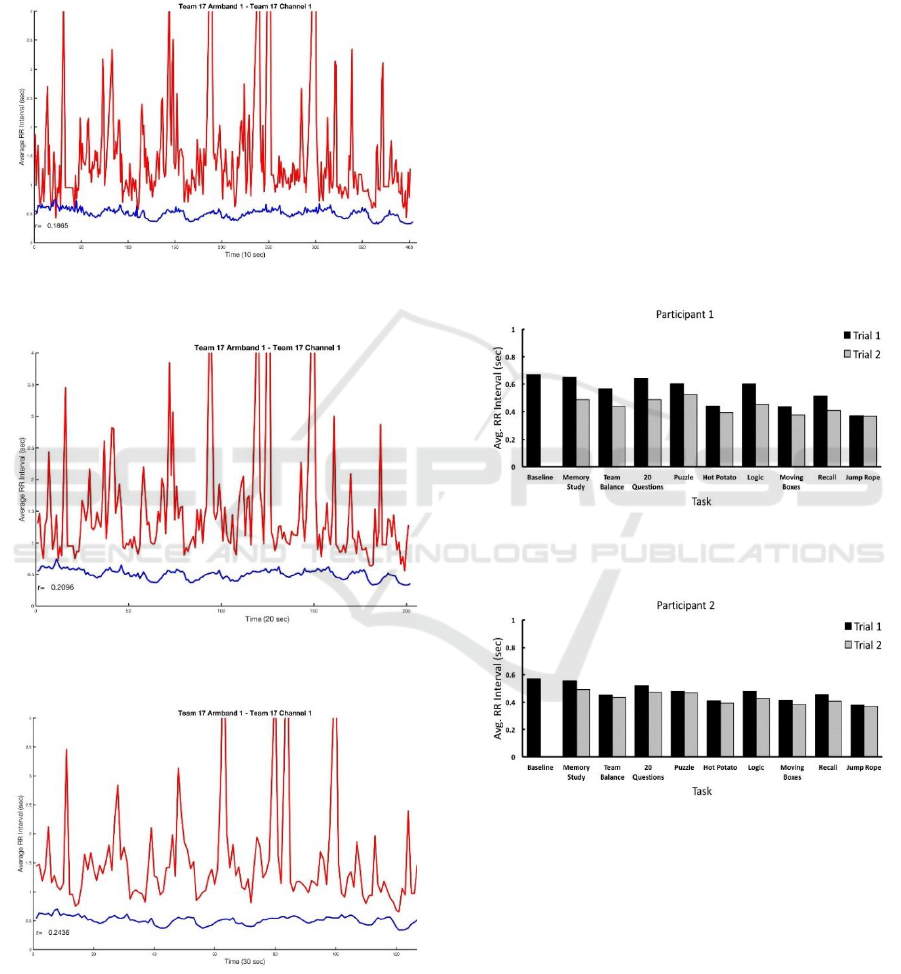
seconds. This is obviously unrealistic. This artifact
existed across three types of signals (Armband,
fNIRS Device, Biopac sensor) but was most
problematic with Armband data, as can be seen in
lower correlations for Armband and Biopac data than
fNIRS Device and Biopac data in Table 2.
Figure 4: Plux Armband and Biopac RR interval averaged
across 10 second windows.
Figure 5: Plux Armband and Biopac RR interval averaged
across 20 second windows.
Figure 6: Plux Armband and Biopac RR interval averaged
across 30 second windows.
3.2 Task Evaluation
To determine whether the tasks had an effect on heart
rate behaviour, we examined the average RR interval
during the performance of each task in Trials 1 and 2
separately. Figure 7 and Figure 8 depict the RR
intervals from Biopac for two participants in Teams
18 as a function of the task. As expected, participants
exhibited an increase in heart rate (indicated by a
lower RR interval) for the physically demanding tasks
(e.g., moving boxes) compared to the cognitive tasks
(e.g., puzzle). Because the sequence of the tasks
alternated between cognitive and physical tasks, we
can see the heart rate oscillate as a function of the task
demands. The same pattern was observed during trial
2, along with lower overall RR interval values (i.e.,
higher heart rate). Even though participants were
given time to rest in between trials, heart rate never
fully returned to Baseline.
Figure 7: Mean RR interval as a function of task in (black
bars) trial 1 and (grey bars) trial 2.
Figure 8: Mean RR interval as a function of task in (black
bars) trial 1 and (grey bars) trial 2.
The same pattern was observed across all teams,
as seen in the group averages of Figure 3.
Real 2018 - Special Session on Assessing Human Cognitive State in Real-World Environments
284

Figure 9: Mean RR interval as a function of task in (black
bars) trial 1 and (grey bars) trial 2 across all teams.
4 CONCLUSIONS
Participants wore Charles River Analytics/Plux
sensors and standard sensors (Biopac) while
completing well-validated cognitive tasks, physical
tasks, and combinations of cognitive and physical
tasks. This allowed us to assess the accuracy of
Charles River Analytics/Plux sensors (by comparing
them to Biopac data). The evaluation of this sensor
suite included 21 teams of three students completing
physical and cognitive challenges. Various
physiological measures were collected from each
participant.
The correlations in RR interval between the
fNIRS device, Armband device, and Biopac sensor
are small, but positive, indicating that the sensors are
picking up on similar information, but there is weak
correspondence.
The physical and cognitive tasks had very
different effects on heart rate. As expected, the ECG
signal was much more variable during the completion
of the physical tasks, including movement between
stations of the experiment. Occasionally, a sensor
might be sufficiently jostled, particularly in the rope
jumping task, or it might fall off. In those situations,
the signal became very noisy, which made the QRS
complex difficult to resolve. The consequence was
that the peak-picking algorithm might skip relevant
peaks in the signal and estimate an inflated RR
interval (e.g. RR interval>2 sec).
ACKNOWLEDGEMENTS
This material is based upon work supported by the
United States Army Medical Research and Materiel
Command under Contract No. W81XWH-14-C-
0018. Any opinions, findings and conclusions or
recommendations expressed in this material are those
of the author(s) and do not necessarily reflect the
views of the United States Army Medical Research
and Materiel Command. In the conduct of research
where humans are the participants, the investigators
adhered to the policies regarding the protection of
human participants as prescribed by Code of Federal
Regulations (CFR) Title 45, Volume 1, Part 46; Title
32, Chapter 1, Part 219; and Title 21, Chapter 1, Part
50 (Protection of Human Participants).
REFERENCES
Amazeen, E. L. (2013). Box Shape Influences the Size-
Weight Illusion During Individual and Team Lifting.
Human Factors: The Journal of the Human Factors
and Ergonomics Society, 0018720813497980.
Ayaz, H., Cakir, M. P., Izzetoglu, K., Curtin, A., Shewokis,
P. A., Bunce, S. C., and Onaral, B. (2012). Monitoring
expertise development during simulated UAV piloting
tasks using optical brain imaging. Aerospace
Conference, 2012 IEEE, 1-11.
Ayaz, H., Shewokis, P. A., Bunce, S., Izzetoglu, K.,
Willems, B., and Onaral, B. (2012). Optical brain
monitoring for operator training and mental workload
assessment. Neuroimage, 59, 36-47.
Bunce, S. C., Izzetoglu, K., Ayaz, H., Shewokis, P.,
Izzetoglu, M., Pourrezaei, K., and Onaral, B. (2011).
Implementation of fNIRS for monitoring levels of
expertise and mental workload.: Springer.
Braine, M. D. (1990). The “natural logic” approach to
reasoning. Reasoning, necessity, and logic:
Developmental perspectives, 133-157.
Denney, N. W. (1985). A review of life span research with
the twenty questions task: A study of problem-solving
ability. The International Journal of Aging and Human
Development, 21, 161-173.
Guastello, S. J., Malon, M., Timm, P., Weinberger, K.,
Gorin, H., Fabisch, M., & Poston, K. (2014).
Catastrophe models for cognitive workload and fatigue
in a vigilance dual task. Human factors, 56(4), 737-
751.
Keller, E., Nadler, A., Alkadhi, H., Kollias, S. S.,
Yonekawa, Y., & Niederer, P. (2003). Noninvasive
measurement of regional cerebral blood flow and
regional cerebral blood volume by near-infrared
spectroscopy and indocyanine green dye
dilution. Neuroimage, 20(2), 828-839.
Miller, G. (1956). The magical number seven, plus or minus
two: Some limits on our capacity for processing
information. Psychological Review, 63, 81-97.
Shepard, R. N. and Metzler, J. (1971). Mental rotation of
three-dimensional objects.
Tichauer, K. M., Hadway, J., Lee, T. Y., & Lawrence, K. S.
(2005). Near-infrared spectroscopy measurement of
cerebral oxidative metabolism: a validation
study. Journal of Cerebral Blood Flow &
Metabolism, 25(1_suppl), S88-S88.
Comparison of a Custom Functional Near-infrared Spectroscopy Sensor, a Peripheral SpO2 Sensor, and a Standard Laboratory Sensor
(Biopac) for RR-Interval Assessment
285
