
Feature-based Analysis of Gait Signals for Biometric Recognition
Automatic Extraction and Selection of Features from Accelerometer Signals
Maria De Marsico, Eduard Gabriel Fartade and Alessio Mecca
Department of Computer Science, Sapienza University of Rome, Via Salaria 113, Rome, Italy
Keywords:
Biometric Authentication, Gait Recognition, Automatic Feature Extraction.
Abstract:
Gait recognition has been traditionally tackled by computer vision techniques. As a matter of fact, this is a still
very active research field. More recently, the spreading use of smart mobile devices with embedded sensors
has also spurred the interest of the research community for alternative methods based on the gait dynamics
captured by those sensors. In particular, signals from the accelerometer seem to be the most suited for rec-
ognizing the identity of the subject carrying the mobile device. Different approaches have been investigated
to achieve a sufficient recognition ability. This paper proposes an automatic extraction of the most relevant
features computed from the three raw accelerometer signals (one for each axis). It also presents the results
of comparing this approach with a plain Dynamic Time Warping (DTW) matching. The latter is computa-
tionally more demanding, and this is to take into account when considering the resources of a mobile device.
Moreover, though being a kind of basic approach, it is still used in literature due to the possibility to easily
implement it even directly on mobile platforms, which are the new frontier of biometric recognition.
1 INTRODUCTION
Biometric traits are traditionally classified into phys-
ical and behavioral, and further denoted as strong
and soft, mainly according to uniqueness and perma-
nence. Strong traits mainly belong to the physical
group, and the soft ones in this group generally iden-
tify classes of users instead of individuals (e.g., hair
color, height, face shape, etc.). Almost all behavioral
traits rather belong to the soft category, due to lack
of sufficient permanence over the long period. This
is because they can be affected by mood and speed of
action execution, and in some cases by temporary im-
pairment of the body part involved. Even if soft traits
are not accurate and permanent as the strong ones,
their analysis can be fused to enforce recognition ac-
curacy. Behavioral traits have also the advantage to
be more difficult to forge and replicate.
Gait recognition can be considered to belong to
the behavioural biometrics, even if, especially in re-
lation with computer vision-based approaches, it also
presents some physical/visual characteristics. While
this kind of approaches has been the first one adopted
for recognition, the problem has recently gained new
interest thanks to the new researches based on new
wearable sensors or wider availability of existing
ones. This paper focuses on Wearable Sensors-based
techniques, exploiting sensors built in modern smart-
phones. In particular, the techniques proposed in this
paper carry out recognition by the signals captured by
the embedded 3-axes accelerometers.
Like other traits, gait recognition suffers from
both intra-personal variations, either intrinsic or ex-
trinsic to the walking person, and inter-personal sim-
ilarities, possibly causing a subject to be confused
with another. Variations of the walking pattern from
the same individual mainly depend on speed, ground
slope, kind of worn shoes (e.g., heels for women
shoes, or heavy boats), and also on some temporary
(if not permanent) illness, such as contusions or other
problems affecting legs, articulations or feet. In addi-
tion to those factors, image-based techniques applied
to video sequences, can be further affected by vary-
ing illumination, occlusion, pose, perspective with re-
spect to the camera, and large clothes. Finally, a com-
mon problem, though producing different effects ac-
cording to the adopted sensors, is the presence of car-
ried objects, that modify the silhouette, generally ex-
ploited by computer vision approaches, as well as the
walking dynamics, especially if heavy. A further dis-
advantage of computer vision-based approaches is the
impossibility to carry out verification of the walker di-
rectly on a personal device, since videos are necessar-
ily captured by an external device.
630
Marsico, M., Fartade, E. and Mecca, A.
Feature-based Analysis of Gait Signals for Biometric Recognition - Automatic Extraction and Selection of Features from Accelerometer Signals.
DOI: 10.5220/0006719106300637
In Proceedings of the 7th International Conference on Pattern Recognition Applications and Methods (ICPRAM 2018), pages 630-637
ISBN: 978-989-758-276-9
Copyright © 2018 by SCITEPRESS – Science and Technology Publications, Lda. All rights reserved

Notwithstanding the above limitations, it is quite
difficult to copy or forge the gait pattern produced
by someone else. In addition, while gait recognition
can operate at a distance (even 10 meters or more)
with computer vision applications, there is not even
this limitation with wearable sensors, since they are
directly attached to the user body. Moreover, while
video capture can mingle silhouettes of different sub-
jects in the same frames, depending on the point of
view and relative positions of these subjects, signals
captured by wearable sensors are by definition iso-
lated and independent from each other. Last but not
least, in both cases the user is not asked to do any
specific action but walk, and gait recognition can be
effectively combined with other ”strong” biometrics
to both enforce recognition accuracy and as an anti-
spoofing support.
The aim of this paper is to report the results of
investigations regarding the possibility to reduce the
computational time for matching with respect to pure
Dynamic Time Warping (DTW) that is still quite used
in literature. In particular, a feature extraction, anal-
ysis and selection procedure is devised in order to
achieve a faster yet still accurate recognition. The
added value of this approach is the possibility to pro-
cess the gait signal directly on a low-medium level
smartphone without need of sending data to an ex-
ternal server. Of course, this holds for the verifi-
cation of the owner identity (1:1 identity matching),
which is implicitly assumed to be the person carry-
ing the device. As for identification (1:N identity
matching), privacy as well as security considerations
would not allow anyway maintaining templates from
other users (gallery) in one’s own device and process-
ing them locally. Experimental setup exploits one of
the largest available wearable sensor-based datasets,
in order to provide a common benchmark for com-
parison with other works. Unfortunately, at present
this is not always possible due to in-house and often
private datasets used in several papers.
The paper continues as follows. Section 2 pro-
vides a summary of present research lines in this field.
Section 3 describes the paper proposal, entailing the
process of signal capture followed by feature extrac-
tion, analysis and selection. Section 4 presents the
results from experiments carried out, and some com-
parison with raw signal matching. Finally, Section 5
draws some conclusions and sketches future work.
2 RELATED WORK
It is worth anticipating that most works in litera-
ture, addressing wearable sensor-based gait recogni-
tion, locate the acquisition device in different body
locations, and use different (often in-house) datasets
with a different number of subjects, so that a fair
comparison is not always feasible. Moreover, most
works only consider verification modality (1:1 iden-
tity matching with either implicit or explicit identity
claim), a few ones also consider closed set identifi-
cation modality (1:N identity matching with no iden-
tity claim but the assumption that all probes belong to
enrolled users), and almost none considers open set
identification modality (1:N identity matching with
no identity claim and reject option). This is related
to the main intended use of this kind of biometrics,
devised to authenticate the owner of a mobile device
against a stored template. However, it is worth con-
sidering that the possibility to automatically trigger
signal capture by Bluetooth devices, and to transmit
the captured signal to a remote server, allows hypoth-
esizing a wider use of this biometrics for access con-
trol to restricted areas by user identification.
As for wearable sensor-based recognition, it is
possible to identify two main categories of ap-
proaches.
The attempts in the first group generally try to
match the template/templates of the users by sig-
nal matching techniques, such as Euclidean Distance
(ED), Dynamic Time Warping (DTW), or Histogram
Similarity (HS). These kinds of techniques, if applied
to match the entire signals, generally provide quite
good results. However, they drastically lose accu-
racy when the templates significantly differ in terms
of number of samples. For this reason, some works in
this group use the adopted matching strategies after
dividing the signals into steps/cycles. This generally
entails a segmentation procedure that tries to automat-
ically identify the start and stop of a step/cycle in the
walk signal, where step is intended as a single foot
step, while cycle is intended as a pair of them (left-
right or right-left). In these cases, it is worth noticing
that the quality of the results of this operation have
an high impact on the recognition accuracy, and de-
veloping a good segmentation algorithm is a crucial
point.
In (Gafurov et al., 2010), the authors show the im-
pact of different kinds of shoes in the recognition,
using a in-house dataset of 30 persons. The pro-
posed method uses a fixed threshold to identify cycles
and then normalizes their sample length. Recogni-
tion entails measuring ED between all pairs of cycles,
composed of one cycle extracted from a gallery sam-
ple and one cycle from the probe to match; the best
achieved distance has to meet the fixed threshold for
the acceptance. Results are in terms of Equal Error
Rate (EER), the value where False Acceptance Rate
Feature-based Analysis of Gait Signals for Biometric Recognition - Automatic Extraction and Selection of Features from Accelerometer
Signals
631

is equal to False Rejection Rate, therefore the lower,
the better. Values range from 1.6% with the lighter
shoes to 5% with the heavier ones.
The work presented in (Gafurov et al., 2006) pro-
poses two different approaches for gait recognition,
tested on a in-house dataset of 21 users with only one
single walk each, further divided into two parts. This
causes a lack of most intraclass variation factors, and
therefore the dataset hardly represents a realistic sce-
nario. In real life settings, even the position of the
sensors cannot be completely controlled and is not
identical, and this fact in itself can produce variations
in the captured signal. For both proposed methods,
the 3-dimensional raw signals from the accelerometer
are combined into a single 1-dimensional vector using
the following ad hoc formula: v
i
= arcsin(
z
i
√
x
2
i
+y
2
i
+z
2
i
)
where i represents the index of the sample within the
signal. The first matching strategy exploits HS. To
this aim, the obtained values are stored in a histogram
representing the derived biometric template. Match-
ing between the obtained histograms achieves a 5% of
EER. The second attempt uses the 1D vector for cycle
comparison and achieves a 9% of EER.
In (De Marsico and Mecca, 2016), the authors
present a novel step segmentation procedure and show
the performance of five different algorithms based on
DTW, one dealing with the entire signal and the oth-
ers using different strategies to match the detected
steps. In this case no fixed threshold is used for seg-
mentation. The algorithm exploiting the entire signal
achieves 92.8% of Recognition Rate (RR) in closed
set identification modality and 9.26% of EER in ver-
ification modality; the algorithms exploiting the step
segmentation procedure achieve up to 82.7% of RR
and up to 10.3% of EER. It is to underline that results
in this latter work are obtained over a very large pub-
lic dataset including 175 subjects with 12 walks each
(Zhang et al., 2015).
The approaches in the second group, instead, try
to exploit machine learning algorithms/classifiers in
order to get the correct match between templates.
These proposals generally work only in verification
modality, training a classifier for each subject. A com-
mon pre-processing step is to fragment the signal in
chunks with a fixed length (in terms of either time or
number of samples, with or without overlap) in order
to extract more data for the training phase. Of course,
these approaches do not require any step/cycle seg-
mentation procedure. After the training of the clas-
sifier, that can occur on a more powerful device, the
trained system can be executed directly on a smart-
phone due to the low computational cost of the sin-
gle recognition operation. In fact, several works in
this category are generally designed to be executed di-
rectly on the mobile device in order to unlock it only
for its owner, as an alternative to pins or passwords.
Two solutions in this category are presented in
(Nickel et al., 2011b) and in (Nickel et al., 2011a).
Both works exploit the same dataset, collected by a
Google G1 phone. Such dataset contains walk signals
from 48 subjects, 4 walks each. In the first work, sig-
nals are re-sampled to 200Hz. Afterwards, they are
divided into fragments of 3 seconds with no overlap.
Fragments are then grouped into two sets, one for the
training and the other one for testing. The recognition
is carried out by the HVITE tool and each subject is
used one time as genuine and forty-seven times as im-
postor. This strategy reports an EER of about 10%.
In the second work, the walking signals are inter-
polated to 100Hz and then are fragmented into chunks
of 7 seconds with an overlap of 50%. Each fragment
is used as feature vector, adding some extra statistical
parameters, and the Mel and the Bark frequency cep-
stral coefficients. Training and recognition are car-
ried out exploiting the SVM classifier. This approach
achieves a 5.9% of False Match Rate (FMR) with
6.3% of False Non Match Rate (FNMR).
In (Nickel et al., 2012), the authors try to exploit
the k-NN algorithm for recognition. Walking data are
collected during two sessions. Each of the 36 users
is asked to walk 12 times at normal pace, 16 times
at fast pace and again other 12 times at normal pace
on a flat hallway. Each such group of walk signals is
captured by a single recording operation. Single sig-
nals are divided using an automatic procedure accord-
ing to some stop periods decided in advance, and the
result is eventually manually corrected. All signals
are then interpolated at 127Hz (this value is empiri-
cally chosen). After this preprocessing, the interpo-
lated signals are fragmented. This work exploits three
different fragment sizes, namely 3s, 5s, and 7.5s. In
all three cases, the fragments have an overlap of 50%.
The feature vectors are then created using some sta-
tistical parameters and by Mel and Berk coefficients.
The recognition exploits the implementation of k-NN
algorithm included in the WEKA library. The work
reports a FMR of about 4% with a very high FNMR
of about 22-23%, resulting in a Half-Total Error Rate
(HTER - the average of the two) of about 13%. In or-
der to improve performances, the authors try a voting
approach using different fragments of the same sub-
ject; this significantly reduces the FNMR while in-
creasing minimally the FMR, so achieving an HTER
of about 8.5%.
The proposal in (Zhang et al., 2015) presents a
large dataset of 175 subjects with 12 walks per per-
son (the same used as benchmark by our proposal)
and tests the extraction and the use of signature points
ICPRAM 2018 - 7th International Conference on Pattern Recognition Applications and Methods
632

(SP). SPs are described as the fiducial positions within
gait signals that should be both stable for the same
person and distinctive for different persons. The au-
thors propose to sparsely represent the SPs and then
to create clusters, labelling them to make up a dictio-
nary in a linear combination, in order to have a subject
for each cluster. Recognition is described as a con-
ditional probability problem solved by a sparse-code
classifier. The result reaches an up to 95.8% of RR in
closed set modality, and up to 2.2% of EER in verifi-
cation modality. In this case, it is worth considering
that the authors use 5 accelerometers of the same kind
positioned in different body locations.
3 AUTOMATIC FEATURE
EXTRACTION AND TEST
SCENARIOS
3.1 Extracted Features
Notwithstanding the variety of solutions proposed in
literature, DTW still plays a relevant role for wearable
sensor-based gait recognition. Problems to address
are related to the possible different length of walk sig-
nals, and to noisy acquisition. Moreover, computa-
tional complexity is not negligible when considering
mobile processing. This work investigates the possi-
ble application of Machine Learning procedures in or-
der to extract aggregate features from the signals, and
to select the most relevant ones. The aim is twofold:
from one side, to discard less robust or less informa-
tive features, i.e., those more subject to distortions, or
that present quite flat values across signals; from the
other side, achieving the goal of a lighter though ac-
curate recognition procedure would be better suited to
mobile settings.
In order to evaluate the possible influence of spe-
cific feature selection choices, 4 different scenarios
have been configured, with different characteristics
regarding both the use of training information and the
way to exploit such information.
In all the test scenarios considered for the exper-
iments presented below, the same Python libraries
have been used for feature extraction and analysis.
Tsfresh
1
library is used to automatically extract a
large number of features from temporal series. It
is usually exploited together with Pandas
2
for data
analysis, and with Scikit-learn
3
library for Machine
1
https://tsfresh.readthedocs.io/en/latest/index.html
2
http://pandas.pydata.org/index.html
3
http://scikit-learn.org/stable/
Learning. The extracted features can be later ex-
ploited to create regression or classification models,
and to cluster or match time series.
Tsfresh includes library functions to extract a
huge number of features (222) from a time series. Of
course not all of them were taken into account for our
experiments. Some examples follow, but it is not pos-
sible to provide the complete list of them.
• abs energy: returns the absolute energy of the
time series: E =
∑
n
i=1
x
2
i
with n=number of
points in the time series
• absolute sum of change: returns the sum of ab-
solute values of subsequent variations in the se-
ries: E =
∑
n
i=1
|x
i+1
−x
i
|
• approximate entropy: returns the approximate
entropy of the signal
• ar coefficient: returns the coefficient of the Auto
Regressive (AR) process for a given configuration
passed as parameter
• augmented dickey fuller: returns the result of
Dickey-Fuller test
• autocorrelation: returns autocorrelation given a
certain lag
• count above mean: returns the number of values
in the time series higher than its mean
• count below mean: returns the number of values
in the time series lower than its mean
• cwt coefficients: computes the wavelet transform
using this formula
2
√
3aπ
1
4
(1 −
x
2
a
2
)exp(−
x
2
2a
2
))
• fft coefficient: computes the Fourier coefficients
applying Fourier Tranform
• mean: returns the mean of the signal
• mean abs change: returns the mean of absolute
values of consecutive changes in the time series
∑
n−1
i=1
|x
i+1
−x
i
|
• standard deviation: returns standard deviation
• variance: returns the variance
• median: returns the median value
• skewness: returns the skewness (computed with
the Fisher-Person standardized coefficient)
• kurtosis: returns the kurtosis (computed with the
Fisher-Person standardized coefficient)
It is worth noticing that features are separately
extracted from the signals produced by the three ac-
celerometer axes, and the difference between test sce-
narios also regards the way to take their possible cor-
relation into account.
Feature-based Analysis of Gait Signals for Biometric Recognition - Automatic Extraction and Selection of Features from Accelerometer
Signals
633

3.2 Test Scenarios and Feature Selection
This work analyzes 4 different test scenarios. Test
Scenario 1 (T1) does not use any training phase, while
the others do. Considering the different domains and
scale values of extracted features, a standardization
procedure is exploited to build homogeneous vec-
tors, using the well-known Gaussian normalization
formula. For each feature, the average µ and the stan-
dard deviation σ are computed over gallery templates
and then, for each value x, the resulting standardized
value z is obtained by the formula:
z =
(x −µ)
σ
(1)
The µ and σ values are then stored, in order to normal-
ize the further incoming probes used for testing with
the same gallery. The galleries that are used in turn
for the experiments each contain a number of tem-
plates (more than 450) that allows considering these
parameters stable enough to avoid recomputing them
for each probe. All test scenarios entail recognition in
multiple instance verification modality: each subject
has more than one template, all of them are matched
against the incoming probe, and the best match among
the gallery and the probe is returned as verification
result. A probe set vs. gallery set distance matrix is
produced in order to evaluate the performances. For
each scenario, distances are computed between pairs
of vectors built according to the scenario setting. Ex-
periments are carried out using both Manhattan and
Euclidean Distance as alternative metrics.
3.2.1 Test Scenario 1 (T1)
In T1, all feature extracted by Tsfresh tool are ex-
ploited. For each axes, all 222 feature are taken into
account, for a total of 666 features in the template
vector. This scenario allowed to have a baseline per-
formance. In order to get a fair comparison with the
other scenarios, the templates from samples in the
training set are not used during testing.
3.2.2 Test Scenario 2 (T2)
The strategy adopted in T2 aims at selecting and keep-
ing only the most relevant features. For each axis,
only the features that have a probability of at least
80% of changing across vectors are taken into ac-
count. In other words, only features presenting the
highest variance are maintained. This analysis is car-
ried out by Scikit-learn library. The next selection
step entails a further pruning, that discards features
that do not present this property for all axes, i.e., those
that are informative enough but only for a subset of
axes. This provides a total of 55 feature per axis,
summing up to 165 features. This feature selection
is carried out in the training phase, so that in testing
only the identified features are taken into account for
both gallery and probe sets.
3.2.3 Test Scenario 3 (T3)
In T3 the same first step of variance-based pruning is
performed as in T2. As a second step of feature se-
lection, the complement of the features identified in
T2 is maintained. After discarding features that show
a too high homogeneity of values across the training
set, only the features that are relevant for a strict sub-
set of axes (1 or 2) are maintained. In this case, this
sums up to 24 features, 9 from the x axis, 10 from the
y axis, and 5 from z axis. Even in this case, selection
is carried out during training, and the features identi-
fied are then extracted from gallery and probe in the
testing step.
3.2.4 Test Scenario 4 (T4)
T4 uses a totally different approach for feature selec-
tion. In this case the choice of features to be kept
is based on the Principal Feature Analysis (PFA)(Lu
et al., 2007). It uses the same principles of the well-
known Principal Component Analysis (PCA), also
exploited, e.g., in face recognition for feature space
reduction. The same PCA criteria are applied to se-
lect a subset of dimension q of the most representa-
tive features from the complete original set. During
training, the best results are obtained with q=60 and
q=62.
Figure 1: Body locations available from ZJU-gaitacc
dataset. The red circle (pelvis zone), is the one exploited
to get the experimental results.
ICPRAM 2018 - 7th International Conference on Pattern Recognition Applications and Methods
634

Table 1: Results in term of EER for the 4 test scenarios.
TEST
EUCLIDEAN
DISTANCE
MANHATTAN
DISTANCE
T1 24.6% 22.4%
T2 22.5% 20.2%
T3 31.5% 30.6%
T4 19.6% 18.7%
4 EXPERIMENTAL RESULTS
4.1 Dataset
The dataset exploited for the experiments of this work
is the one proposed in (Zhang et al., 2015), named
ZJU-gaitacc. It collects walk signals from 175 sub-
jects, out of which only the 153 selected for this work
have 12 walks each, equally divided into two ses-
sions, with data captured from 5 different body loca-
tions: upper arm, pelvis, wrist, thigh, ankle. In order
to maintain consistency with real life use and possi-
ble positioning of smartphones, only the subset cap-
tured from pelvis has been used. Furthermore, this
accelerometer positioning provides the best results. It
is worth noticing that the proposal of this paper ad-
dresses the use of smartphones for gait authentication,
and that embedded accelerometers presently achieve
a higher signal resolution. However, this dataset is
the best one viable for a fair comparison of meth-
ods. It presents the best characteristics in terms of
both number and length of samples, and also provides
data from two different sessions, so allowing to take
into account time-related variability too.
The dataset has been divided into training and test-
ing sets. The training set contains the first 3 walks
of each session, while the testing set contains the re-
maining ones. As for probe and gallery partition of
the testing set, in order to get more results, the walks
from the first and from the second session has been
used in turn as either probe or gallery. The obtained
results have been averaged to produce the final perfor-
mance measures. Figure 1 shows the body locations
available from the dataset, and the red circle indicates
the one used in this work.
4.2 Results and Discussion
The system has been tested in multiple instance ver-
ification modality (the best matching between the in-
coming probe and the gallery of the claimed iden-
tity is returned). Performances are reported in terms
of Equal Error Rate (EER). T1 achieves EER=24.6%
with Euclidean Distance (ED) and a slightly bet-
ter EER= 22.6% with Manhattan Distance (MD). T2
shows an improvement, achieving EER=22.5% with
ED and EER=20.2% with MD. This seems to demon-
strate that selecting the features that provide the high-
est information for all axes improves recognition per-
formance. On the contrary, T3 achieves worse per-
formance than T1, namely EER=31.5% with ED and
EER=30.6% with MD. This is probably due to the
too low number of features (24) and possibly to the
uneven distribution across axes. T4 achieves the
best results, represented by EER=19.6% with ED and
EER=18.7% with MD. Overall, the best results are
always obtained by MD, independently from the test
scenario. The performance of PFA demonstrates that
reduction techniques exploiting data correlation are
effective with this kind of temporal series, obtaining
an improvement of about 7% over T2. This is not dra-
matically significant, but encourages continuing in-
vestigating along this line. Table 1 summarizes the
obtained results. Figure 2 plots the EER trend of test
scenarios. Figure 3 shows FAR and FRR curves for
all scenarios with both exploited metrics.
It is interesting to make a comparison with re-
sults reported in (De Marsico and Mecca, 2016), ob-
tained on the same dataset using pure DTW for the
same multiple instance verification modality. On
one hand, the algorithm matching the whole signal
(EER=9.2%), as well as the best of those exploiting
step segmentation (EER=10.25%), got better results
than the approaches presented here. These two al-
gorithms are the slowest and most computational de-
manding in (De Marsico and Mecca, 2016). More-
over, the first one requires signals to be not dramati-
cally different in terms of length. On the other hand,
the other three proposals in (De Marsico and Mecca,
2016) based on step segmentation compute distance
with a matching strategy comparable in terms of com-
putational costs and speed to those proposed here, and
allow releasing the constraint of a similar number of
steps. However, they show lower performances (EER
of 0.328%, 0.4104%, and 0.3625% respectively) than
the approaches presented here. Approaches based on
feature extraction work on a kind of aggregated in-
formation that does not depend on the signal length,
given that it is long enough. The above comparison
seems to suggest a possible compromise between dif-
ferent application constraints, that deserves more in-
vestigation. As a further comparison, the results in
(Zhang et al., 2015) are reported. We considered only
the single accelerometer scenario (i.e., entailing the
same setting of our experiments). That work achieves
an EER that ranges from 8.6% to 13% (depending on
the chosen body location), that is generally better than
Feature-based Analysis of Gait Signals for Biometric Recognition - Automatic Extraction and Selection of Features from Accelerometer
Signals
635
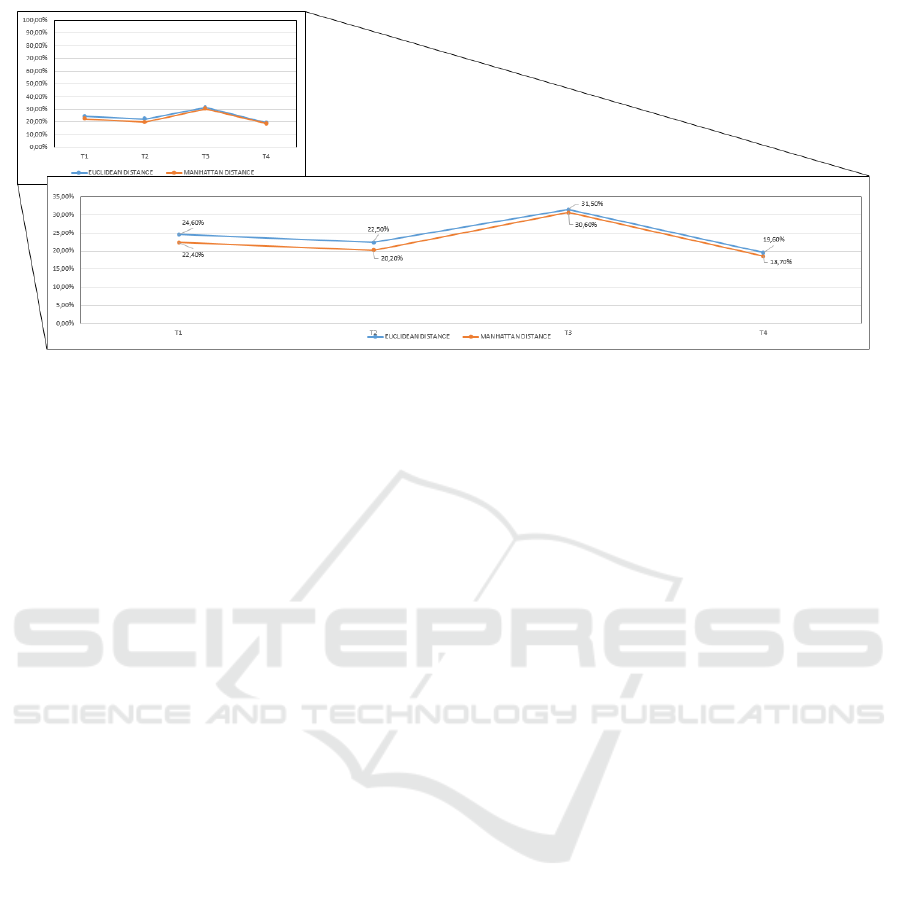
Figure 2: EER trend of the two metrics exploited.
our approach, but it is worth noticing that their proce-
dure requires about 0.3 second to run on a powerful
pc, while our approach is devised to work on smart-
phones that have lower computational power. It is
further worth underlining that making more compar-
isons with other state of the art methods is not pos-
sible at present, due to the different (and generally
much smaller) datasets used. The larger dataset intro-
duced in (Ngo et al., 2014) contains very short signals
that have been manually segmented from longer ones,
acquired in a single session and with a single walk.
Therefore we preferred to use data presenting more
challenging variations.
5 CONCLUSIONS
The main aim of this work has been to try a feature
based approach for gait recognition based on wear-
able sensors. The achieved results fall in between
those provided on a similar dataset using pure DTW.
It is worth noticing that, with respect to better ones
in literature, they are produced by approaches espe-
cially devised to run on personal mobile devices. This
entails aiming at lowest computational costs and ex-
ecution times. In any case, performances are quite
encouraging, and call for more investigation. As a fu-
ture attempt, we plan to apply PFA to an already par-
tially reduced feature set, possibly applying the best
strategy presented here based on features which are
equally informative for signals from all accelerome-
ter axes. In addition, more and possibly wider feature
sets can be investigated.
REFERENCES
De Marsico, M. and Mecca, A. (2016). Biometric walk
recognizer - gait recognition by a single smartphone
accelerometer. Multimedia Tools and Applications.
Gafurov, D., Helkala, K., and Søndrol, T. (2006). Biometric
gait authentication using accelerometer sensor. Jour-
nal of computers, 1(7):51–59.
Gafurov, D., Snekkenes, E., and Bours, P. (2010). Improved
gait recognition performance using cycle matching. In
Advanced Information Networking and Applications
Workshops (WAINA), 2010 IEEE 24th International
Conference on, pages 836–841. IEEE.
Lu, Y., Cohen, I., Zhou, X. S., and Tian, Q. (2007). Fea-
ture selection using principal feature analysis. In Pro-
ceedings of the 15th ACM international conference on
Multimedia, pages 301–304. ACM.
Ngo, T. T., Makihara, Y., Nagahara, H., Mukaigawa, Y.,
and Yagi, Y. (2014). The largest inertial sensor-
based gait database and performance evaluation of
gait-based personal authentication. Pattern Recogni-
tion, 47(1):228–237.
Nickel, C., Brandt, H., and Busch, C. (2011a). Classifica-
tion of acceleration data for biometric gait recognition
on mobile devices. BIOSIG, 11:57–66.
Nickel, C., Busch, C., Rangarajan, S., and M
¨
obius,
M. (2011b). Using hidden markov models for
accelerometer-based biometric gait recognition. In
Signal Processing and its Applications (CSPA), 2011
IEEE 7th International Colloquium on, pages 58–63.
IEEE.
Nickel, C., Wirtl, T., and Busch, C. (2012). Authenti-
cation of smartphone users based on the way they
walk using k-nn algorithm. In Intelligent Information
Hiding and Multimedia Signal Processing (IIH-MSP),
2012 Eighth International Conference on, pages 16–
20. IEEE.
Zhang, Y., Pan, G., Jia, K., Lu, M., Wang, Y., and Wu,
Z. (2015). Accelerometer-based gait recognition by
sparse representation of signature points with clusters.
IEEE transactions on cybernetics, 45(9):1864–1875.
ICPRAM 2018 - 7th International Conference on Pattern Recognition Applications and Methods
636
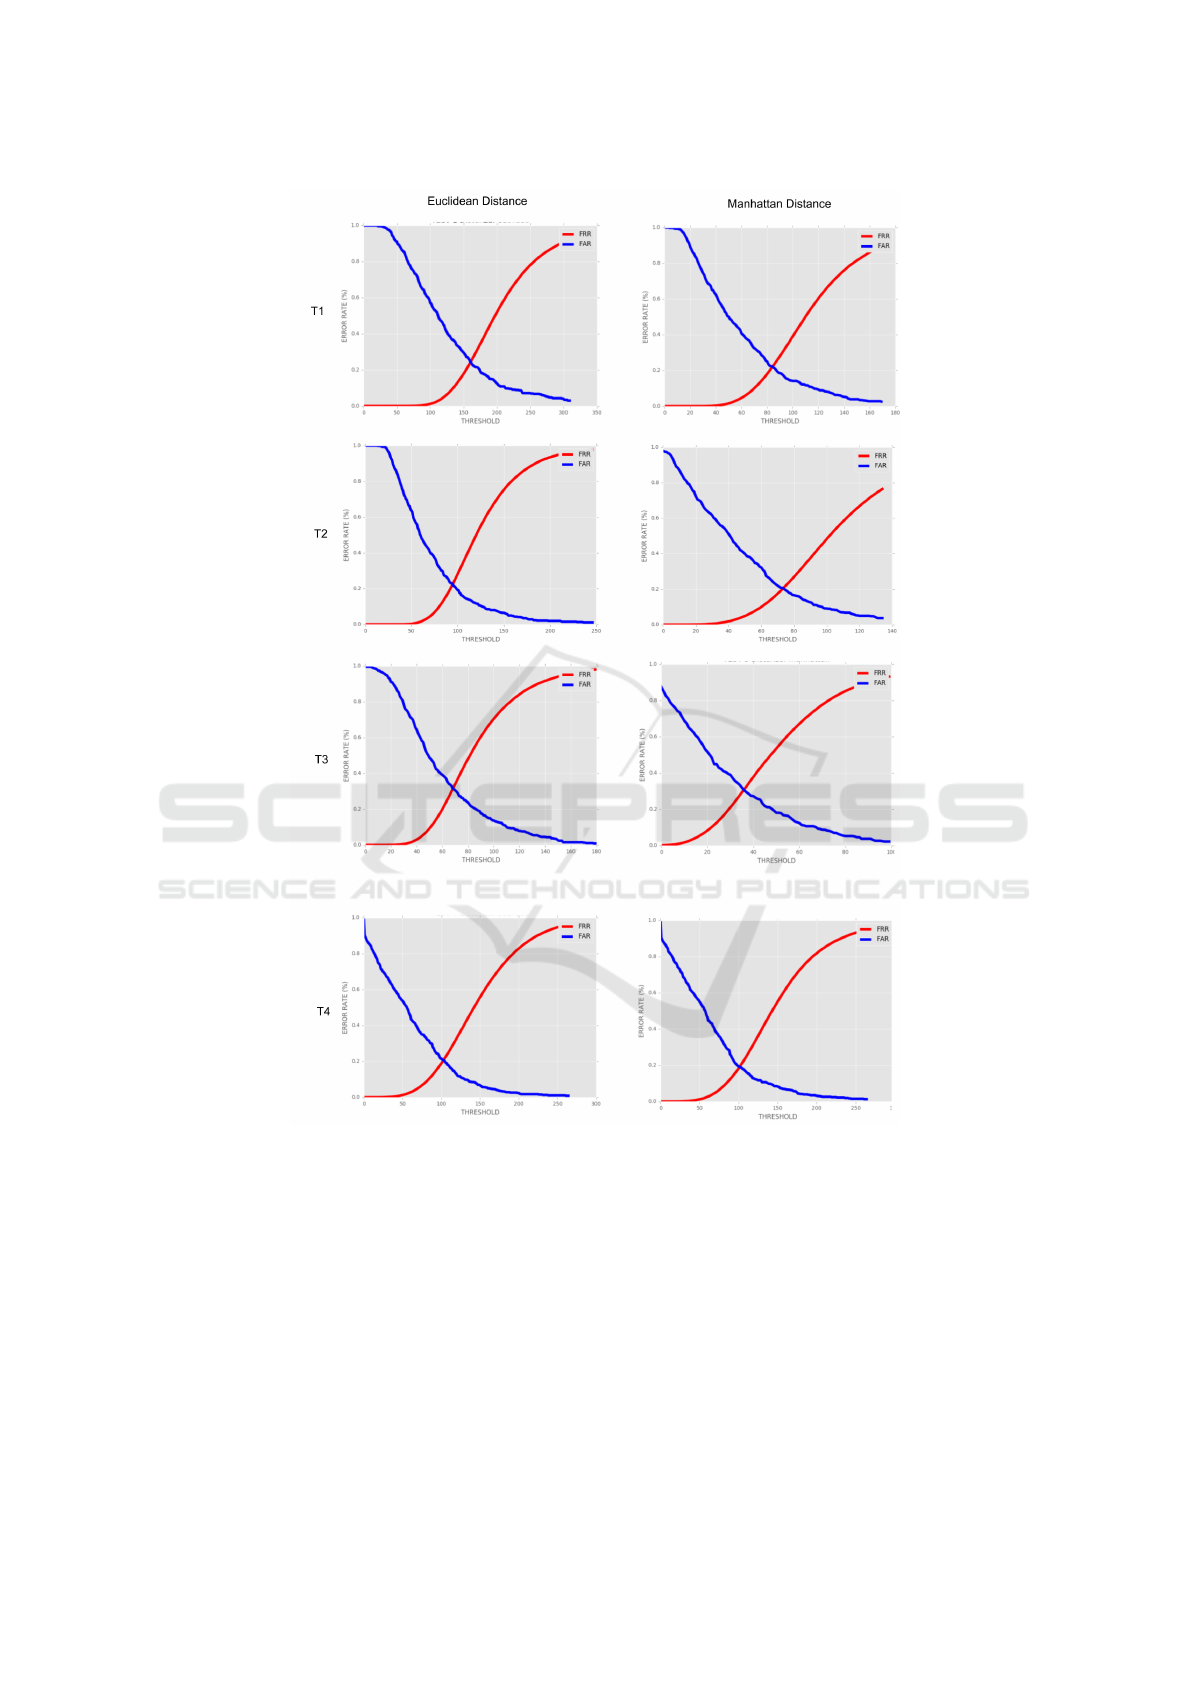
Figure 3: FAR and FRR for all test scenarios using both Euclidean Distance and Manhattan Distance.
Feature-based Analysis of Gait Signals for Biometric Recognition - Automatic Extraction and Selection of Features from Accelerometer
Signals
637
