
Road Detection from Satellite Images by Improving U-Net with
Difference of Features
Ryosuke Kamiya
1
, Kazuhiro Hotta
1
, Kazuo Oda
2
and Satomi Kakuta
2
1
Meijo University, Shiogamaguchi, Tempaku-ku, Nagoya 468-0073, Japan
2
Asia Air Survey co.,ltd, Kanagawa 215-0004, Japan
Keywords: Road Detection, U-Net, Difference of Feature.
Abstract: In this paper, we propose a road detection method from satellite images by improving the U-Net using the
difference of feature maps. U-Net has connections between convolutional layers and deconvolutional layers
and concatenates feature maps at convolutional layer with those at deconvolutional layer. Here we introduce
the difference of feature maps instead of the concatenation of feature maps. We evaluate our proposed
method on road detection problem. Our proposed method obtained significant improvements in comparison
with the U-Net.
1 INTRODUCTION
The road detection from a satellite image is carried
out manually now. This takes enormous time, and a
physical and mental burden is large. Automation of
the work using image recognition technology is
demanded to solve the problem. In conventional
method, they improved the detection accuracy by
using satellite images with 7 channels (T. Ishii et al.,
2016) and Convolutional Neural Network (CNN).
Other conventional methods achieved high precision
by using deep learning (Saito et al., 2016,
Vakalopoulou et al., 2015, O. A et al., 2015). In this
paper, we would like to detect roads by improving
the U-Net (Ronneberger et al., 2015).
U-Net consists of encoder part using convolution
and decoder part using deconvolution
(Badrinarayanan et al., 2015). In addition, the
network connects the encoder parts with decoder
parts to compensate for the information eliminated
by encoder part because fine information such as
small objects and correct position of objects are lost
by pooling and deconvolution. In the U-net, the
feature maps at encoder part were concatenated to
those at decoder part. However, in residual network
(He et al., 2016), the summation of feature maps
were used and it worked well. Thus, the other
computation may be effective though original U-net
used simple concatenation at the connection.
In this paper, we compute the difference of
feature maps at the connection part of the U-Net to
improve the segmentation accuracy. Since we use
ReLU as an activation function, negative values
obtained by the difference of feature maps become
0. Thus, we expect that high-frequency components
such as road are emphasized.
Our proposed method is applied to road detection
problem from the satellite images. We evaluate the
accuracy using four satellite images with high
resolution. The proposed method improved the
accuracy more than 5% in comparison with the
original U-Net.
This paper is organized as follows. At first, we
explain the details of the proposed method in section
2. Next, we show the experimental results on road
detection from satellite images in section 3. The
comparison with the original U-net is also shown in
the section. Finally, we describe conclusion and
future works in section 4.
2 PROPOSED METOD
In this paper, we propose a new network which uses
the difference of the feature maps. We show the
structure of the original U-Net and the proposed
method in Figure 1. U-Net concatenated the output
of conv1 layer and that of deconv1 layer. The output
of conv2 layer and that of deconv2 layer is also
concatenated.
Shallower layers have the information about
high-frequency component such as the position of
Kamiya, R., Hotta, K., Oda, K. and Kakuta, S.
Road Detection from Satellite Images by Improving U-Net with Difference of Features.
DOI: 10.5220/0006717506030607
In Proceedings of the 7th International Conference on Pattern Recognition Applications and Methods (ICPRAM 2018), pages 603-607
ISBN: 978-989-758-276-9
Copyright © 2018 by SCITEPRESS – Science and Technology Publications, Lda. All rights reserved
603
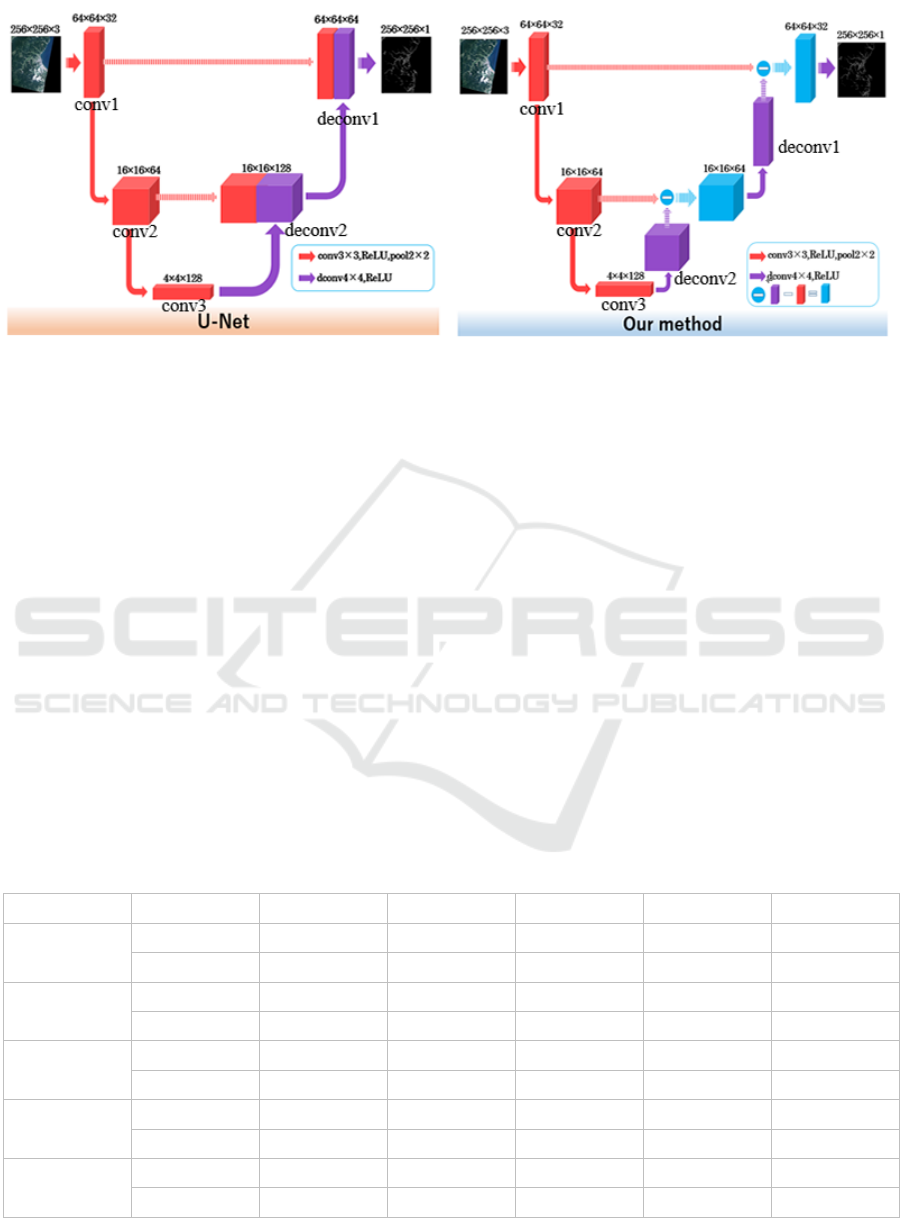
Figure 1: Structure of U-Net and Ours method.
objects and the border between objects. Deeper
layers have semantic information of objects. Fine
information such as road is lost by pooling and
deconvoluion. U-Net compensates for the lost
information by concatenating the feature maps at
encoder part to decoder part.
On the other hand, in the proposed method, we
compute the difference between the feature map at
conv1 layer and that at deconv1 layer instead of
concatenation. Similarly, we also compute the
difference between conv2 layer and deconv2 layer.
Since we use ReLU as an activation function,
negative values obtained by the difference of feature
maps become 0. This can emphasize easily the high-
frequency component such as road by while
removing the noise that occurred by deconvolution.
The roads in satellite images are high-frequency
component. Thus, we consider that deep network is
not necessary and use a shallow encoder-decoder
network as shown in Figure 1.
In both networks, conv1 layer has 32 filters,
conv2 layer has 64 filters, conv3 layer has 128
filters, deconv1 layer has 32 filters and deconv2
layer has 64 filters. In addition, the filter size at
convolutional layer is set to 3 × 3, that at
deconvolutional layer is set to 4×4.
3 EXPERIMENTS
In this section, we show the evaluation results by the
U-Net and the proposed method. At first, we explain
the dataset used in experiments in section 3.1.
Evaluation method is explained in section 3.2. We
explain comparison methods in section 3.3.
Comparison result with the original U-net is shown
in section 3.4.
Table 1: Highest AUC of each method.
Network
Adam
dataset1
dataset2
dataset3
dataset4
Average
U-Net
1e-4
62.69%
68.01%
61.66%
56.14%
62.13%
1e-5
46.72%
43.83%
57.66%
63.81%
53.01%
Add
1e-4
51.83%
55.85%
61.36%
55.76%
45.24%
1e-5
33.97%
50.60%
68.91%
48.23%
50.43%
Ours
1e-4
61.98%
56.37%
73.28%
68.03%
64.91%
1e-5
55.72%
50.77%
57.64%
61.83%
56.49%
Ours(fp)
1e-4
62.00%
66.88%
73.51%
54.57%
64.24%
1e-5
34.87%
61.85%
55.43%
60.61%
53.19%
Ours(sp)
1e-4
64.59%
70.07%
75.47%
69.49%
69.90%
1e-5
60.91%
67.15%
73.21%
65.10%
66.59%
ICPRAM 2018 - 7th International Conference on Pattern Recognition Applications and Methods
604
3.1 Dataset
We use four satellite images captured by Hodoypshi-
1 in experiments. The resolution of the original
image is 4,152×4,003 pixels. Since four images are
too small to evaluate the accuracy, we crop a region
of 128×128 pixels at the overlap ratio of 0.25 from
the original images. In general, many supervised
images are required for training a deep learning.
Thus, we rotate the cropped images at the interval of
90 degrees. This makes the method to be robust to
the direction of roads.
In experiments, three original images are used
for training and remaining one original image is
used for test. For evaluating the general accuracy
fairly, we made four datasets while changing a
combination of three training images and one test
image. Thus, all original images are used as test.
As a result, training regions in dataset 1 is
124,828, those in dataset 2 is 125,704, those in
dataset 3 is 127,820 and those in dataset 4 is 129,704.
Test images for four datasets are 12,372 regions
cropped without overlap. The number of training
regions is different among datasets because we crop
local regions without a black region in Figure 4.
3.2 Evaluation Method
In this paper, since we have only four satellite
images, we cannot prepare the dataset for validation
and choose the most suitable model for test. Thus,
we train each method until 100 epochs and save the
model at every 5 epochs and compute Precision
Recall Curve (PRC) and Area Under the Curve
(AUC).
We drew the graph whose horizontal axis is the
number of epoch and vertical axis is AUC. We
evaluate each method by the graph and the
maximum AUC.
3.3 Comparison Methods
At first, we must compare our method with the
original U-net. We also evaluate the network which
adds the feature map at encoder part to that at
decoder part in order to investigate the effectiveness
of the difference of the feature map. The summation
of feature map is like the ResNet
3)
and we call this
network “Add”.
In addition, we also evaluate the network that the
difference of feature maps is used at only the first
layer or the second layer in order to investigate
which layer is effective. The first network does not
have the path between the second layers while only
first layer has the path. We call this method Ours
(fp:first path). The second network does not have the
path between the first layers while only second layer
has the path. We call this method Ours (sp:second
path).
3.4 Experimental Results
In this experiment, we classify a satellite image into
two classes; road and background. We evaluate all
methods using two kinds of alpha value in Adam
optimizer (Kingma at al., 2015); 1e-4 and 1e-5.
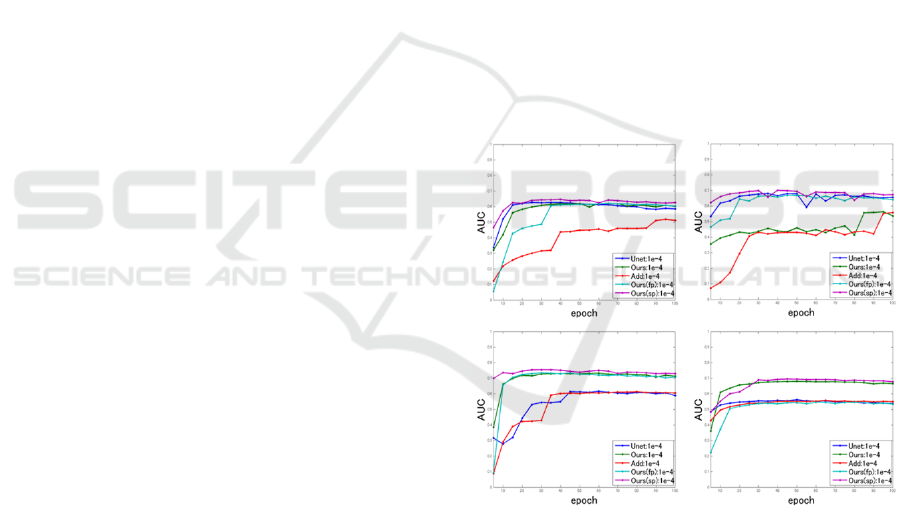
AUC graphs of each method at alpha 1e-4 and 1e-5
are shown in Figure 2 and 3. In addition, we show
the maximum AUC of each network in Table 1.
Only top 3 AUCs are shown as the red in Table1.
As we can see from Table1, our method using
two paths for the difference of feature maps
improved approximately 3% in comparison with the
original U-net. The best AUC is obtained by the
method “Ours(sp)”. This method is approximately
5% bettetr than the U-Net. This result demonstrated
that the difference of the feature maps is effective
for classifying small objects like road.
Figure 2: AUC graph when alpha is1e-4. (upper left:
dataset 1, upper right: dataset 2, bottom left: dataset 3,
bottom right: dataset 4).
When we compare Ours(fp) with Ours(sp), the
difference of the feature maps of the conv2 layer and
the deconv2 layer is more effective, and the
difference of the feature maps of conv1 and the
deconv1 improve the accuracy slightly. It is
necessary for the road detection that high-frequency
component indicating the position and semantic
information of the road. The shallow layer of
convolution layers has the information of the high-
Road Detection from Satellite Images by Improving U-Net with Difference of Features
605
frequency component such as a border between
objects and the deep layer has semantic information
such as object class. We consider that those two
information was included in Ours(sp) in a good
balance in comparison with Ours(fp).
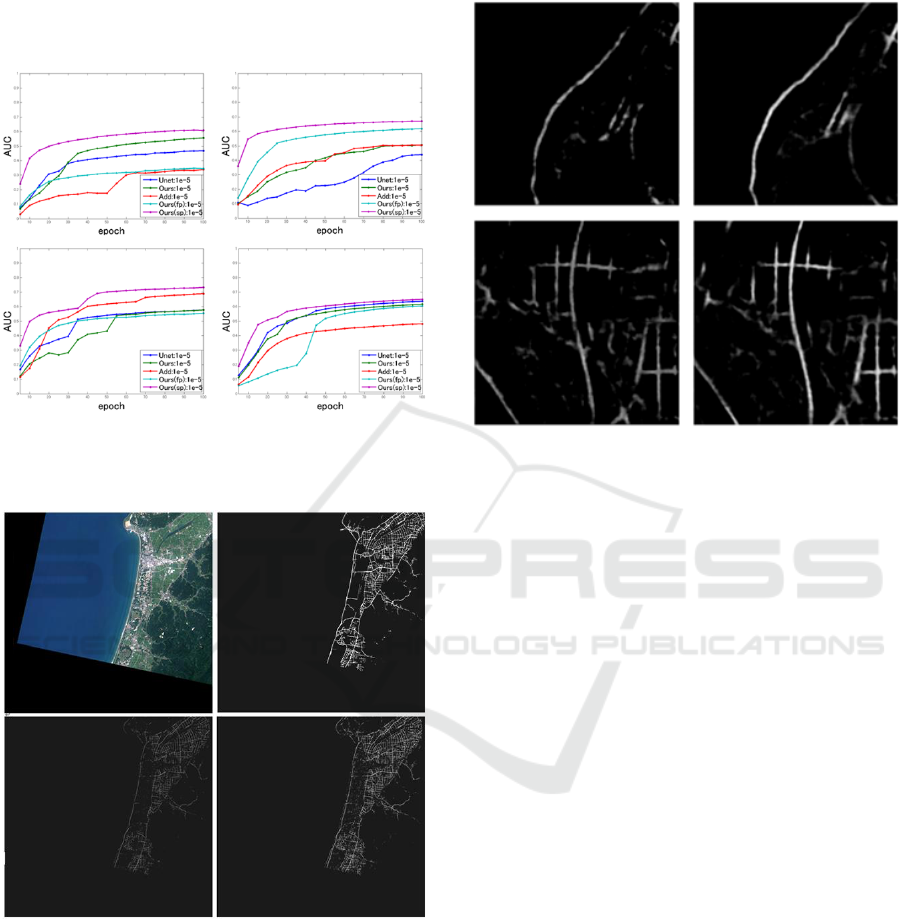
Figure 3: AUC graph when alpha is 1e-5. (upper left:
dataset 1, upper right: dataset 2, bottom left: dataset3,
bottom right: dataset4).
Figure 4: Detection result for dataset 3. (upper left: input
image, upper right: ground truth, bottom left: U-Net,
bottom right: Ours(sp)).
We show the input and output image when we
use dataset 3 in Figure 4. We see that both U-Net
and the proposed method can detect the road roughly.
However, the output of our proposed method is
clearer than the U-Net. This shows that our method
detects small part of the road.
We show the enlarged image of Figure 4 in
Figure 5 in order to confirm the fine detection result.
As we can see from Figure 5, our proposed method
can detect fine road well in comparison with the U-
Net.
Figure 5: Comparison of fine detection result for dataset 3.
(left: U-Net, right: Ours(sp)).
4 CONCLUSION
By using the difference of feature maps between
convolutional layer and deconvolutional layer, we
can emphasize the small objects as road. Our
proposed method gave better result than the original
U-Net.
However, there are roads that are hard to classify
because of crowding buildings shown in center of
Figure 5. We consider that they are hard to learn
because space between roads is too narrow by the
resolution of the current image.
After we crop the local regions, we should
enlarge the regions by super-resolution methods (C.
Dong al., 2015) in order to enlarge the distance
between roads. In addition, we used shallow network
in this paper. Thus, we should use more layers.
These are subjects for future work.
REFERENCE
T. Ishii, E. Simo-Serra, S. Iizuka, Y. Mochizuki, A.
Sugimoto, H. Ishikawa, and R. Nakamura, “Detection
by classification of buildings in multispectral satellite
imagery” Proc. International Conference on Pattern
Recognition(ICPR), 2016.
S. Saito, T. Yamashita, and Y. Aoki. “Multiple object
extraction from aerial imagery with convolutional
ICPRAM 2018 - 7th International Conference on Pattern Recognition Applications and Methods
606

neural networks.” Journal of Imaging Science and
Technology, Vol. 60, No. 1, 2016.
M. Vakalopoulou, K. Karantzalos, N. Komo-dakis, and N.
Paragios. “Building detection in very high resolution
multispectral data with deep learning features.” Proc.
IEEE International on Geoscience and Remote
Sensing Symposium (IGARSS), pp 1873-1876, 2015.
O. A. B. Penatti, K. Nogueira, and J. A. dos Santos. “Do
deep features generalize from everyday objects to
remote sensing and aerial scenes domains?” Proc.
IEEE Conference on Computer Vision and Pattern
Recognition (CVPR) Workshops, pp.44-51, 2015.
O. Ronneberger, P. Fischer and T. Brox, “U-Net:
Convolutional Networks for Biomedical Image
Segmentation”. Proc. Medical Image Computing and
Computer Assisted Intervention, pp 234-241, 2015.
V. Badrinarayanan, A. Kendall and R. Cipolla, “SegNet:
A Deep Convolutional Encoder-Decoder Architecture
for Image Segmentation.” IEEE Transactions on
Pattern Analysis and Machine Intelligence (TPAMI),
Vol.39, No.12, pp.2481-2495, 2017.
K. He, X. Zhang, S. Ren and J. Sun, “Deep Residual
Learning for Image Recognition.” Proc. IEEE
Conference on Computer Vision and Pattern
Recognition, pp771-778, 2016.
D. P. Kingma, J. Ba, “Adam: A Method for Stochastic
Optimization.” Proc. International Conference on
Learning Representations (ICLR), 2015.
C. Dong, C. C. Loy, K. He and X. Tang, “Image Super-
Resolution Using Deep Convolutional Networks.”
IEEE Transactions on Pattern Analysis and Machine
Intelligence (TPAMI), Vol.38, No.2, pp.295-307,
2015.
Road Detection from Satellite Images by Improving U-Net with Difference of Features
607
