
Electricity Consumption Model Analysis based on Sparse Principal
Components
Bo Yao
1
, Yiming Xu
1
, Yue Pang
1
, Chaoyi Jin
1
, Zijing Tan
1
, Xiangdong Zhou
1
and Yun Su
2
1
School of Computer Science, Fudan University, No.220, Handan Road, Shanghai, China
2
State Grid Shanghai Municipal Electric Power Company, Shanghai, China
Keywords: Electricity Time Series, Sparse Principal Components Analysis, Clustering and Categorization.
Abstract: The well-being of people, industry and economy depends on reliable, sustainable and affordable energy. The
analysis on energy consumption model, especially on electricity consumption model, plays an important role
in providing guidance that makes energy system stable and economical. In this paper, clustering based on
electricity consumption model is imposed to categorize consumers, and Sparse Principal Components
Analysis (SPCA) is employed to analyse electricity consumption model for each group clustered.
Experimental results show that our methods can automatically divide a day into peak times and off-peak
times, so as to reveal in detail the electricity consumption model of different types of consumers. Additionally,
we study the relationships between social background of consumers and their electricity consumption model.
Our experimental results show that social background of consumers has impact on their consumption model,
as expected, but cannot fully determine it.
1 INTRODUCTION
Energy is the life blood of our society. The well-being
of people, industry and economy depends on secure,
sustainable and affordable energy (European Union,
2011). However, our energy system faces a number
of challenges as existing infrastructures close,
domestic fossil fuel reserves decline and old systems
are required to meet new low-carbon objectives
(OFGEM, 2010).
To make sure that energy systems have adequate
capacity and are reliable and economical, effective
adjustments in policies of energy supply department
and in consumption strategies of end consumers are
necessary. The research on energy consumption
model, especially on electricity consumption model,
is a corner stone of these adjustments.
For instance, Time Of Use (TOU) Tariffs set
different prices for electricity at different times of the
day. Time is divided into peak and off-peak periods
that reflect the different levels of demand on the
electricity network. Cheaper electricity prices during
off-peak periods will guide consumers to use power
at that time so as to balance the demand. This
approach benefits electricity supply department in
balancing power supply and benefits end consumers
in reducing costs. However, peak and off-peak times
vary in different seasons of a year, and vary for
different types of consumers. Effective adjustments
of TOU Tariffs for different seasons and consumers
depend on a clear understanding of electricity
consumption model of consumers.
In this paper, we impose K-Means clustering and
Affinity Propagation clustering (AP) (Brendan and
Delbert, 2007) to divide consumers according to their
electricity consumption model. And Sparse Principal
Component Analysis (SPCA) (Hui et al., 2006) is
then employed to analyse electricity consumption
model for each group clustered. Experimental results
show that our method can, for different types of
consumers, automatically divide a day into peak
times and off-peak times.
Principal component analysis (PCA) (Pearson,
1901; Hotelling, 1930s; Jolliffe, 2002) is widely used
in data-processing and dimensionality reduction.
However, PCA suffers from the fact that each
principal component (PC) is a linear combination of
all the original variables, thus it is often difficult to
interpret the results. SPCA utilize the lasso (elastic
net) to produce modified PCs with sparse loadings. In
this case each modified PC is a linear combination of
some significant original variables rather than all.
Thus SPCA provides more interpretation and can be
applied to analyse electricity time series of
590
Yao, B., Xu, Y., Pang, Y., Jin, C., Tan, Z., Zhou, X. and Su, Y.
Electricity Consumption Model Analysis based on Sparse Principal Components.
DOI: 10.5220/0006715405900596
In Proceedings of the 7th International Conference on Pattern Recognition Applications and Methods (ICPRAM 2018), pages 590-596
ISBN: 978-989-758-276-9
Copyright © 2018 by SCITEPRESS – Science and Technology Publications, Lda. All rights reserved

consumers. By tuning the sparsity parameter
properly, sparse PCs derived can indicate the
significant time intervals in a day (that is, peak times),
so as to divide a day into different times
automatically.
Additionally, to study the relationships between
social background and electricity consumption model
of consumers, we use ACORN (CACI, 2010) to
categorize consumers and apply SPCA to analyse
electricity consumption model for each category. The
ACORN provides precise information and an in-
depth understanding of different types of people (that
is, social background of these people). Based on the
experiments, we find that social background of
consumers influences the consumption model but
cannot fully determine it. That reveals that it is
insufficient to consider only social background of
consumers, when adjusting policies.
2 RELATED WORK
Data analysis of daily load data generated by smart
meters can benefit both electricity suppliers and end
consumers. A two-stage clustering based on multi-
level 1D discrete wavelet transform and K-means
algorithm is applied to perform daily load curve
clustering and load pattern clustering (Zigui et al.,
2017). Additionally, to obtain distinct consumer
categories, method of category identification based
on association rule mining and characteristic
similarity is also proposed in the paper. Zigui et al.
study the relationships between the natural types of
consumers and the consumer categorization based on
load pattern similarity; they find that the types cannot
full determine the categorization.
A hybrid fuzzy-stochastic technique proposed by
Yu et al., (2017) develops an interval-fuzzy chance-
constrained programming (IFCCP) method to reflect
multiple uncertainties expressed as interval-fuzzy-
random (integration of interval values, fuzzy sets, and
probability distributions). IFCCP has advantages in
uncertainty reflection and policy analysis, while
avoiding complicated intermediate models with high
computational efficiency. Considering the peak
power demand problem, the developed IFCCP
method is used to plan a regional-scale electric power
system (EPS).
In contrast to dividing a day manually relying on
experience, segmenting automatically by our SPCA
provides more convenience and rationality, since the
peak times and off-peak times derived are consistent
with the real consuming habits of consumers.
3 ANALYSING ELECTRICITY
CONSUMPTION MODEL
The process of electricity consumption model
analysis consists of two stages. First, we impose
clustering to divide consumers into groups according
to their consumption model, and meanwhile,
categorize consumers by their social background for
further study. Then, SPCA is employed to analyse
electricity consumption model for each group.
3.1 Clustering and Categorization
To obtain a better understanding of electricity
consumption model, we impose K-Means clustering
and AP clustering to gather consumers with similar
consumption model. K-Means clustering is a method
of vector quantization, originating from signal
processing, and is popular for cluster analysis in data
mining. It aims to partition n observations into k
clusters where each observation belongs to the cluster
with the nearest centroid. Affinity propagation (AP)
clustering is an algorithm based on the concept of
"message passing" between data points. Unlike K-
Means, Affinity Propagation does not require the
number of clusters to be determined before clustering.
Let denote a data matrix consisting of
electricity time series of consumers. Herein, is the
number of consumers, is the number of time
intervals, and
is the electricity consumption of
the th consumer in the th time interval. Clustering
is applied to divide data matrix into K sub-matrices
in the form of
, where
. Each
sub-matrix is composed of electricity time series of
consumers with similar consumption model. After
that, meaningful results can be obtained when
analysing these sub-matrices by SPCA.
Additionally, to study the relationships between
social background and electricity consumption model
of consumers, we use ACORN to categorize
consumers. Similarly, given a data matrix
that consists of electricity time series of consumers,
we divide it into Q sub-matrices
in the form of
, where
. Each sub-matrix is
composed of electricity time series of consumers in a
same category. Analysing these sub-matrices by
SPCA may reveal another side of the electricity
consumption model of consumers.
Electricity Consumption Model Analysis based on Sparse Principal Components
591

3.2 Analysing Electricity Time Series
with SPCA
To understand the electricity consumption model of
consumers, we employ SPCA (Hui et al., 2006) to
analyse every sub-matrix
derived from clustering.
Besides, we also analyse every sub-matrix
derived
from categorization to understand the relationships
between social background and electricity
consumption model. SPCA is a specialized technique
used in statistical analysis, and in particular, in the
analysis of multivariate data sets. It extends the
classic method of PCA for the reduction of
dimensionality of data by adding sparsity constraints
on the loadings of PCs.
Specifically, PCA can be formulated as a
regression-type optimization problem: Let denote a
data matrix, where and are the number of
observations and the number of variables,
respectively. And for each , let
denote the th
principal component. Consider the ridge estimates
given by:
(1)
Let
, then
, which is the loading
of the th principal component. SPCA adds the
penalty to equation (1) and fits the following
optimization problem:
(2)
That
is a sparse approximation to
, and
is the th sparse principal component. With the
sparsity constraint (that is, the
penalty) on the
loadings of PCs, a sparse PC derived is a linear
combination of some significant original variables. In
contrast to PCA whose every PC is a linear
combination of all the original variables, SPCA can
provide more meaningful interpretations.
We employ SPCA to analyse those sub-matrices
derived from clustering and
derived from
categorization. Recall that a sub-matrix derived is
composed of electricity time series of consumers in a
same group, in the form of
(
). Herein,
(
) is the number of consumers in the group and
is the number of time intervals in the time series.
By tuning the sparsity parameter
properly, a sparse
PC derived from the sub-matrix is a linear
combination of some significant time intervals (that
is, based on the experimental results, a daily peak
times). And then we can segment a day into peak
times and off-peak times automatically according to
these sparse PCs derived. Since the peak times are
directly derived from the electricity time series of
consumers, this segmentation is consistent with the
real consuming habits of these consumers. In contrast
to dividing a day manually relying on experience, our
method provides more convenience and rationality.
4 EXPERIMENTS
We first introduce the experiment data in section 4.1,
and then in section 4.2, describe the experiments
where K-Means and AP clustering are imposed to
divide consumers and SPCA is applied to analyse
electricity consumption model for each group. Finally,
a detailed discussion about the relationships between
social background and electricity consumption model
is presented in section 4.3.
4.1 Data
We analysed electricity time series collected by the
Energy Demand Research Project (EDRP) (AECOM,
2011), which was designed to help better understand
how domestic consumers in UK react to improved
information about their energy consumption over the
long term. The data set used in our experiments
include 3118 consumers and their half-hourly
electricity time series from May 9, 2009 to August 24,
2009. Additionally, for each consumer in the data set,
there is an ACORN label which indicates the social
background of the consumer. We utilize these labels
to study the relationships between social background
and electricity consumption model of consumers.
4.2 Electricity Consumption Model
Analysis
4.2.1 Analysing by K-Means and SPCA
We start with an experiment where the electricity
time series were clustered by K-Means. The number
of clusters was set to 8 by adjusting the within-cluster
distance, between-cluster distance and numbers of
consumers in each group. We only chose the first
three groups with sufficient samples. Other groups do
not have enough consumers; this makes deriving
sparse PCs impractical. The sparse principal
components of the first three groups and their
corresponding daily peak times in a week are shown
in table 1(a).
ICPRAM 2018 - 7th International Conference on Pattern Recognition Applications and Methods
592
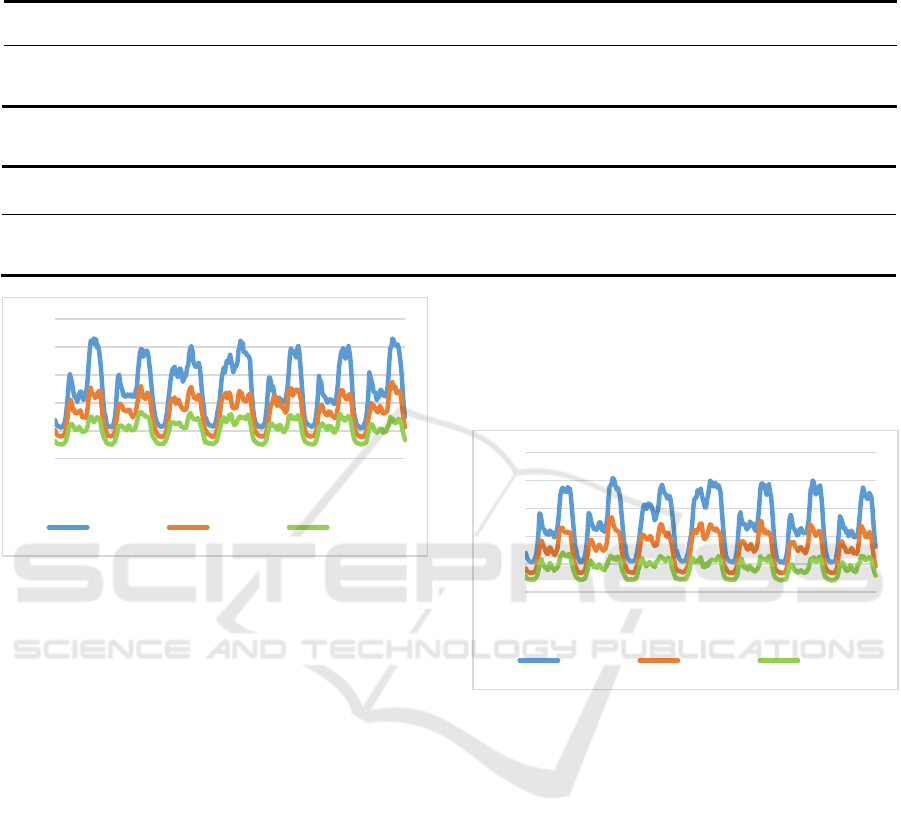
Table 1(a): The sparse principal components of groups 0, 1 and 2 (K-Means) and their corresponding daily peak times in a
week.
Group
Counts of
consumers
PC1
PC2
PC3
PC4
0
1
2
649
1043
902
19:00-2:30
5:00-16:00
17:00-24:00
8:30-15:30
18:00-24:00
8:00-15:30
15:00-18:00
15:00-17:30
5:30-8:30
5:00-9:00
--
--
Table 1(b): The sparse principal components of groups 0, 1 and 2 (AP) and their corresponding daily peak times in a week.
Group
Counts of
consumers
PC1
PC2
PC3
PC4
0
1
2
1006
1165
511
18:00-6:00
17:00-1:00
15:00-22:30
7:30-16:30
7:30-15:30
6:30-7:30
5:00-8:30
5:30-8:00
--
--
--
--
Figure 1(a): Average electricity time series of groups 0, 1
and 2 (K-Means) in a week. The vertical axis represents the
electricity consumption (kilowatt per hour), and the
horizontal axis represents the time intervals every half hour
(totally 48 * 7 = 336 intervals).
To verify the validity of our method, we plotted
average electricity time series of groups 0, 1 and 2 in
the week. The results are presented in figure 1(a).
Note that the harmonization of daily peak times
derived by our SPCA and those real ones in figure
1(a) demonstrates the validity of our method.
For a better understanding of the electricity
consumption model, we categorized consumers by
ACORN in groups 0, 1 and 2. The results are shown
in figure 2(a) (categories whose count of consumers
is less than 5% were omitted for space limitation).
Category A, B and C of ACORN represent wealthy
households, category H and I of ACORN represent
bourgeois, and category L, M, N, O and P consist of
relatively low-income families. Note that group 0 is
mainly composed of wealthy households and
bourgeois, incurring the highest average electricity
consumption per consumer per day (about 12 kilowatt
per hour), compared to groups 1 and 2. Daily peak
times of this group almost span all day except 3:00 to
5:00; this indicates that consumers in the group have
a habit of using electricity nearly all the day except
the short time after midnight. Group 1 has a more
balanced categorization result, with a less mean value
per consumer per day (about 8 kilowatt per hour).
Figure 1(b): Average electricity time series of groups 0, 1
and 2 (AP) in a week. The vertical axis represents the
electricity consumption (kilowatt per hour), and the
horizontal axis represents the time intervals every half hour
(totally 48 * 7 = 336 intervals).
Accordingly, daily peak times of this group are
shorter, and electricity consumption of these
households is mostly in daytime and in the first half
of the night. Group 2 is mostly composed of relatively
low-income families and bourgeois, with the lowest
average value per consumer per day (about 5 kilowatt
per hour). And the daily peak times of this group are
the shortest among the three groups; the consumers
only use electricity in the morning and in the first half
of the night. In a word, we find the social background
of consumers influences their consumption model
and richer consumers tend to use more electricity in
longer peak times, as expected.
0
0,1
0,2
0,3
0,4
0,5
1
24
47
71
94
117
140
163
186
209
232
255
278
301
324
group 0 group 1 group 2
0
0,1
0,2
0,3
0,4
0,5
1
24
47
71
94
117
140
163
186
209
232
255
278
301
324
group 0 group 1 group 2
Electricity Consumption Model Analysis based on Sparse Principal Components
593
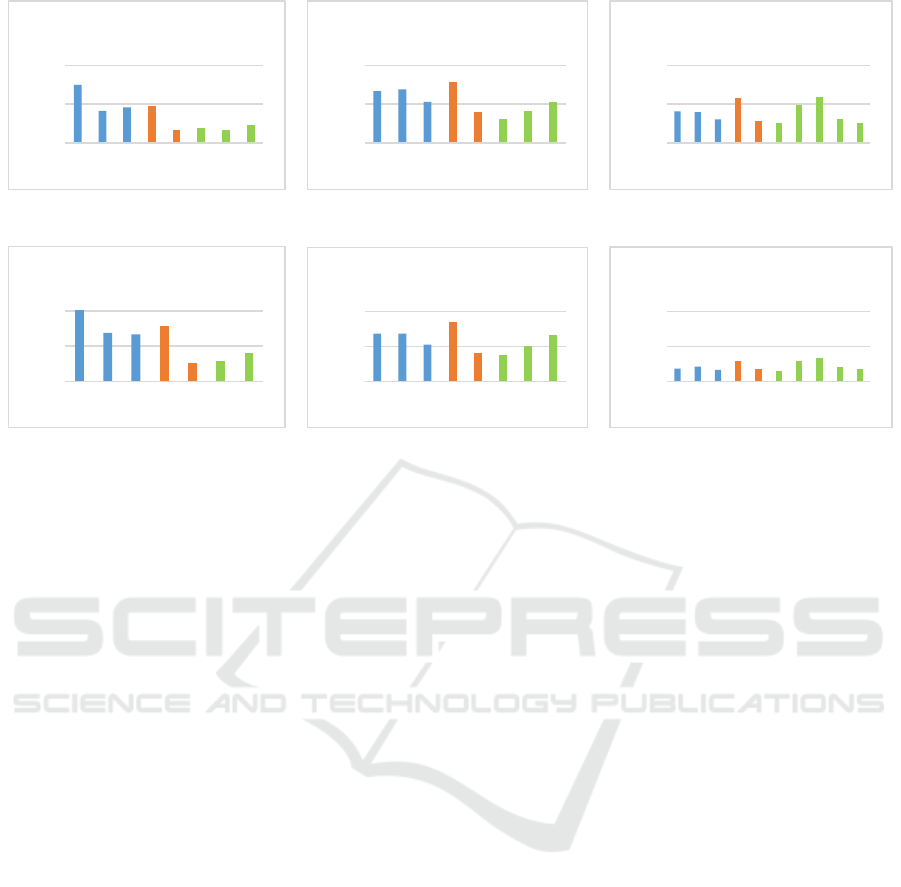
Figure 2(a): Results of categorization for groups 0, 1 and 2 of K-Means.
Figure 2(b): Results of categorization for groups 0, 1 and 2 of AP.
4.2.2 Analysing by AP and SPCA
Experiments in which the electricity time series were
clustered by AP show similar results as those of K-
Means. By trading off the within-cluster distance,
between-cluster distance and numbers of consumers
in each cluster, we selected results with 8 clusters.
Similarly, the first three groups with sufficient
consumers were chosen and their sparse PCs with
corresponding daily peak times in a week are shown
in table 1(b). To clearly show the validity of our
method, we also plotted average electricity time
series of groups 0, 1 and 2 in the week. The results are
presented in figure 1(b). Note that these obtained
daily peak times coincide with those real ones in
figure 1(b).
Similarly, consumers in groups 0, 1 and 2 were
categorized by ACORN for a clear understanding of
electricity consumption model; the results are shown
in figure 2(b) (categories whose count of consumers
is less than 5% were omitted). Category A, B and C
of ACORN represent wealthy households, category H
and I of ACORN represent bourgeois while category
L, M, N, O and P consist of relatively low-income
families. Interestingly, the first three groups with
sufficient consumers of the AP clustering resemble
those of K-Means. Group 0 also mainly consists of
wealthy households and bourgeois, which has the
highest average power consumption per consumer per
day. Consumers in this group tend to use electricity
nearly all the day. Again, group 1 has balanced
categorization results with a middle mean value per
consumer per day, and households in this group are
apt to use power in daytime and in the first half of the
night. Compared to groups 0 and 1, group 2 mostly
consists of relatively low-income families and
bourgeois, having the lowest mean power usage per
consumer per day. Electricity consumption of its
households is mostly in the morning and in the first
half of the night.
4.3 Discussion
To study the relationships between social background
and electricity consumption model of consumers, we
use ACORN to categorize consumers and apply
SPCA to analyse electricity consumption model for
each category. The consumers were categorized into
5 categories and the results are shown in table 3. We
neglected category 2, since the scarcity of consumers
will incur troubles in deriving sparse PCs.
This experiment produced mixed results. We can
find that a category may include both low-electricity-
consumption households and high-electricity-
consumption households. The power consumption
models of lower ones are covered by those of higher
ones, or reversely, the electricity consumption models
of higher ones are weakened by those of lower ones.
To further study the mutual interference in
analysing by categorization and SPCA, firstly, in a
typical category 5, we counted the number of
consumers for each group derived by K-Means and
AP clustering. The results are presented in table 4.
Note that even if category 5 is composed of relatively
low-income families, there are still some families
with high power consumption in the category. And
0
100
200
A B C H I L M N
group 0
0
100
200
A B C H I L M N
group 1
0
100
200
A B C H I L M N O P
group 2
0
100
200
A B C H I M N
group 0
0
100
200
A B C H I L M N
group 1
0
100
200
A B C H I L M N O P
group 2
ICPRAM 2018 - 7th International Conference on Pattern Recognition Applications and Methods
594
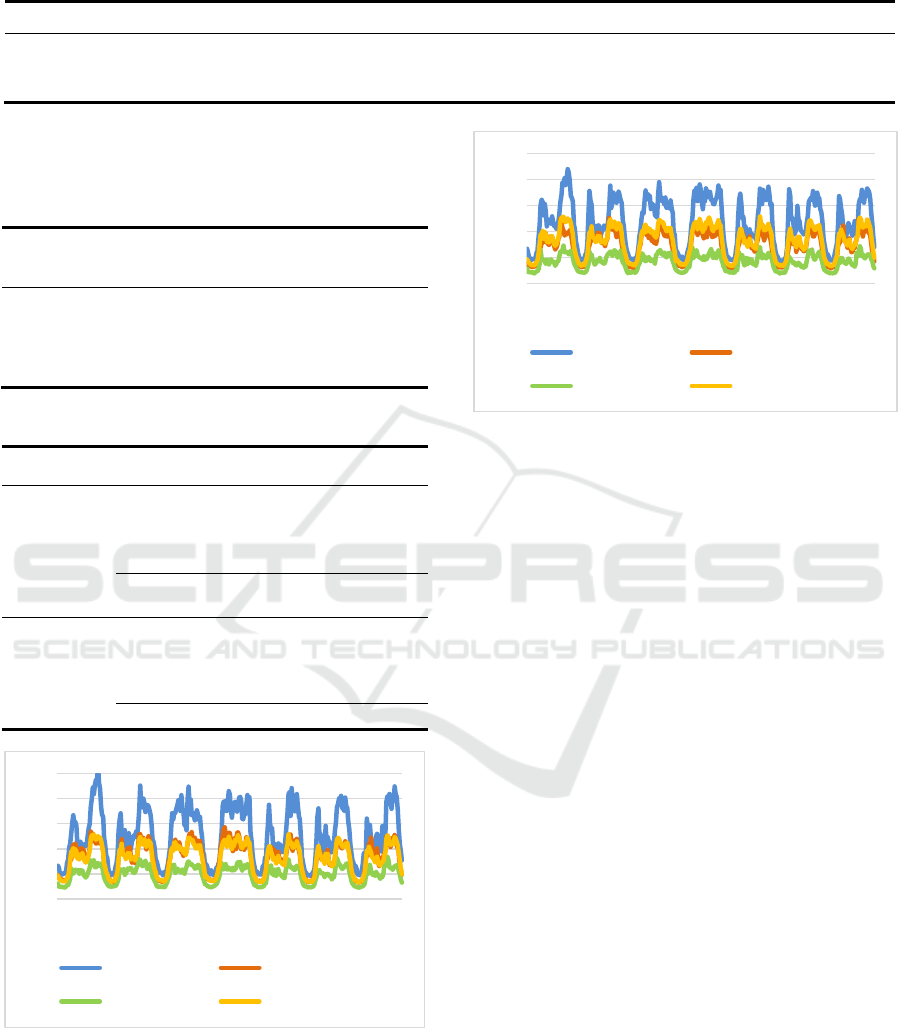
Table 2: The sparse principal components of category 5 whose count of consumers is 505 and the corresponding daily peak
times.
Week
PC1
PC2
PC3
PC4
May 9, 2009 - May 15, 2009
May 16, 2009 - May 22, 2009
May23, 2009 - May 29, 2009
17:30-23:30
18:00-23:30
8:00-16:30
15:00-18:00
17:00-18:30
18:00-23:30
7:00-9:30
15:00-17:00
15:30-18:00
6:00-7:00
6:00-7:30
6:00-7:30
Table 3: Results of categorization by ACORN. Category 1
and 2 represent wealthy households and category 3
represents bourgeois while category 4 and 5 consist of
relatively low-income families.
Category
Count of
consumers
Description of the category
1
2
3
4
5
1246
166
767
424
505
Wealthy Achievers
Urban Prosperity
Comfortably Off
Moderate Means
Hard-Pressed
Table 4: Composition state of consumers in category 5.
Clustering
Group
Count of consumers
K-Means
0
1
2
other
64
170
233
38
total
505
AP
0
1
2
other
111
221
145
28
total
505
Figure 3(a): Average electricity time series of groups 0, 1
and 2 (K-Means) and of entire category. The vertical axis
represents the electricity consumption (kilowatt per hour),
and the horizontal axis represents the time intervals every
half hour (totally 48 * 7 = 336 intervals).
Figure 3(b): Average electricity time series of groups 0, 1
and 2 (AP) and of entire category. The vertical axis
represents the electricity consumption (kilowatt per hour),
and the horizontal axis represents the time intervals every
half hour (totally 48 * 7 = 336 intervals).
these families are clustered into group 0 by K-Means
and AP, which use electricity nearly all the day.
Secondly, we plotted average electricity time series of
groups 0, 1 and 2 in category 5 and of entire category.
The results are shown in figure 3. Intuitively, both in
figure 3(a) and figure 3(b), the average electricity
time series of group 2 is covered by that of group 0.
And conversely, the mean series of group 0 is
weakened by that of group 2. Thirdly, we utilize
SPCA to analyse electricity consumption model of
category 5 in 3 weeks. The sparse principal
components derived and their corresponding daily
peak times are presented in table 2. According to the
previous analysis, households in group 2 are likely to
use power in the morning and in the first half of the
night. And again this result is less significant in
category 5. Similarly, households in group 0 use
electricity nearly all the day, but this result is
weakened.
We conclude that, compared to categorization by
social background of consumers, clustering is more
valid in analysing electricity consumption model.
Furthermore, social background of consumers cannot
fully determine their consumption model.
0
0,1
0,2
0,3
0,4
0,5
1
24
47
71
94
117
140
163
186
209
232
255
278
301
324
group 0 group 1
group 2 entire category
0
0,1
0,2
0,3
0,4
0,5
1
24
47
71
94
117
140
163
186
209
232
255
278
301
324
group 0 group 1
group 2 entire category
Electricity Consumption Model Analysis based on Sparse Principal Components
595

5 CONCLUSIONS
We have introduced a novel method for electricity
consumption model analysis, based on sparse
principal components. Experimental results show that
our method can automatically segment a day into
peak times and off-peak times, and reveals in detail
the electricity consumption model of consumers.
Additionally, experimental results tell us that social
background of consumers influences the
consumption model, but cannot fully determine it.
ACKNOWLEDGEMENTS
This work was supported by the National High
Technology Research and Development Program
(863 Program) of China (2015AA050203), NSFC
grant no. 61370157 and NSFC grant no. 61572135.
REFERENCES
Pearson, K., 1901. On Lines and Planes of Closest Fit to
Systems of Points in Space. In Philosophical Magazine.
2 (11): 559–572.
Hotelling, H., 1933. Analysis of a complex of statistical
variables into principal components. In Journal of
Educational Psychology. 24, 417–441, and 498–520.
Hotelling, H., 1936. Relations between two sets of variates.
In Biometrika. 28, 321–377.
Jolliffe, I. T., 2002. Principal Component Analysis,
Springer Verlag. New York, 2
nd
edition.
Hui, Z., Trevor, H. and Robert, T., 2006. Sparse Principal
Component Analysis. In Journal of Computational and
Graphical Statistics. 2 (15): 265-286.
Brendan, J. F. and Delbert, D., 2007. Clustering by Passing
Messages Between Data Points. In Science. 315, 972-
976.
Zigui, J., Rongheng, L., Fangchun, Y. and Qiqi, Z., 2017.
Comparing Electricity Consumer Categories Based on
Load Pattern Clustering with Their Natural Types. In
International Conference on Algorithms and
Architectures for Parallel Processing. 658-667.
L. Yu, Y. P. Li, G. H. Huang and B. G. Shan., 2017. A
hybrid fuzzy-stochastic technique for planning peak
electricity management under multiple uncertainties. In
Engineering Applications of Artificial Intelligence. 62,
252-264.
European Union, 2011. Energy 2020 - A Strategy for
Competitive, Sustainable and Secure Energy. Technical
report.
OFGEM, 2010. 2010 to 2015 Government Policy: UK
Energy Security. Policy paper, OFGEM, Department of
Energy & Climate Change, UK.
CACI, 2010. ACORN: The Smarter Consumer
Classification. Technical report, CACI, UK.
AECOM, 2011. Energy demand research project: Final
analysis. Technical report, AECOM House,
Hertfordshire, UK.
ICPRAM 2018 - 7th International Conference on Pattern Recognition Applications and Methods
596
