
Exploring BIM Data by Graph-based Unsupervised Learning
Chaoyi Jin
1
, Minyang Xu
1
, Lan Lin
2
and Xiangdong Zhou
1
1
School of Computer Science, Fudan University, Shanghai, China
2
School of Electronics and Information Engineering, Tongji University, Shanghai, China
Keywords: Graph Propagation, Unsupervised Learning, BIM Data Mining.
Abstract: This paper presents an unsupervised learning method for mining the Industry Foundation Classes (IFC) based
Building Information Modelling (BIM) data by exploring the inter-relational graph-like building spaces. In
our method, the affinity propagation clustering algorithm is adapted with our proposed feature extraction
algorithm to get exemplars of certain spaces with similar usage functions. The experiments are conducted on
a real world BIM dataset. The experimental results show that some build spaces of typical usage functions
can be discovered by our unsupervised learning algorithm.
1 INTRODUCTION
Modelling and accessing knowledge of architecture
design from the BIM (Building Information
Modeling) data is an important issue for construction
industry and some other related field including
phycology, sociology, and behaviour learning. Even
with Computer Aided Design, it is not easy to achieve
general knowledge extraction from construction data.
According to Space Syntax Theory (Hillier and
Hanson, 1989), such systems like buildings should be
regarded as discrete systems, in which indivisible
individual components act on each other through
description retrieval mechanism to form the rule of
the whole; however, the description is not carried
within these components jointly or separately. As a
result, the interactions between building components
should be learned to obtain knowledge from building
models.
The recent adoption of Building Information
Modelling (BIM) makes it easier to deal with
buildings as a whole (S. Azhar al., 2008). In BIM
representation, building related information is kept in
interlinked context rather than isolated entities. It
contains a large amount of semantic information
which is all machine-interpretable. In this paper, we
address the problem of extracting knowledge from
spaces within buildings based on the IFC (Industry
Foundation Classes, de facto standard for BIM data)
representation (T.M. Froese al., 1999). Our
techniques can be applied for retrieval, reference, and
evaluation of designing, as well as generative design
(C. Soddu, 2006).
IFCSPACE is defined in IFC as an area or volume
bounded actually or theoretically. IFCSPACEs are
designated to provide for certain functions within a
building. Our data mining is focused on the
relationship between building space structure and
functions. In general, the relationship between
building structure and functions is a philosophic
problem. Philosophers have proposed different
theories to interpret it, but it is commonly accepted
that the relationship does exist. Therefore, we take
Space Syntax Theory as our main basis, and develop
our spatial knowledge extraction model with machine
learning techniques.
Our main contributions: We present a novel
machine learning algorithm to obtain functional
knowledge from building space structures. We extract
the physical properties of each space and their
boundary relationships in BIM model (using IFC
standard ) and build several boundary graphs with
space boundary relationships. In our algorithm the
properties of each space propagate along the edges of
these graphs, we employ mathematical moments to
make the result of propagation into new features.
Based on the graph representation of building
structure, we adapt the affinity propagation algorithm
to perform building space clustering analysis, in order
to get representative samples of spaces within one or
several multi-spatial buildings.
To the best of our knowledge, this is the first
approach that is able to automatically learn spatial
design knowledge from IFC based BIM data. The
582
Jin, C., Xu, M., Lin, L. and Zhou, X.
Exploring BIM Data by Graph-based Unsupervised Learning.
DOI: 10.5220/0006715305820589
In Proceedings of the 7th International Conference on Pattern Recognition Applications and Methods (ICPRAM 2018), pages 582-589
ISBN: 978-989-758-276-9
Copyright © 2018 by SCITEPRESS – Science and Technology Publications, Lda. All rights reserved

experiments are conducted on real building BIM
models. The experimental results show that our
method is very effective for building data mining,
especially to explore the relationship between the
building space structures and the functions.
2 RELATED WORK
2.1 Machine Learning on Construction
Contemporarily, machine learning has been applied
in construction and more and more attentions are
attracted from the research and industry communities.
With monitoring devices and systems, machine
learning methods are taken upon the tasks of
architecture maintenance. G. Li al. (G. Li al., 2017)
adopt SVM in their noise elimination algorithm for
the task of bridge crack recognition and evaluation.
W. Z. Taffese and E. Sistonen (W. Z. Taffese and E.
Sistonen, 2017) conclude the recent advances and
future directions of machine learning for durability
and service-life assessment of reinforced concrete
structures. Back-propagation neural network
(BPNN), radial basis function neural network
(RBFNN), SVM, and decision tree are all adopted in
carbonation depth prediction, chloride prediction and
evaluation, and coupled transport processes in
concrete. E. Rodrigues al. (E. Rodrigues al., 2017)
use hierarchical agglomerative clustering algorithm
to cluster architectural floor plans. They present 4
sorts of shape representations of 2-D floor plans, and
compared them with the clustering results.
Learning from building data has been studied in
several perspectives. A. Henn al. (A. Henn al., 2011)
present a classifier on building types, which is based
on SVM. They use coarse low resolution data that is
wildly available as their dataset, manually labelled
them, extracted about thirty features via the functions
of spatial analysis in spatial databases with some
necessary pre-processing, and classified these
obtained samples with SVM. Z. Lun al. (Z. Lun al.,
2015) introduce a structure-transcending style
similarity measure on three-dimensional models.
They translate the presence of similarly shaped,
salient, geometric elements into an algorithmic
measure. It works well when aligned with human
perception of stylistic similarity. T. Krijnen al. (T.
Krijnen al., 2015) investigate the application of
several machine learning method on BIM models.
They use unsupervised learning to detect outliers of
the geometrical attributes of the elements in a model,
and supervised neural networks to classify floor plans
with 8 manual features.
2.2 Building Space Modelling
There are a lot of theories of modelling building
space. The most inspiring proposition for automatic
building space classification is the theory of space
syntax (B. Hillier, J. Hanson, 1984; B. Hillier, 2015).
The theory of space syntax includes a lot of
topological properties such as depth measurements,
which enable quantitative analysis on the features of
space form and functioning. T. Markus and D.
Cameron (T. Markus and D. Cameron, 2002) propose
a five-step procedure of the generation of building
space classification, in which the original discourse
comes to categories, and then to labels, to space and
form, while finally to the actual use and management
of the building space. In practice, S. Daum al. (S.
Daum al., 2014) present an approach to generating
building fingerprints automatically based on a spatial-
semantic query language for BIM. They retrieve
accessibility and adjacency relationships among
spaces in IFC models, therefore build an accessibility
graph and an adjacency graph between spaces within
a building model.
3 BUILDING SPACE
KNOWLEDGE EXTRACTION
In this section, we present our interactive algorithm to
extract features of building spaces. Our method takes
IFC files as the input. We extract IFCSPACEs and
their related properties. We learn the features of
different dimensions from the space boundary graphs.
These features can be integrated with clustering
methods to mining the knowledge of building space
design.
3.1 Properties and Boundary Graphs
of IFCSPACEs
The IFC data is organized in a structure similar to a
tree. The root node is an object of IFCPROJECT,
while the other information is distributed in its direct
and indirect child nodes. IFCSPACEs are the objects
on the lowest layer of spatial structure, with an
unfixed number of defining properties. Figure 1
shows the position of IFCSPACEs in the tree-like
structure of IFC data, and how their defining
properties are placed. Besides these properties, there
are also inter-IFCSPACE boundary relationships in
the structure. Each boundary is contributed by an
IFCSPACE and an IFCELEMENT such as an
IFCDOOR, an IFCWALL or an
Exploring BIM Data by Graph-based Unsupervised Learning
583
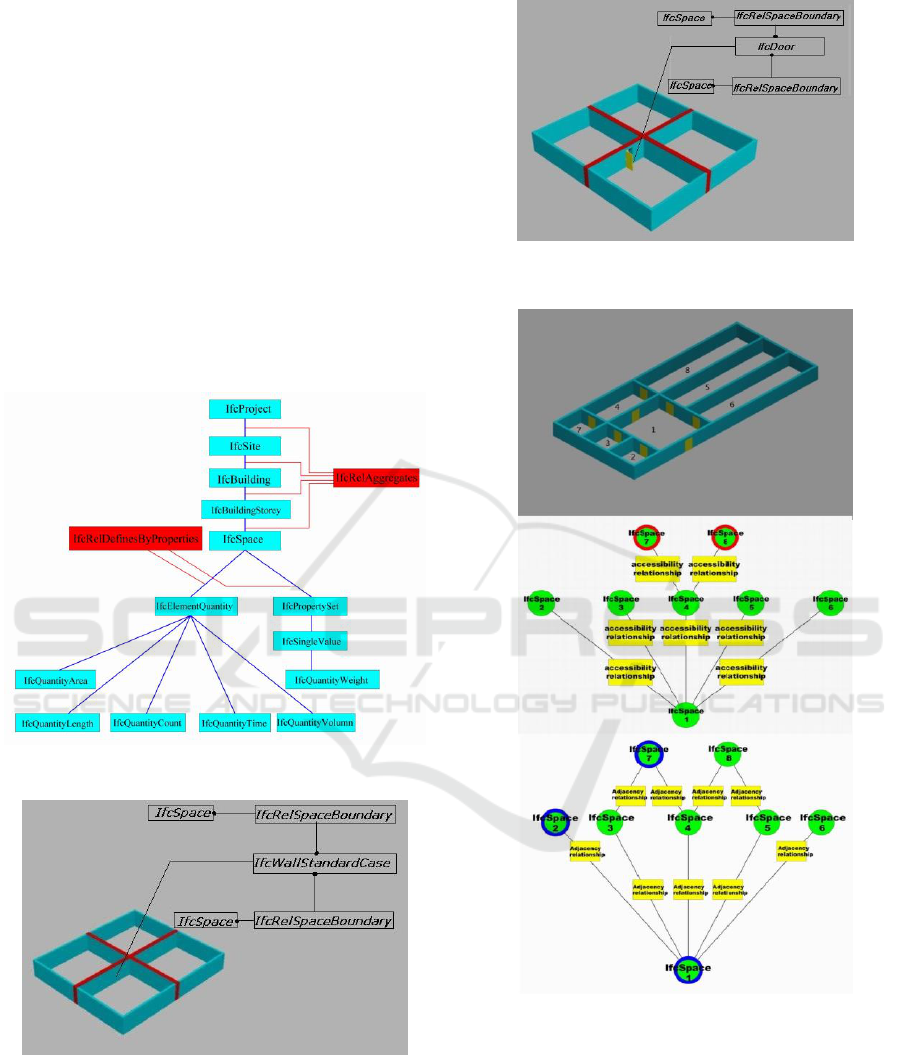
IFCVIRTUALELEMENT. In other words, it is an
IFCELEMENT that separates two IFCSPACES. By
combining boundaries sharing the same separating
IFCELEMENT, we can reduce IFCSPACEs along
with their boundary IFCELEMENTs into several
boundary relationship graphs. Primarily, each type of
space boundary element corresponds to a graph alone;
and in addition, we sum up all types of boundary
elements to make the adjacency relationship graph on
one hand, while select the types through which the
neighbouring space is accessible to make the
accessibility relationship graph on the other hand.
Figure 2 and Figure 3 show the extraction of
adjacency and accessibility relationships, and Figure
4 is an example set of spaces and their adjacency and
accessibility relationship graphs.
Figure 1: IFCSPACE in the IFC Tree-like Structure.
Figure 2: Extraction of Adjacency Relationships.
Figure 3: Extraction of Accessibility Relationships.
Figure 4: An Example Set of Spaces and Their Adjacency
and Accessibility Relationship Graphs.
3.2 Count Propagation
According to various theories, building spaces
interact with each other on determining their
functions. Therefore, we build our feature extraction
mechanism on the inter-relationships among
IFCSPACEs. With each space corresponding to a
node in every boundary relationship graph, we let the
ICPRAM 2018 - 7th International Conference on Pattern Recognition Applications and Methods
584

parameters of each space propagate along the edges.
The propagation within boundary relationship graphs
carries semantic meanings to each of the nodes, which
can be summarized in 2 dimensions:
adjacency/accessibility and count/property. These 2
dimensions come up with 4 combinations: adjacency
count propagation, accessibility count propagation,
adjacency property propagation, and accessibility
property propagation.
In count propagation, each space contributes a
count to its neighbouring space. Through different
boundary relationship types (edges in the graphs),
different semantic information is passed to the
neighbours: through IFCWINDOW edges, meaning
about openness is transported to the neighbouring
spaces; through IFCWALLSTANDARDCASE
edges, meaning about privacy is transported to the
neighbouring spaces; through IFCCURTAINWALL
edges, the transported meaning to the neighbouring
spaces is sorts of openness and privacy, to some
extent; through IFCSLAB edges, something
concerning vertical relationships such as noise
transmission and water seepage are transported; and
through total adjacency edges, meaning about the
complexity is transported to the neighbouring spaces.
The receiving space sums up the counts it receives.
We keep the radius of all types of adjacency
propagation to 1 step, which means only the direct
neighbours will be affected by one space. However,
the radius of accessibility propagation is designed to
be larger. In the space graph, semantic meanings
transport through accessible boundaries, from one
space to another, and then to the next. They may
attenuate or diffuse in the graph. The accessibility
propagation could be summarized as the expression
below:
DSR
(1)
Where S stands for the vector of source
parameters of propagation, R stands for the vector of
received parameters, and D is the matrix of diffusion
functions. We learn D from the structure of the
accessibility graph.
3.3 Propagation of Spatial Properties
By assigning spatial properties to S in expression (1),
we have some other dimensions of propagation. We
select 2 of the main properties to be propagated:
Space area and Space Circumference, for the reason
that they are various in all the spaces, and expressive
in space characteristics. Instead of summing up
received parameters simply, our receiving function is
defined with mathematical moments:
)(sMomentM
ii
. (2)
We select moment ordinals from 1 to 6. These
received parameters are mapped on different
dimensions of features describing the space. We
finally have features of 197 dimensions, including 4
simple features which are directly space properties,
and 193 other complex features as the result of inter-
spatial parameter propagation. All the features are
shown in Table1 and Table 2.
3.4 Affinity Propagation Clustering
Similar to the manner of parameter propagation in the
boundary graphs making space features, affinity
propagation is a method of clustering data with graph-
based message passing mechanism (Brendan J. Frey
and Delbert Dueck, 2007). Besides, affinity
propagation simultaneously consider all samples as
the candidate cluster centers instead of picking up
start points randomly and deciding number of clusters
at the beginning of clustering, so we adapt and
integrateit in our unsupervised algorithm,
propagating parameters about features between
building spaces, to discover potential knowledge of
them. Moreover, affinity propagation choose a
sample itself as an exemplar to represent one cluster,
thus we can explore the characteristics of a type of
spaces by analysing their exemplar. Therefore, we
apply affinity propagation on our extracted features.
Affinity propagation starts from the similarity
matrix S, where
2
),(
ki
XXjiS
(3)
And exchange 2 sorts of messages between
samples, availabilities and responsibilities. The
responsibility matrix R and the availability matrix A
iterate crossly according to the expressions below to
identify exemplars:
)',()',(max),(),(
'..'
kiskiakiskir
kktsk
(4)
),('..'
),'(,0max),(,0min),(
kiitsi
kirkkrkia
(5)
kitsi
kirkka
'..'
),'(,0max),(
(6)
Exploring BIM Data by Graph-based Unsupervised Learning
585
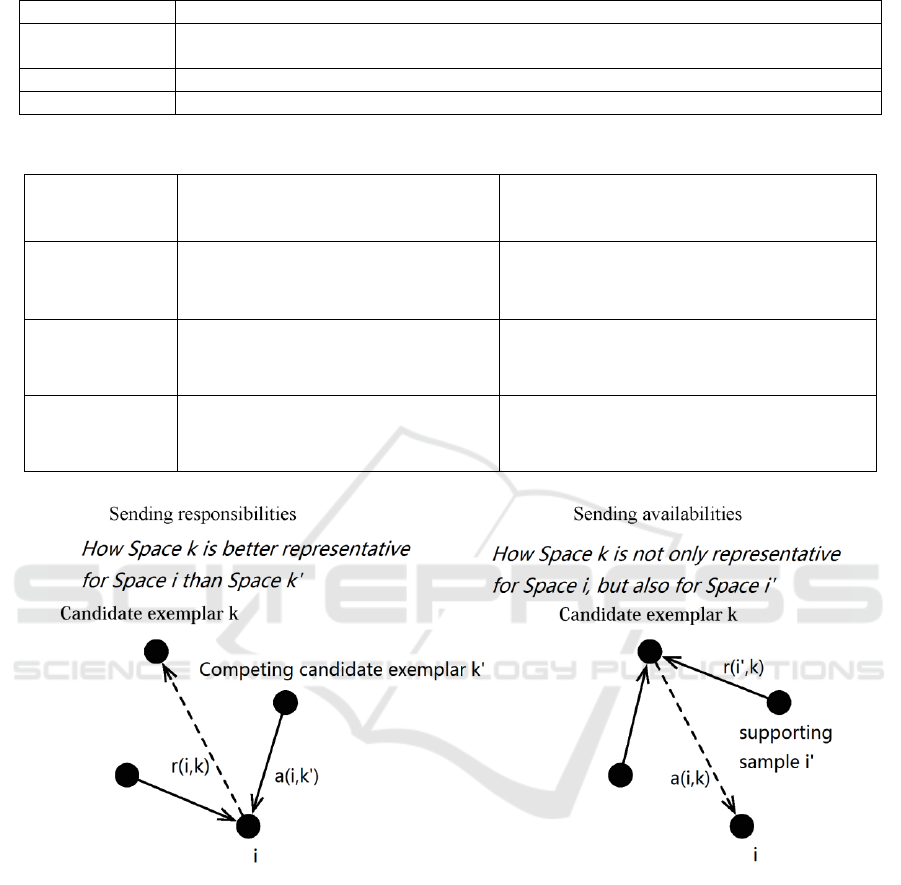
Table 1: Simple Features.
Table 2: Complex Features.
Figure 5: Affinity Propagation between Spaces.
Figure 5 illustrates the process where affinity
propagation works following feature extraction
among spaces .
4 EXPERIMENT
In this section, we use the analysis of our clustering
results on the data of a real building to demonstrate
how knowledge of building spaces is extracted from
BIM data. We use both label examination and
exemplar evaluation to assess our experiment. Two
major discoveries are made by our experiment:
1)Dense and large cluster centers are inclined to
have the same/similar labels,hence they can be
harnessed to detect mislabelling; and
2)Typical usages of the building spaces can be
extracted from the clustering results beyond/without
space labels.
Space area
Extracted from IfcPropertySingleValue“area”
Space
circumference
Extracted from IfcPropertySingleValue“circumference”
Space height
Extracted from IfcPropertySingleValue“room height”
Floor level
Extracted from IfcPropertySingleValue“level”
Numbers of boundaries of this
space
Mathematic moments of geometric
measurements of the spaces sharing
boundaries with this space
Each type of
boundary alone
BT
si
ik
ks
N
,
,
1
)(
M
,
n
,
,,
F
M
if
BT
n
si
ik
fks
Adjacency
relationships
B
s
i
s
Naj
1
)(
M
,
n
,
F
Maj
if
B
n
s
i
fs
Accessibilit
y relationships
d
ds
D
s
Nac
'
1
,
)(
M
',
n
'
,,
F
Mac
sf
D
n
d
fds
s
ICPRAM 2018 - 7th International Conference on Pattern Recognition Applications and Methods
586
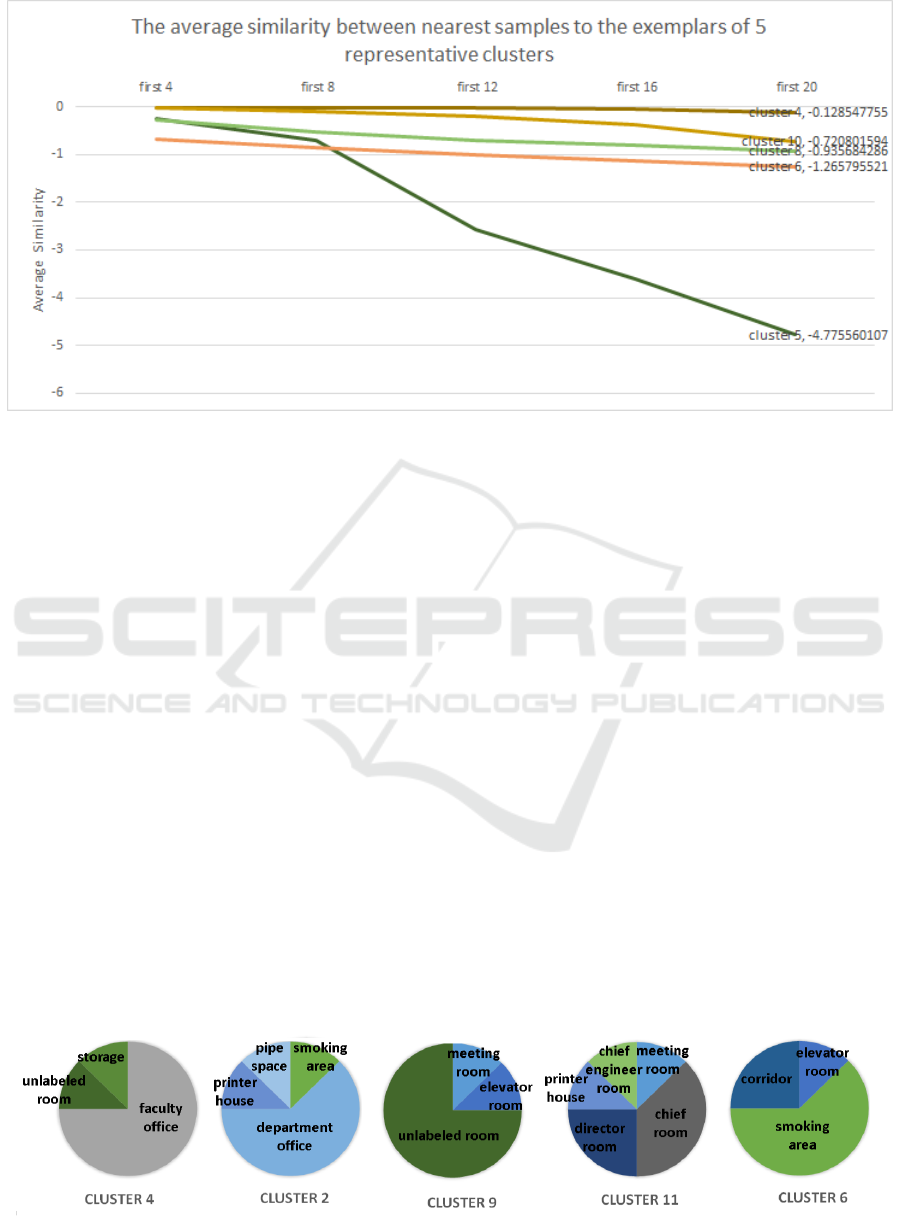
Figure 6: The Average Similarity between Nearest Samples to the Exemplars of 5 selected representative cluster.
4.1 Dataset
The dataset contains a 3D building models containing
a number of details of the indoor spaces in BIM,
which applies IFC Architecture. Our data consists of
595 spaces from a 20-storey building (Building A). In
IFC data, each IFCSPACE has a longname, which
marks the usage of the space. We use the longnames
of the IFCSPACES in our dataset as the labels of
spaces.There is quite a variety of labels in the samples
from Building A, with a fair distributionon each type.
4.2 Label Examination
We have applied our approach on Building A, which
has 595 spaces. By setting preference in affinity
propagation to -50, 11 clusters are obtained.
Longname labels of the samples are used to examine
the result of clustering. Our goal is to find exemplars
representing typical functions of building spaces, thus
we use the exemplars of each cluster to stand for a
type of function; besides, we believe the samples with
most similarities with the exemplars are also sorts of
representatives of the cluster.
Figure 6 shows the density and the scale of the
cluster center near exemplars. The higher the
similarity curve locates, the denser the cluster center
is; the earlier the similarity curve goes down, the
smaller the cluster center turns to be. The cluster 4 is
a typical that has both dense and large center, while
cluster 10 stands for those who have dense centers
small in size. Cluster 8 and 6 have less dense but large
centers. Cluster 5 is rather worse judged by these 2
measurements. Figure 7 shows the composition of
space usage labels of the first 8 samples near
exemplars including exemplars themselves in each
cluster. The cluster 4, 2 and 9 are dominated by
faculty offices, department offices, and unlabelled
rooms. Chief offices and director offices are the
theme of the cluster 11. The cluster 6 is majorly
smoking areas, while the other clusters has a more
diverse composition of their cluster centers. This
proves our evaluating criterion of clustering: the
denser and larger the cluster center is, the better the
exemplar represents spaces of a certain function.
Figure 7: The Composition of Space Usage Labels of 5 Representative Cluster.
Exploring BIM Data by Graph-based Unsupervised Learning
587
4.3 Exemplar Evaluation
Our unsupervised learning method is designed to find
a way describing the hidden structure of building
spaces, so other than label examination, it is more
appealing to expect what could be learned without
labels or beyond labels, expressing undiscovered
knowledge about building spaces. By studying
exemplars and the samples with most similarities in
their clusters, we get several typical building spaces
from our learning results.
The 3 typical functional spaces below correspond
to the cluster 11, 4, and 6, which enjoy dense and
large cluster centers. Difference between “offices” is
found between cluster 11 and 4, as the difference
between senior offices and open offices. On the other
hand, it is found that chief offices and director offices
share a lot of similarities, for which they could be
considered as a same type on some occasions. And
the cluster 6 tells us there is something common
among elevator rooms, smoking areas, corridors, and
open working spaces. These offer us the knowledge
of demarcating spatial functions rather than labels.
With the clustering we can predict the function or
guide the usage of unlabelled spaces: for instance, the
most of the unlabelled room in cluster 9 can be
assigned the labels of a sort of public space.The
density and large scale of its cluster center enable us
to specify the unlabelled spaces in it according to their
labelled cluster mates. Generally, we study the
exemplar and the samples close to it obtained in each
cluster, choosing the features they have in common
most (least distances on those dimensions) as their
most salient structural characters.
The mining results:
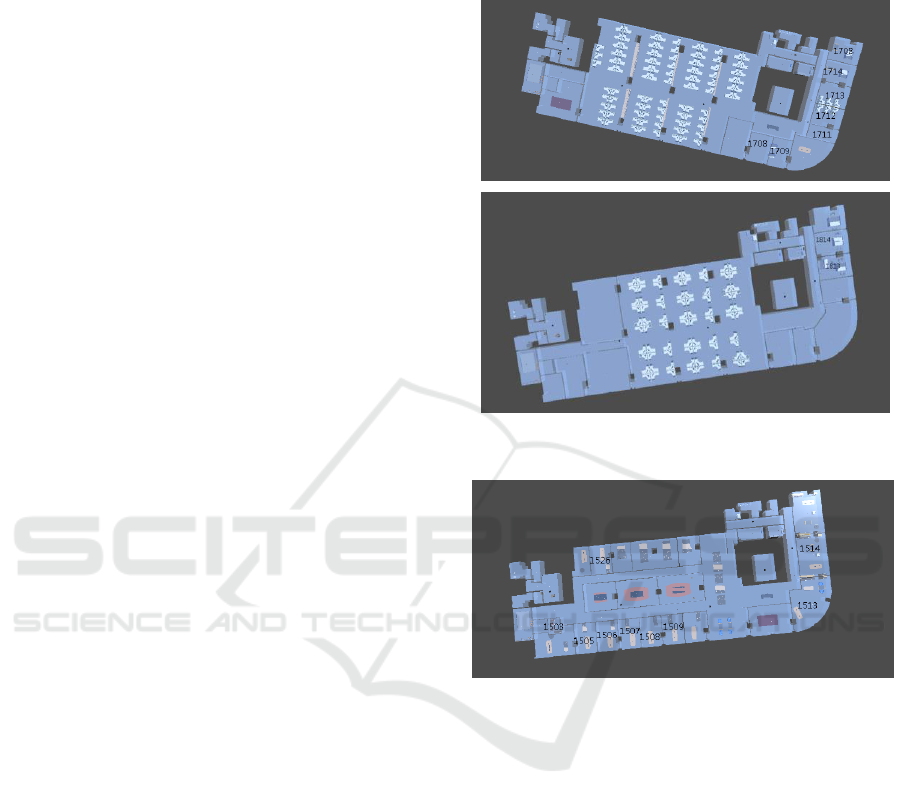
Senior Offices
Our method has found some extent of
isomorphism between the 17
th
floor and the 18
th
floor
of Building A in our data set. As shown in Figure 8,
the spaces along the right curve are all spaces
functioning as senior offices. They are quite
independent, with only one door connecting with the
outer spaces, high floor levels and windows providing
a good sight and mood, and close distances to
elevators through the corridor. Independence, sight,
and convenience can thus be employed as the key
words describing this type of usage.
Open Offices
Some offices are designated to opening usages,
e.g. public visits, agencies, and receptions. Such open
offices which mostly stand for this are shown in
Figure 9 marked in black. They have larger degrees
of adjacency and accessibility, which imply
openness.
Figure 8: Senior Offices.
Figure 9: Open Offices.
Circulation Spaces
Circulation spaces are distributed in a number of
stories, with various sizes, but all public. They can be
accessible from a lot of neighbouring spaces, and
function as the connecting, transitional, and sorts of
recreational (such as smoking area) spaces. Some
samples of this cluster are shown in Figure 10 marked
in red, including elevator rooms, smoking areas,
corridors, and small open working areas.
ICPRAM 2018 - 7th International Conference on Pattern Recognition Applications and Methods
588
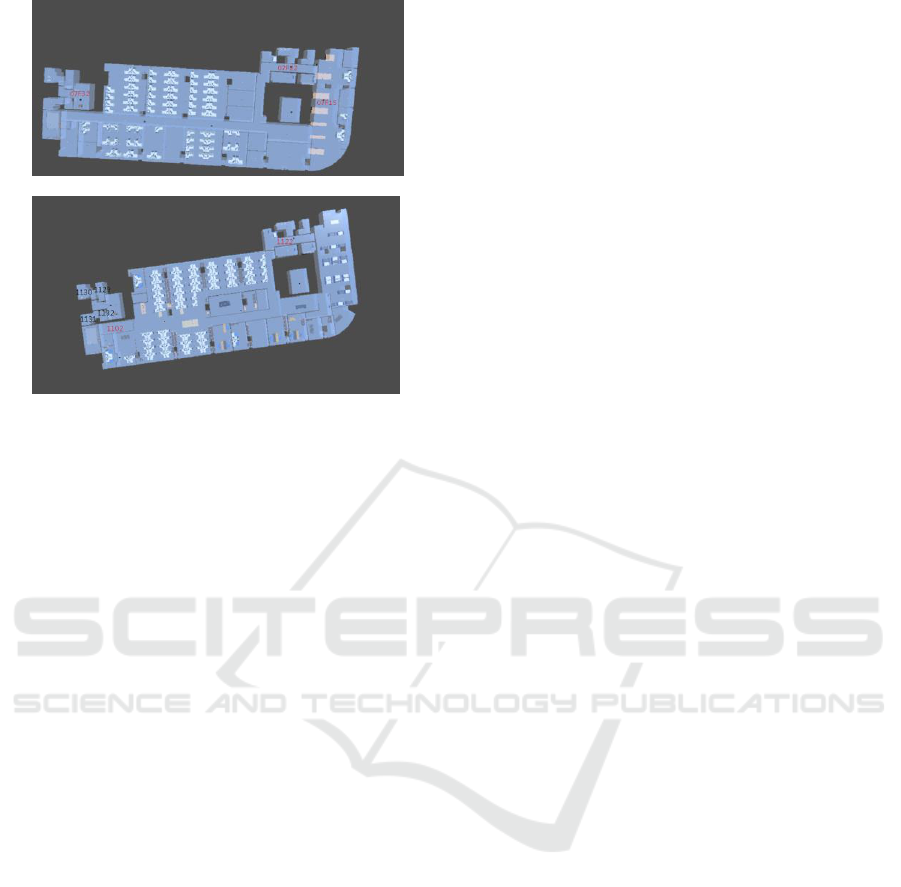
Figure 10: Circulation Spaces.
5 CONCLUSIONS
We present a novel machine learning method for BIM
model mining. An interactive algorithm is proposed
to get features of inter-relational graph-like building
spaces, and these parameters are propagated along
edges of the graph to generate features. These features
are expressive of describing the structure of building
spaces. We apply the unsupervised affinity
propagation clustering algorithm to mining the
exemplars of typical spatial functions based on the
above feature representation. To the best of our
knowledge, this is the first work that intends to
mining the IFC based BIM data for the relationship
between functional spaces and architecture design.
ACKNOWLEDGEMENTS
This work was supported by the National High
Technology Research and Development Program
(863 Program) of China (2015AA050203), NSFC
grant no. 61373106 and Shanghai Science and
Technology Innovation Program 17DZ1203600.
REFERENCES
Bill Hillier and Julienne Hanson, 1989. The Social Logic of
Space, Cambridge University Press, Reprint edition
(January 27, 1989).
S. Azhar al., 2008. Building Information Modeling (BIM):
A New Paradigm for VisualInteractiveModeling and
Simulation for Construction Projects. In August 4-5,
2008, Karachi, Pakistan, First International
Conference on Construction in Developing Countries
(ICCIDC–I). “ Advancing and Integrating
Construction Education, Research & Practice”
T.M. Froese al., 1999. Industry foundation classes for
project management - A trial implementation.In
Electronic Journal of Information Technology in
Construction 4,pages 17–36.
C. Soddu, 2006. Generative Design. A swimmer in a natural
sea frame.In GA2006, IX Generative Art International
Conference.
Gang Li and Xiaoxing Zhao and Kai Du and
FengRuandYubo Zhang Thomas A. Markus and
Deborah Cameron ,2017.Recognition and evaluation of
bridge cracks with modified active contourmodel and
greedy search-based support vector machine. In
Automation in Construction Volume 78, June
2017,pages 51–61.
W. Z. Taffese and E. Sistonen ,2017. Machine learning for
durability and service-life assessment of
reinforcedconcrete structures: Recent advances and
future directions. In Automation in Construction
Volume 77, May 2017,pages 1–14.
E. Rodrigues al. 2017. A comparison of shape
representations.In Automation in Construction Volume
80, August 2017,pages 48–65.
A. Hennal ,2011. Automatic classification of building types
in 3Dcity models. In GeoInformatica April 2012,
Volume 16, Issue 2,pages281–306.
Lunal. ,2015.Elements of Style: Learning Perceptual Shape
Style Similarity. In ACM Transactions on Graphics
(Proc. ACM SIGGRAPH 2015).
T. Krijnenal ,2015.Assessing implicit knowledge in BIM
models with machine learning. In Design Modelling
Symposium Copenhagen .
B. Hillier, 2007.Space is the machine: A configurational
theory of architecture, CreateSpace Independent
Publishing Platform. Charleston, April 12, 2015.
T. Markus and D. Cameron ,2002. The Words Between the
Spaces Buildings and Language.Routledge.London and
New York, 1 edition (1707).
S. Daum al.,2014. Automated generation of building
fingerprints using a spatio-semantic query language for
building information models. In eWork and eBusiness
in Architecture, Engineering and Construction:
ECPPM 2014, Vienna, Austria, 2014.
Brendan J. Frey and Delbert Dueck, 2007.Clustering by
Passing Messages Between Data Points.In SCIENCE
VOL 315, FEBRUARY 2007.
Hermann, S. and Klette, R, 2013. Iterative semi-
globalmatching for robust driver assistance systems.In
Asian Conference on Computer Vision.
Exploring BIM Data by Graph-based Unsupervised Learning
589
