
Evaluation of Radiomic Features Stability When Deformable Image
Registration Is Applied
Kuei-Ting Chou
1
, Kujtim Latifi
2
, Eduardo G. Moros
2
, Vladimir Feygelman
2
, Tzung-Chi Huang
1
,
Thomas J. Dilling
2
, Bradford Perez
2
and Geoffrey G. Zhang
2,*
1
Department of Biomedical Imaging and Radiological Science, China Medical University, Taichung, Taiwan
2
Radiation Oncology, Moffitt Cancer Center, Tampa, FL, U.S.A.
Keywords: Radiomic Features, Deformable Image Registration, Stability.
Abstract: Radiomic features are currently being evaluated as potential imaging biomarkers. Deformable image
registration (DIR) is now routinely applied in many medical imaging applications. Usually, DIR is applied
in one of two ways: a) mapping the surface of a contoured volume, or b) mapping the image intensities. This
study investigated radiomic feature stability when DIR is applied in these two ways using four dimensional
computed tomography (4DCT) data. DIR was applied between the inspiration and expiration phases of
4DCT datasets. Radiomic features were extracted from (1) the expiration phases of 25 lung cancer 4DCT
datasets within the contoured tumor volumes, (2) the inspiration phases with the mapped tumor volumes,
and (3) the inspiration phases deformed to the corresponding expiration phases of the original contoured
volumes. The mean variation and the concordance correlation coefficient (CCC) between these 3 sets of
features were analyzed. Many features were found unstable (mean variation > 50% or CCC < 0.5) when
DIR was applied in either way. Caution is needed in radiomic feature applications when DIR is necessary.
1 INTRODUCTION
Medical images play important roles in cancer
diagnosis, radiation treatment planning, and outcome
evaluation. Recently, an image analysis field, known
as radiomics, gained focus in the hopes of obtaining
more clinically useful information from medical
images. Radiomic features are quantitative values
extracted from the digital images, and show
potential as imaging biomarkers (Fave et al., 2017,
Nardone et al., 2016). The feature values are usually
calculated within a region of interest (ROI) in a 3-
dimentional (3D) image set. One of the most
important ROIs in radiation therapy is the gross
tumor volume (GTV).
The feature extraction concept was recently
expanded to images acquired at different times, for
treatment response evaluation and outcome analysis
(Antunes et al., 2016, Cunliffe et al., 2015, Yip et
al., 2016). Image registration, most often
deformable, is by definition required to properly
align two separate datasets for comparison.
Deformable image registration (DIR) has matured
and is now a staple in radiotherapy, including, but
not limited to, adaptive treatment planning (Gao et
al., 2006) and pulmonary ventilation calculations
(Huang et al., 2013). In the radiomics realm, when
two datasets are being compared, the features can be
extracted following either just the deformed contour
propagation or full image deformation. For example,
deformed and aligned images were used to extract
features for early evaluation of renal cell carcinoma
treatments (Antunes et al., 2016), and propagated
contours were employed in feature extraction for
lung and esophagus cancer treatment outcome
predictions (Yip et al., 2016, Cunliffe et al., 2015).
At the same time, it is important to understand
the limitations of radiomic features before they are
used clinically. Multiple studies have attempted to
elucidate the behavior of radiomic features under
different conditions. Many factors can potentially
affect the features’ values, including image quality
(Oliver et al., 2017), voxel size (Shafiq-ul-Hassan et
al., 2017), motion (Carles et al., 2017, Oliver et al.,
2015), segmentation (Balagurunathan et al., 2014),
or acquisition and reconstruction parameters
(Galavis et al., 2010), to name a few. When DIR is
involved as an extra step in radiomic feature
extraction, it begs a simple question: does DIR affect
the feature values, and if so by how much?
Chou, K-T., Latifi, K., Moros, E., Feygelman, V., Huang, T-C., Dilling, T., Perez, B. and Zhang, G.
Evaluation of Radiomic Features Stability When Deformable Image Registration Is Applied.
DOI: 10.5220/0006694301530158
In Proceedings of the 11th International Joint Conference on Biomedical Engineering Systems and Technologies (BIOSTEC 2018) - Volume 2: BIOIMAGING, pages 153-158
ISBN: 978-989-758-278-3
Copyright © 2018 by SCITEPRESS – Science and Technology Publications, Lda. All rights reserved
153

Feature stability after image registration was
evaluated by Cunliffe et al., (2012) using propagated
contours. They evaluated the accuracy of features
with different registration methods, including rigid,
affine and deformable, and concluded that DIR gave
the most accurate values. That study contributed to
our understanding of DIR’s effect on image features.
However, the feature stability when the deformed
pixel values are used, rather than just the propagated
ROI masks, was not addressed. Also the number of
features in that work was relatively small (140).
The objective of our study was to analyze and
compare feature stability between the two DIR
approaches for more than 1000 radiomic features.
2 MATERIALS AND METHODS
2.1 Image Data
Twenty-five randomly selected lung cancer cases
were studied retrospectively. In each case, the end-
inspiration and end-expiration phases from a 10-
phase 4-dimensional CT (4DCT) dataset were used.
4DCT scans followed a standard clinical protocol,
hence the voxel size, kVp and mAs settings were
kept constant. All CT numbers were converted to
positive values, with air corresponding to 0 and soft
tissue to ~1000. The lung GTVs were manually
segmented (contoured) on the end-expiration phase
by an oncologist. The median contoured GTV was
6.5 cm
3
, ranging between 0.8 and 46.5 cm
3
.
2.2 Deformable Image Registration
Based on previous evaluations (Latifi et al., 2013b,
Latifi et al., 2013a), the diffeomorphic morphons
(DM) DIR algorithm (Janssens et al., 2011,
Wrangsjö et al., 2005) was selected for this study
because of its relatively high registration accuracy in
the thoracic region. The DIR program was
implemented in MatLab (The MathWorks, Natick,
MA, USA) with an iterative and multiscale scheme.
Eight scales were used for each registration, with up
to 20 iterations at each one. A deformation matrix
obtained in the registration process was applied to
deform and align the images and map the contoured
tumor volume from one dataset to another. Both the
original and propagated contoured volumes were
used as masks to extract features from the
corresponding image datasets. Linear interpolation
was applied when volume expansion or compression
occurred.
2.3 Feature Extraction
An in-house program implemented on a PC (Oliver
et al., 2015, Shafiq-ul-Hassan et al., 2017) extracted
image features from inside the contoured volumes.
The feature categories were shape, intensity, textural
(based on the gray level co-occurrence matrix
(GLCM) (Haralick et al., 1973, Liang, 2012), the
gray-level size zone matrix (GLSZM) (Thibault et
al., 2009), the run-length matrix (RLM) (Galloway,
1975, Chu et al., 1990), the neighborhood gray-tone
difference matrix (NGTDM) (Amadasun and King,
1989)), fractal dimension (FD) (Sarkar and
Chaudhuri, 1992, Jin et al., 1995), Laplacian of
Gaussian (LoG) (Chen et al., 1987), wavelets
(Uytterhoeven et al., 1997), and Laws (Suzuki and
Yaginuma, 2007), for a grand total of 1007 features.
The shape-based features included short axis
(through center of mass, COM), long axes through
COM and free, sphericity, eccentricity, convexity,
etc. As many features were volume and/or gray level
dependent (Shafiq-ul-Hassan et al., 2017), volume
normalized features (Vnorm) as well as gray level
normalized features (Gnorm) were also extracted.
Originally, some of the features were based on
2D images. However, the in-house program was
implemented to extract all features in 3D. The
feature calculations on the transformed, or filtered,
images (e.g., LoG, wavelets, Laws) were performed
according to Ref. (Aerts et al., 2014). LoG features
were extracted with various Gaussian kernel widths.
The kernel width used in this study varied from 0.5
to 3 mm with a step size of 0.5 mm. Discrete
wavelet transform was applied to the original images
and the wavelet features (intensity-based), were
extracted from the filtered images. The combination
of low pass (L) and high pass (H) filters in 3
directions generated 8 sub-categories of features. For
Laws features, combination of Local (L), Edge (E)
and Spot (S) convolution kernels were applied to 3D
datasets before extracting the intensity features. For
the Laws features, the combination of 3 kernels in
3D generated 27 sub-categories of features.
To evaluate the stability of the two possible
extraction approaches (e.g., image registration vs.
mapped contours), the GTV contour was mapped
from the expiration to inspiration phase (Ctr
map
in
Fig.1) and the inspiration phase image was deformed
to align with the expiration phase (Img
def
). The
feature values extracted from inside the ROI volume
on the expiration phase (Feature
orig
) were set as
standards, as both the image set and the contoured
volume were the originals. The feature values
extracted from the data sets after the DIR
BIOIMAGING 2018 - 5th International Conference on Bioimaging
154
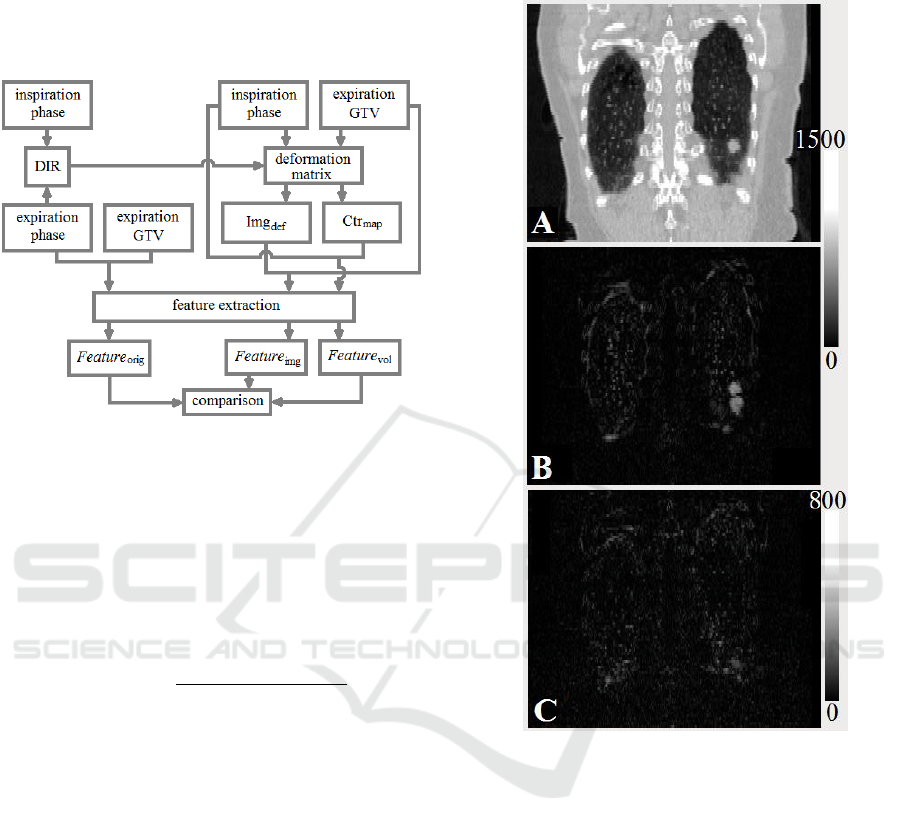
(Feature
DIR
), which included the mapped volume on
the inspiration phase (Feature
vol
) and the features
from the original contoured volume on the deformed
inspiration phase aligned with the expiration phase
(Feature
img
), were compared to the standard values.
Figure 1: Analysis flow chart. Ctr
map
= mapped contour;
Img
def
= deformed image; Feature
orig
= original feature,
set as standard; Feature
img
= features extracted from the
deformed image; Feature
vol
= features extracted from the
mapped volume.
2.4 Feature Stability Analysis
Percentage differences between features after DIR
and the standard ones were calculated as
%𝐷𝑖𝑓𝑓 = 100×|
𝐹𝑒𝑎𝑡𝑢𝑟𝑒
DIR
−𝐹𝑒𝑎𝑡𝑢𝑟𝑒
orig
𝐹𝑒𝑎𝑡𝑢𝑟𝑒
orig
|,
(1)
where Feature
DIR
is the corresponding feature value
with the DIR, either Feature
vol
or Feature
img
. The
percentage differences were averaged for each
feature across all cases.
The concordance correlation coefficient (CCC)
measures the reproducibility between two datasets
(Lin, 1989). The CCC values are between 0 and ±1,
with 0 being no correlation at all and ±1 being
perfect concordance or perfect discordance. The
CCC values were calculated for each feature
between the standard, Feature
orig,
and one of the two
sets after the DIR, either Feature
vol
or Feature
img
.
The features with average variation greater than
50% or CCC lower than 0.5 were considered
unstable, while the ones with average variation <
20% and CCC > 0.85 were categorized as
acceptable. The rest were considered uncertain.
Within the acceptable group the ones with variation
< 10% and CCC > 0.9 were considered stable, and
those with average variation < 5% and CCC > 0.95
were labeled as robust.
3 RESULTS
Figure 2: Example of image registration: (A) expiration
phase, (B) absolute difference between expiration and
inspiration, and (C) absolute difference between expiration
and deformed and aligned inspiration-to-expiration.
Figure 2 shows an example of image registration.
Notice different intensity scales between A, B
(0~1500) and C (0~800). Without the scale
adjustment, differences on panel C would not be
visible. Overall, the differences between the mapped
images and the expiration phase images were small.
Table 1 shows the overall percentage stable
features for one of the two DIR approaches: mapped
contour (Ctr
map
) and Table 2 shows those for the
other approach: deformed image (Img
def
). Because
the same contour was used in the mapped image
feature calculation, the shape based features in this
category are 100% stable/robust. Features from the
categories of intensity, GLCM and FD are stable for
both DIR approaches. Relatively more wavelet
Evaluation of Radiomic Features Stability When Deformable Image Registration Is Applied
155
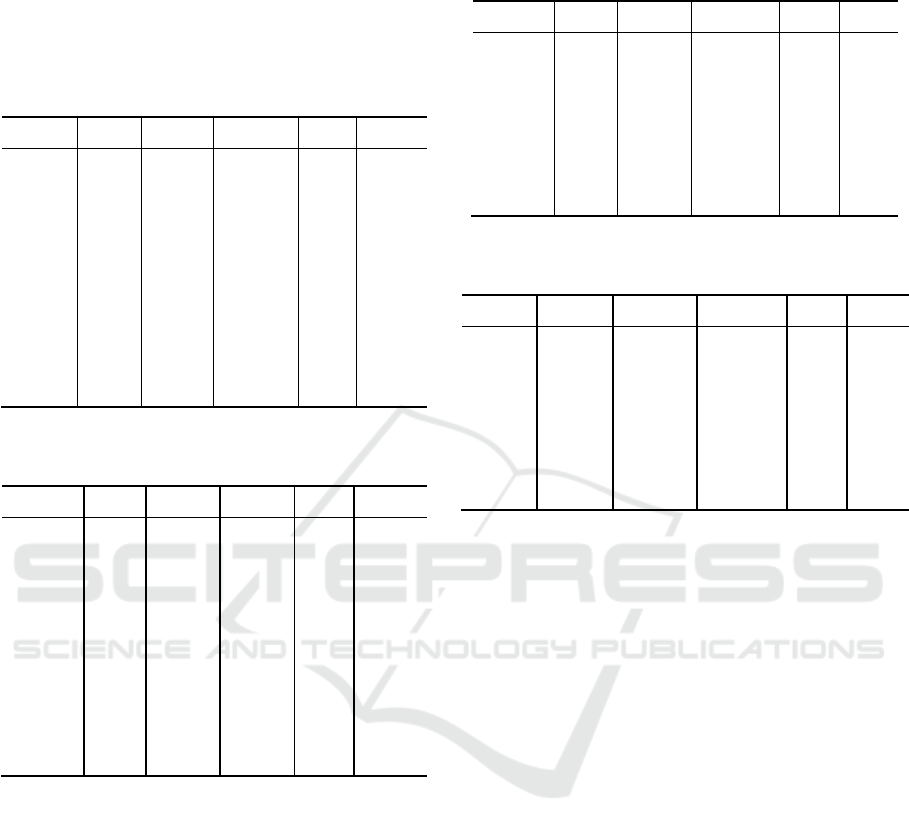
features also were stable, while Laws features were
the most unstable group for the filtered image
features. The overall most unstable feature group
was GLSZ.
Table 1: Percentage of features in various groups for
mapped contour, Ctr
map
.
Unstable
Uncertain
Acceptable
Stable
Robust
Shape
30%
55%
15%
5%
0%
Intensity
5%
32%
63%
45%
16%
LoG
31%
21%
48%
38%
21%
Wavelet
23%
42%
35%
24%
12%
Laws
51%
28%
22%
9%
2%
GLCM
3%
30%
68%
40%
5%
RLM
18%
35%
47%
12%
0%
GLSZ
67%
17%
17%
17%
8%
NGTDM
45%
45%
9%
0%
0%
FD
0%
50%
50%
38%
13%
Table 2: Percentage of features in various groups for
deformed image, Img
def
.
Unstable
Uncertain
Acceptable
Stable
Robust
Shape
0%
0%
100%
100%
100%
Intensity
3%
50%
47%
47%
45%
LoG
28%
36%
36%
16%
9%
Wavelet
2%
12%
86%
68%
39%
Laws
53%
32%
15%
7%
2%
GLCM
5%
38%
57%
28%
20%
RLM
18%
35%
47%
29%
6%
GLSZ
75%
8%
17%
17%
0%
NGTDM
64%
0%
36%
9%
0%
FD
0%
0%
100%
100%
75%
Table 3 shows some results of the detailed
analysis of the filtered image features sub-categories
for mapped contour. Table 4 shows those for
deformed image. In the table, LoG_1 means the
features in this sub-category were extracted with
Gaussian kernel width of 1 mm, and so on. Similar
analysis was performed on the Laws and wavelet
features (not presented).
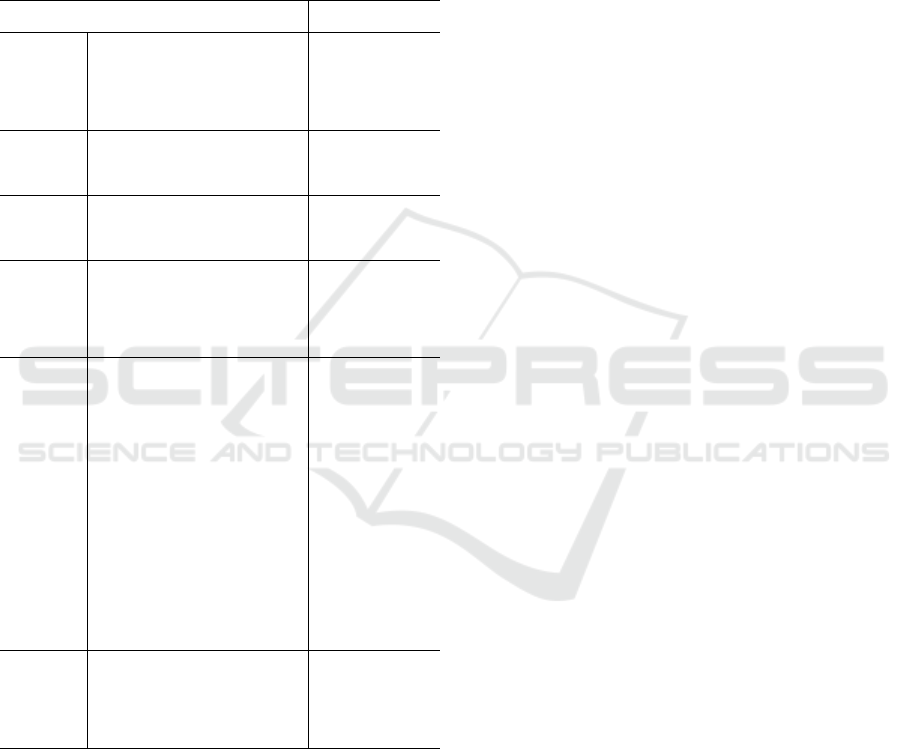
Table 5 lists the unstable features, excluding
those from the filtered images (i.e. LoG, wavelet,
Laws). For the filtered images, the numbers of
unstable features were 339 for Img
def
and 364 for
Ctr
map
out of 861. Among the LoG and Laws
features, energy was the most unstable one in each
sub-category.
Table 3: Percentage of LoG features in sub-categories for
mapped contour.
Unstable
Uncertain
Acceptable
Stable
Robust
LoG_0.5
0%
24%
76%
62%
29%
LoG_1
33%
19%
48%
38%
33%
LoG_1.5
43%
19%
38%
29%
5%
LoG_2
43%
19%
38%
19%
10%
LoG_2.5
33%
24%
43%
33%
33%
LoG_3
33%
19%
48%
48%
14%
Table 4: Percentage of LoG features in sub-categories for
deformed image.
Unstable
Uncertain
Acceptable
Stable
Robust
LoG_0.5
10%
14%
76%
52%
29%
LoG_1
33%
62%
5%
5%
5%
LoG_1.5
33%
57%
10%
5%
5%
LoG_2
38%
52%
10%
10%
5%
LoG_2.5
33%
19%
48%
10%
5%
LoG_3
19%
14%
67%
14%
5%
4 DISCUSSION
The feature variations observed after DIR can be the
result of the deformation itself and/or DIR errors.
Image deformation could change the voxel intensity
relationships between neighboring voxels which in
turn changes the feature values. In addition, the
shape of the mapped volume is likely to differ from
the original one, which changes the shape based
feature values, such as the sphericity, compactness,
convexity, etc. The DIR errors introduce further
uncertainty. This study did not attempt to separate
these two potential causes of variation.
To reduce the DIR errors, we used the 4DCT
data, wherein the differences between the phases
should be much smaller than differences arising
from the use of dissimilar imaging modalities.
However, due to the raw scan data being divided
into multiple phase bins, the quantum noise in each
phase is higher compared to the standard (3D) data
set, which in turn may reduce the accuracy of DIR.
As both DIR accuracy and feature values depend on
image quality (Latifi et al., 2013a, Oliver et al.,
2017), high quality images are essential for feature
stability.
Since image feature stability depends on the
registration algorithm accuracy (Cunliffe et al.,
BIOIMAGING 2018 - 5th International Conference on Bioimaging
156
2012), any DIR algorithm for applications in feature
calculation should be evaluated first. This study was
limited to one DIR algorithm.
Table 5: Unstable features. In the table,
*
Angle between
short axis and xz plane; angle between short axis and free
long axis; angle between free long axis and long axis
through center of mass;
**
Vnorm = coarseness and volume
normalized coarseness, 2 features;
**
V, Gnorm = texture
strength, volume normalized and gray level normalized
texture strength, 3 features.
Feature
Ctr
map
Img
def
Shape
Angle: short to xz
*
X
Angle: short to long
*
X
Angle: long to long COM
*
X
Intensity
skewness
X
X
energy
X
GLCM
correlation
X
cluster shade
X
X
RLM
LGRE
X
X
SRLGE
X
X
LRLGE
X
X
GLSZ
SAE
X
X
LAE
X
LIE
X
X
LISAE
X
X
HISAE
X
X
LIHAE
X
X
HILAE
X
X
IV
X
X
HIE
X
X
NGTDM
coarseness, Vnorm
**
X
busyness
X
X
texture strength, V, Gnorm
**
X
X
The DIR-stable features varied significantly
between clinical cases, or were sensitive to different
conditions. For example, the intensity based entropy
was robust with both DIR approaches (mean
variation less than 5% in each case), but it varied up
to 80% between the cases. Further clinical
application studies may need to focus on those
acceptable features when DIR is involved.
Many feature values are voxel size dependent
(Shafiq-ul-Hassan et al., 2017). In this study, the
comparison was performed between the two phases
of the 4D same dataset, with no voxel size variation.
The definition of unstable features in this work
was strict (mean variation > 50% or CCC < 0.5).
Any feature falling into this category (listed in Table
5 for the unfiltered image features) should be really
unstable and thus avoided in in the presence of DIR.
This study only used CT image data. However,
due to the nature of DIR, the conclusions should be
applicable to other imaging modalities as well.
5 CONCLUSIONS
We have investigated the impact of DIR on radiomic
features after either contour propagation or image
deformation. Deformable image registration
modified radiomic features with either approach.
The stability varied slightly with the way the DIR is
applied for most of the feature categories. Many
features varied significantly after DIR, and thus
were categorized as unstable. Those features should
be avoided in applications requiring DIR.
REFERENCES
Aerts, H. J. W. L., Velazquez, E. R., Leijenaar, R. T. H.,
Parmar, C., Grossmann, P., Carvalho, S., Bussink, J.,
Monshouwer, R., Haibe-Kains, B., Rietveld, D.,
Hoebers, F., Rietbergen, M. M., Leemans, C. R.,
Dekker, A., Quackenbush, J., Gillies, R. J. & Lambin,
P. 2014. Decoding Tumour Phenotype By
Noninvasive Imaging Using A Quantitative Radiomics
Approach. Nature Communications, 5, 4006.
Amadasun, M. & King, R. 1989. Textural Features
Corresponding To Textural Properties. Ieee
Transactions On Systems, Man, And Cybernetics, 19,
1264-1274.
Antunes, J., Viswanath, S., Rusu, M., Valls, L., Hoimes,
C., Avril, N. & Madabhushi, A. 2016. Radiomics
Analysis On Flt-Pet/Mri For Characterization Of Early
Treatment Response In Renal Cell Carcinoma: A
Proof-Of-Concept Study. Translational Oncology, 9,
155-162.
Balagurunathan, Y., Gu, Y., Wang, H., Kumar, V., Grove,
O., Hawkins, S., Kim, J., Goldgof, D. B., Hall, L. O.,
Gatenby, R. A. & Gillies, R. J. 2014. Reproducibility
And Prognosis Of Quantitative Features Extracted
From Ct Images. Translational Oncology, 7, 72-87.
Carles, M., Torres-Espallardo, I., Alberich-Bayarri, A.,
Olivas, C., Bello, P., Nestle, U. & Martí-Bonmatí, L.
2017. Evaluation Of Pet Texture Features With
Heterogeneous Phantoms: Complementarity And
Effect Of Motion And Segmentation Method. Physics
In Medicine And Biology, 62, 652.
Evaluation of Radiomic Features Stability When Deformable Image Registration Is Applied
157

Chen, J. S., Huertas, A. & Medioni, G. 1987. Fast
Convolution With Laplacian-Of-Gaussian Masks. Ieee
Transactions On Pattern Analysis And Machine
Intelligence, Pami-9, 584-590.
Chu, A., Sehgal, C. M. & Greenleaf, J. F. 1990. Use Of
Gray Value Distribution Of Run Lengths For Texture
Analysis. Pattern Recognition Letters, 11, 415-419.
Cunliffe, A., Armato Iii, S. G., Castillo, R., Pham, N.,
Guerrero, T. & Al-Hallaq, H. A. 2015. Lung Texture
In Serial Thoracic Computed Tomography Scans:
Correlation Of Radiomics-Based Features With
Radiation Therapy Dose And Radiation Pneumonitis
Development. International Journal Of Radiation
Oncology Biology Physics, 91, 1048-1056.
Cunliffe, A. R., Al-Hallaq, H. A., Labby, Z. E., Pelizzari,
C. A., Straus, C., Sensakovic, W. F., Ludwig, M.,
Armato, S. G. & Iii 2012. Lung Texture In Serial
Thoracic Ct Scans: Assessment Of Change Introduced
By Image Registration. Med Phys, 39, 4679-4690.
Fave, X., Zhang, L., Yang, J., Mackin, D., Balter, P.,
Gomez, D., Followill, D., Jones, A. K., Stingo, F. &
Liao, Z. 2017. Delta-Radiomics Features For The
Prediction Of Patient Outcomes In Non-Small Cell
Lung Cancer. Scientific Reports, 7, 588.
Galavis, P. E., Hollensen, C., Jallow, N., Paliwal, B. &
Jeraj, R. 2010. Variability Of Textural Features In Fdg
Pet Images Due To Different Acquisition Modes And
Reconstruction Parameters. Acta Oncologica, 49,
1012-1016.
Galloway, M. M. 1975. Texture Analysis Using Gray
Level Run Lengths. Computer Graphics And Image
Processing, 4, 172-179.
Gao, S., Zhang, L., Wang, H., Crevoisier, R. D., Kuban,
D. D., Mohan, R. & Dong, L. 2006. A Deformable
Image Registration Method To Handle Distended
Rectums In Prostate Cancer Radiotherapy. Med Phys,
33, 3304-3312.
Haralick, R. M., Shanmugam, K. & Dinstein, I. H. 1973.
Textural Features For Image Classification. Systems,
Man And Cybernetics, Ieee Transactions On, Smc-3,
610-621.
Huang, T.-C., Hsiao, C.-Y., Chien, C.-R., Liang, J.-A.,
Shih, T.-C. & Zhang, G. 2013. Imrt Treatment Plans
And Functional Planning With Functional Lung
Imaging From 4d-Ct For Thoracic Cancer Patients.
Radiat Oncol, 8, 3.
Janssens, G., Jacques, L., Orban De Xivry, J., Geets, X. &
Macq, B. 2011. Diffeomorphic Registration Of Images
With Variable Contrast Enhancement. International
Journal Of Biomedical Imaging, 2011, Article Id
891585.
Jin, X. C., Ong, S. H. & Jayasooriah 1995. A Practical
Method For Estimating Fractal Dimension. Pattern
Recognition Letters, 16, 457-464.
Latifi, K., Huang, T.-C., Feygelman, V., Budzevich, M.
M., Moros, E. G., Dilling, T. J., Stevens, C. W.,
Elmpt, W. V., Dekker, A. & Zhang, G. G. 2013a.
Effects Of Quantum Noise In 4d-Ct On Deformable
Image Registration And Derived Ventilation Data.
Phys Med Biol, 58, 7661-7672.
Latifi, K., Zhang, G., Stawicki, M., Van Elmpt, W.,
Dekker, A. & Forster, K. 2013b. Validation Of Three
Deformable Image Registration Algorithms For The
Thorax. J Appl Clin Med Phys, 14, 19-30.
Liang, M. 2012. 3d Co-Occurrence Matrix Based Texture
Analysis Applied To Cervical Cancer Screening.
Master, Uppsala University.
Lin, L. I. K. 1989. A Concordance Correlation Coefficient
To Evaluate Reproducibility. Biometrics, 45, 255-268.
Nardone, V., Tini, P., Biondi, M., Sebaste, L., Vanzi, E.,
De Otto, G., Rubino, G., Carfagno, T., Battaglia, G. &
Pastina, P. 2016. Prognostic Value Of Mr Imaging
Texture Analysis In Brain Non-Small Cell Lung
Cancer Oligo-Metastases Undergoing Stereotactic
Irradiation. Cureus, 8.
Oliver, J. A., Budzevich, M., Hunt, D., Moros, E. G.,
Latifi, K., Dilling, T. J., Feygelman, V. & Zhang, G.
2017. Sensitivity Of Image Features To Noise In
Conventional And Respiratory-Gated Pet/Ct Images
Of Lung Cancer. Technology In Cancer Research &
Treatment, 16, 595-608.
Oliver, J. A., Budzevich, M., Zhang, G. G., Dilling, T. J.,
Latifi, K. & Moros, E. G. 2015. Variability Of Image
Features Computed From Conventional And
Respiratory-Gated Pet/Ct Images Of Lung Cancer.
Translational Oncology, 8, 524-534.
Sarkar, N. & Chaudhuri, B. B. 1992. An Efficient
Approach To Estimate Fractal Dimension Of Textural
Images. Pattern Recognition, 25, 1035-1041.
Shafiq-Ul-Hassan, M., Zhang, G. G., Latifi, K., Ullah, G.,
Hunt, D. C., Balagurunathan, Y., Abdalah, M. A.,
Schabath, M. B., Goldgof, D. G., Mackin, D., Court,
L. E., Gillies, R. J. & Moros, E. G. 2017. Intrinsic
Dependencies Of Ct Radiomic Features On Voxel Size
And Number Of Gray Levels. Medical Physics, 44,
1050-1062.
Suzuki, M. T. & Yaginuma, Y. A Solid Texture Analysis
Based On Three-Dimensional Convolution Kernels.
2007. 64910w-64910w-8.
Thibault, G., Fertil, B., Navarro, C., Pereira, S., Cau, P.,
Levy, N., Sequeira, J. & Mari, J.-L. Texture Indexes
And Gray Level Size Zone Matrix: Application To
Cell Nuclei Classification. 10th International
Conference On Pattern Recognition And Information
Processing, 2009 Minsk, Belarus. 140-145.
Uytterhoeven, G., Roose, D. & Bultheel, A. 1997. Wavelet
Transforms Using The Lifting Scheme.
Wrangsjö, A., Pettersson, J. & Knutsson, H. 2005. Non-
Rigid Registration Using Morphons. In: Kalviainen,
H., Parkkinen, J. & Kaarna, A. (Eds.) Image Analysis.
Springer Berlin Heidelberg.
Yip, S. S. F., Coroller, T. P., Sanford, N. N., Huynh, E.,
Mamon, H., Aerts, H. J. W. L. & Berbeco, R. I. 2016.
Use Of Registration-Based Contour Propagation In
Texture Analysis For Esophageal Cancer Pathologic
Response Prediction. Physics In Medicine And
Biology, 61, 906.
BIOIMAGING 2018 - 5th International Conference on Bioimaging
158
