
Extracting Biomarkers from Dynamic Images
Approaches and Challenges
Jakub Nalepa
1,2
, Michael P. Hayball
1,3,4
, Stephen J. Brown
1,3,4
, Michal Kawulok
1,2
and Janusz Szymanek
1
1
Future Processing, Gliwice, Poland
2
Silesian University of Technology, Gliwice, Poland
3
Feedback PLC, Cambridge, U.K.
4
Cambridge Computed Imaging, Cambridge, U.K.
Keywords:
DCE Imaging, Biomarkers, Medical Image Analysis.
Abstract:
Imaging technologies have developed rapidly over the past decade proving to be valuable and effective tools
for diagnosis, evaluation and treatment of many conditions, especially cancer. Dynamic contrast enhanced
imaging using computed tomography or magnetic resonance has been shown particularly effective and has
been intensively studied to allow for assessing the vascular support of various tumours and other tissues. In
this paper, we discuss current approaches and most important challenges in extracting markers from such
dynamic images. These difficulties have to be resolved in order to ultimately improve patient care.
1 INTRODUCTION
Imaging technologies have developed extremely
rapidly over the past decade proving to be valuable
and effective tools for diagnosis, evaluation and treat-
ment of many conditions, especially cancer. Cross-
sectional imaging such as magnetic resonance (MR)
and computed tomography (CT) have been shown
particularly effective. The pixel data in these im-
ages holds significant information which can be un-
covered by post-processing analytical software. This
is currently not widely done due to the complexity of
this process. It results in many conditions being un-
detected and miss-diagnosed leading to incorrect or
prolonged treatment, increased costs and unnecessary
emotional upset.
Therefore, there is need of early diagnostic and
predictive factors to refine the management of patients
with various types of cancer, e.g., in order to differen-
tiate between benign and malignant, guide the use of
surgical adjuncts, response evaluation and help deter-
mine patients that are at risk of early reoccurrence,
requiring intense monitoring and follow-up.
Dynamic contrast enhanced (DCE) biomarkers
were proven to be correlated with physiological and
molecular processes which can be observed in tu-
mour angiogenesis (these processes are morpholog-
ically characterised by an increased number of micro-
vessels, which are extremely difficult to image di-
rectly using well-known imaging techniques (Miles,
2002)). Therefore, DCE biomarkers can robustly as-
sess tumour characteristics and stage, and provide
an independent indicator of prognosis, enabling risk
stratification for patients with various types of cancer.
The first description of the application of multi-
slice DCE computed tomography (DCE-CT) for
measuring tumour perfusion dates back to early
90’s (Miles et al., 1993). The process of the DCE
analysis involves acquiring time series images and in-
vestigating temporal changes of injected contrast ma-
terial (very often referred to as tracer) attenuation
in vessels and tissues. Such biomarkers extracted
from dynamic images have been investigated in sev-
eral clinical trials (Coenegrachts et al., 2012). They
were also used for determining the drug effects in
various cancers (thus monitoring the therapy progress
and treatment response), which include glioma (Ford
et al., 1996), rectal, renal (Fournier et al., 2010),
lung (Ng et al., 2007) cancers, carcinoids, and numer-
ous others (Miles, 2002). Importantly, DCE imag-
ing produces reproducible measurements which have
been validated against many reference methods—this
reproducibility of results is extremely important in
clinical applications which are aimed at helping in di-
520
Nalepa, J., Hayball, M., Brown, S., Kawulok, M. and Szymanek, J.
Extracting Biomarkers from Dynamic Images - Approaches and Challenges.
DOI: 10.5220/0006652505200525
In Proceedings of the 7th International Conference on Pattern Recognition Applications and Methods (ICPRAM 2018), pages 520-525
ISBN: 978-989-758-276-9
Copyright © 2018 by SCITEPRESS – Science and Technology Publications, Lda. All rights reserved

agnosis. It is a non-invasive technique and can be eas-
ily incorporated into standard protocols, thus does not
require an additional imaging modality. Finally, the
linear relationship between the contrast medium con-
centration and CT attenuation value implies an easier
quantification compared with MRI (Miles, 2002).
Quantitative imaging—according to the Quantita-
tive Imaging Biomarkers Alliance (which is the ini-
tiative of the Radiological Society of North Amer-
ica, looking into improving the practicality of quan-
titative biomarkers by reducing variability across de-
vices, patients, time, and sites
1
)—is the process of
extraction of quantifiable features from medical im-
ages (e.g., dynamic contrast enhanced images). These
image-derived features should allow for assessing the
status of a disease, injury, or chronic conditions rela-
tive to normal. The field of quantitative imaging en-
compasses additional activities, including data anal-
ysis, along with the display and reporting methods.
Importantly, these procedures should directly lead to
extracting accurate, precise and reproducible metrics,
which can be coupled with additional, physiologically
relevant patient parameters to improve the treatment
outcome and prognostic efficiency of imaging.
A quantitative imaging biomarker is then an ob-
jective characteristic derived from an in vivo image.
This characteristic is measured on a ratio or interval
scale as indicators of biological/pathogenic processes
or a response to the intervention and/or treatment.
The biomarkers may be extracted from a plethora of
currently available image modalities (e.g., computed
tomography, magnetic resonance or positron emission
tomography), and coupling them may further boost
their prognostic efficiency. Optimising the perfor-
mance of the derived biomarkers can directly affect
the patient treatment pathway.
This paper is structured as follows. In Section 2,
we discuss the procedure of extracting biomarkers
from dynamic images. It is interleaved with the ref-
erences to the literature, which highlight the current
advances in this field. Section 3 concludes the paper
and serves as an outlook to our future research.
2 EXTRACTING BIOMARKERS
FROM DYNAMIC IMAGES
The process of extracting biomarkers from dy-
namic images is visualised in Figure 1. The
flowchart presents the standard steps in the processing
pipeline—the images (e.g., DCE-CT or DCE-MR) are
1
For more details on QIBA see:
http://www.rsna.org/qiba/
acquired using an appropriate acquisition protocol.
It is worth noting that novel volumetric acquisition
techniques allow for decreasing the radiation dose as
pointed out by Miles et al. (Miles et al., 2012). Then,
the acquired images are registered (in order to min-
imise the impact of e.g., the patient motion on the
DCE results) and segmented (at a minimum, an ar-
terial blood vessel must be identified to enable analy-
sis).
The DCE processing involves generating
time/density curves for volumes of interest (VOIs)
along with the parametric maps, which are later
analysed for extracting useful (quantifiable) metrics.
Finally, these results should be safely stored since
they will be re-investigated in the future. This
investigation will help understand how the current
treatment affects the patient condition, and will allow
for choosing the best care pathway.
Acquire
images
Register
Segment
DCE
process
Present &
investigate
Store
Figure 1: Extracting biomarkers from dynamic images.
In the following subsections, we discuss in more
detail the pivotal steps of deriving biomarkers from
dynamic images. Although we focus on the DCE-CT
imaging, this processing strategy is quite generic and
can be easily tailored to other modalities too.
2.1 Image Registration
4D acquisition (3D image stack acquired in time,
which becomes the fourth dimension) techniques suf-
fer from motion artifacts which may be caused by ir-
regularities in patient breathing or heartbeat. These
differences between images should be corrected be-
fore any curve analysis since they are of the non-
pathological origin and can easily jeopardise the in-
vestigation (Hachama et al., 2010). This issue is tack-
led by the image registration process which maps im-
ages to a common space to correct geometric differ-
ences. On the one hand, rigid transformations al-
low for overcoming translational and rotational dis-
placements, whereas non-rigid transformations can
account for deformable changes in tissue shape.
The registration is crucial for an accurate DCE
analysis since it can influence the shape of resulting
enhancement curves (obtained either for segmented
automatically or manually annotated tissues of inter-
est). Importantly, some peaks in these curves can
be attenuated by the registration process, as shown
Extracting Biomarkers from Dynamic Images - Approaches and Challenges
521
in (Hachama et al., 2010). These peaks correspond to
the patient breathing periods which occur after peri-
ods of apnea. If these peaks were not removed during
the registration process, then they could be mistakenly
interpreted during the further curve analysis (either by
an automated algorithm or by the operator).
Incorporating advanced registration techniques to
minimise the impact of motion artifacts on time-
attenuation curve analysis is a pivotal task—it became
a vital research topic and some registration techniques
emerged during the years (Hou et al., 2014). Nonethe-
less, there is a need for fast and efficient algorithms
(both rigid and non-rigid) which will help mitigate the
risk of inaccurate analysis (which, in turn, affects the
biomarker extraction process).
Speeding up the registration process may be ac-
complished by designing and implementing parallel
algorithms which may possibly run either on mod-
ern multi-core processor or graphics processing unit
architectures, which are widely available nowadays.
We already showed that co-operative parallel algo-
rithms are extremely efficient in solving a variety of
complex optimisation problems (Nalepa and Błocho,
2015). Investigating the possibility of fusing the re-
sults of various registration algorithms run in parallel
(so that the execution time of this processing step is
not increased) to retrieve higher quality results is of
high research interest.
The recent advances and trends in medical image
registration are gathered in a number of interesting
surveys and reviews (Hill et al., 2001; Oliveira and
Tavares, 2014). These papers also highlight the po-
tential future research directions.
2.2 Image Segmentation
Automatic image segmentation (very often referred to
as the image labelling) algorithms identify particular
structures (or tissues) in the input medical image. It
has been recently shown that this step is crucial for
the 4-dimensional CT (3D stack of images along the
temporal dimension) and can significantly affect the
image-guided therapy (Martin et al., 2015). This issue
is especially challenging for target volumes which are
subject to motion (e.g., the lung cancers are subject to
varying magnitudes of respiratory motion). Discrep-
ancies (in the annotated region’s shape and/or area)
between the automatic and manual segmentation (or
even the manual segmentation undertaken by two or
more experienced radiology experts) may lead to dif-
ferences in treatment planning. Therefore, there is
a need for accurate (and robust against low-quality
data) 4D image segmentation techniques.
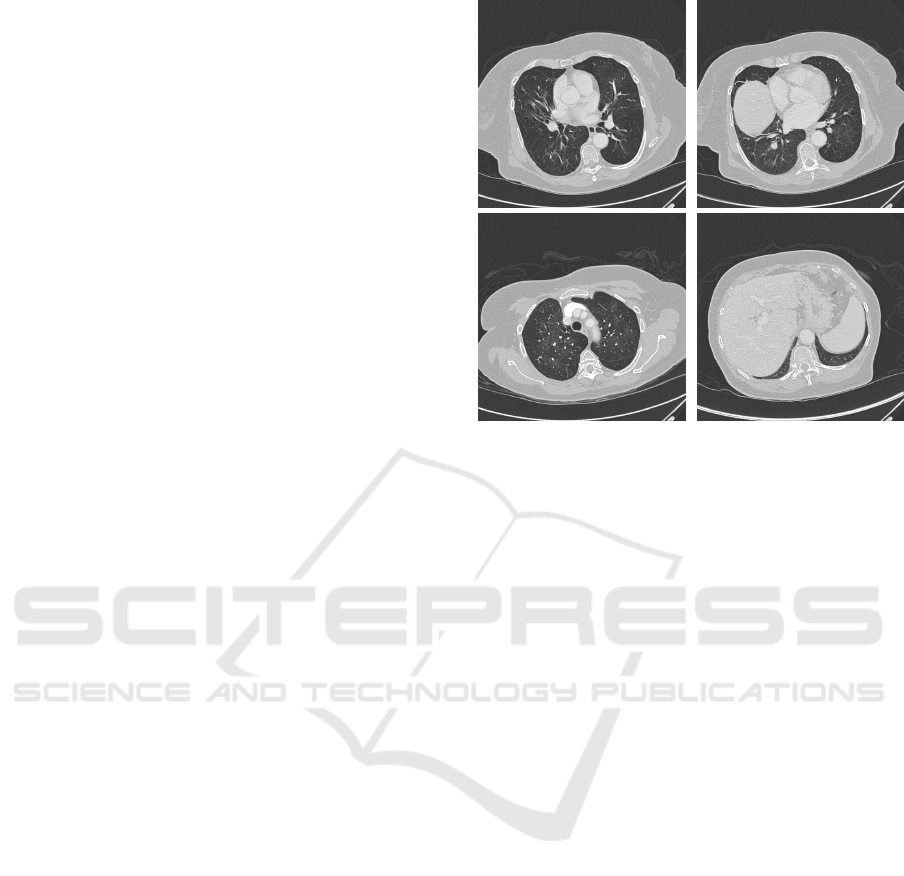
In recent segmentation algorithms, images are
Figure 2: Example CT images containing lungs of various
shapes and characteristics.
very often denoised at first, and then the tissue of in-
terest is manually outlined to provide a seed point for
further analysis (Hou et al., 2014). Then, the image
is segmented into the foreground (tissue) and back-
ground (usually air) parts, and undergoes the mor-
phological processing (although images can provide
a lot of information, only some—usually one or two
within the image—tissue areas are of interest). The
3D spatial and temporal domains are exploited with
the shape encoding, propagation and refinement tech-
niques. Since the consecutive images most probably
share the similarities between tissues and their shapes,
these similarities can be used to increase the qual-
ity of the initial segmentation (the third dimension
is utilised). The contour information (which may be
represented e.g., as the control points of the B-spline
corresponding to a given image segment) of one im-
age is therefore used for refining the control points in
the following image. Although it is a relatively easy
way of propagating the information between frames,
this approach helps boost the segmentation accuracy.
Such propagation is commonly used in segmentation
techniques which analyse the neighbouring frames in
stacks of images.
Segmenting medical images has been summarised
in numerous interesting surveys (Vitulano et al., 1997;
Wei and Li, 2014). A very recent paper by Smistad
et al. (Smistad et al., 2015) indicates that exploiting
parallel architectures (which are easily accessible at
the moment) is an important issue. Combining the in-
formation reflecting various image features, including
intensity, texture and spatial characteristics appears as
a very promising research direction. This combined
ICPRAM 2018 - 7th International Conference on Pattern Recognition Applications and Methods
522
feature domain can be utilised for new 2D segmen-
tation (for individual images) techniques, and can be
coupled with the 3D spatial and temporal image re-
lations to provide accurate segmentation into organs
(i.e., to classify the organs in the input images prop-
erly). Also, weakly supervised segmentation tech-
niques are gaining attention too (Jia et al., 2017).
Four example images containing lungs of various
characteristics, positions and shapes are given in Fig-
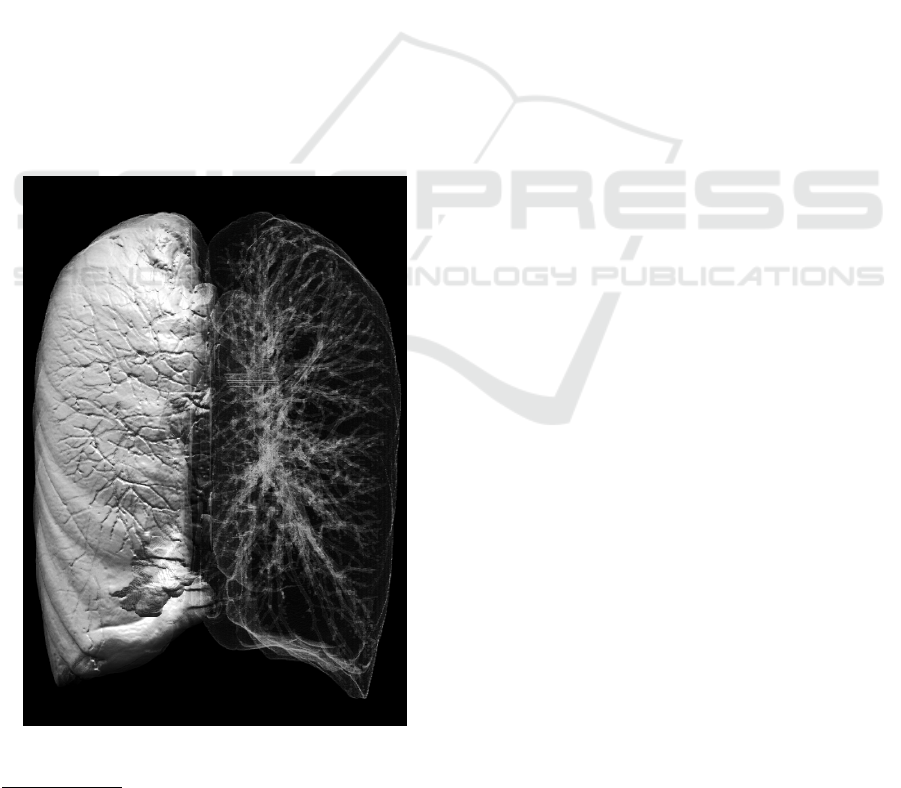
ure 2, along with the example volumetric rendering of
segmented lungs presented in Figure 3. These exam-
ples show how difficult the segmentation task is—a
well-performing algorithm should deal well with col-
lapsed or malformed lung structures. Also, it is pos-
sible that a tumour appears on the lung edge, hence
it influences its shape. These images come from
the Cancer Imaging Archive
2
repository (Clark et al.,
2013), and it was used during the 2015 SPIE Med-
ical Imaging Conference (the LUNGx Segmentation
Challenge (Armato et al., 2015)). Organs are very
often segmented from whole-body scans which im-
poses the additional difficulty of locating the frames
containing these organs in the first step (other frames
can be pruned and removed from further analysis).
Figure 3: Lungs segmented from a whole-body CT scan us-
ing our lung segmentation algorithm (Walczak et al., 2017).
2
See https://wiki.cancerimagingarchive.net; Last ac-
cess: November 11, 2017.
2.3 DCE Processing
DCE biomarkers are derived from analysing the
movement of contrast dye into and out of soft tis-
sue in the human body following injection of a bolus
of dye. The semi-quantitative parameters which can
be derived from DCE imaging with the use of time-
attenuation curves reflect and quantify tumour vascu-
larity (O’Connor et al., 2011). These measures en-
compass (but are not limited to):
• Peak enhancement—the maximum contrast con-
centration.
• Perfusion normalised to cardiac output—the peak
enhancement corrected for dose of contrast
medium and contrast sensitivity.
• Standardised perfusion value—the peak enhance-
ment corrected for the patient weight and iodine
calibration factor.
• Area under the time-attenuation curve.
• Maximum upslope.
Derived values (quantifying physiological param-
eters) also require the time-attenuation curve from the
supplying artery, referred to as the arterial input func-
tion (AIF). These additional DCE parameters include:
• Perfusion (regional tumour blood flow)—the
amount of blood (contrast) flowing through the
unit volume of tissue.
• Permeability—the amount of contrast leaving the
blood stream.
• Blood volume—the fraction of the tissue which is
blood.
• Mean transit time—the time indicating how long
the contrast takes to pass through the given tissue
vasculature.
• Time to peak—the time taken to reach the maxi-
mum contrast concentration.
The extracted features are depicted as paramet-
ric maps (for better visualisation and easier interpre-
tation). Although comparing DCE results for var-
ious images obtained using software delivered by
one manufacturer (e.g., GE Healthcare or Siemens
Healthcare) is quite intuitive, such comparisons are
extremely challenging (or even impossible) if differ-
ent DCE analysis approaches are exploited.
As discussed by Miles et al. (Miles et al., 2012),
there are three tracer kinetics models currently in use:
the Fick’s principle (implemented by e.g., Philips and
Toshiba), the Patlak model (Siemens), and the John-
son and Wilson model (GE Healthcare). Because of
differences in the underlying physics of these mod-
els, the results cannot be compared directly. This is
Extracting Biomarkers from Dynamic Images - Approaches and Challenges
523

an important real-life issue—it is not possible to com-
pare DCE results retrieved for the same patient e.g., at
different sites.
3 CONCLUSIONS AND
OUTLOOK
Although DCE is widely used and accepted in clin-
ical practice, there are a number of technical is-
sues (including the interoperability of medical sys-
tems (Chmielewski and Stapor, 2016)) which remain
unresolved and should be tackled to provide robust
and efficient personalised medical care. The guide-
lines and recommendations (concerning the system
requirements, quality assurance, radiation dosimetry,
patient preparation and many others which may in-
fluence the examination) which help optimise the use
of the DCE imaging in a day-to-day oncology care,
along with the current status of DCE have been sum-
marised in a survey by Miles et al. (Miles et al., 2012).
DCE biomarkers have been available for some 25
years, but the improvements in acquisition technol-
ogy have accelerated the adoption recently. Modern
CT and MR scanners are able to acquire time series
images of 3D volumes routinely and most equipment
manufacturers offer a DCE analysis package. How-
ever, though a number of analysis algorithms have
been already published, each manufacturer applies
different analysis techniques leading to difficulties in
comparing results. Therefore, there is a need for a
more generally available analysis system for clinical
and research use. This issue was raised by Miles et
al. as the most important research direction, which
should be undertaken as fast as possible.
Our current research is focused on incorporat-
ing machine learning and evolutionary (e.g., memetic
(Nalepa and Blocho, 2016), being the hybrid ap-
proaches coupling evolutionary algorithms with var-
ious local-search procedures) approaches at various
steps of the DCE processing pipeline. We plan to in-
corporate support vector machines, which are a su-
pervised classifier applied successfully in a range of
pattern recognition tasks (Nalepa and Kawulok, 2014;
Nalepa and Kawulok, 2016). Interestingly, segment-
ing medical images resembles the problem of de-
tecting and segmenting skin in colour images, which
was the topic of our earlier research (Kawulok et al.,
2014a; Kawulok et al., 2014b). The results obtained
in our previous works on skin detection can be ben-
eficial to implement in emerging medical image seg-
mentation techniques. Finally, deep neural networks
(DNNs) are being intensively developed to segment
various image modalities (Liskowski and Krawiec,
2016). Such classification engines can be provided
with annotated images and are aimed at extracting
features automatically. Since the medical data sets are
very often extremely imbalanced (the majority class
examples represent healthy tissue), the data augmen-
tation step is critical and was shown to dramatically
affect the performance od the deep convolutional lay-
ers. Also, determining the appropriate deep architec-
ture is an important problem which attracted research
attention (Lorenzo et al., 2017). Tailoring the DNN
architecture can allow for exploiting the additional
knowledge about the medical data (e.g., the 3D rela-
tionships) which has not been extensively investigated
in the literature so far.
ACKNOWLEDGEMENTS
This research was supported by the National
Centre for Research and Development under the
Innomed Research and Development Grant No.
POIR.01.02.00-00-0030/15.
REFERENCES
Armato, III, S. G., Hadjiiski, L., Tourassi, G. D., Drukker,
K., Giger, M. L., Li, F., Redmond, G., Farahani, K.,
Kirby, J. S., and Clarke, L. P. (2015). Guest editorial:
LUNGx challenge for computerized lung nodule clas-
sification: reflections and lessons learned. Journal of
Medical Imaging, 2(2):020103.
Chmielewski, M. and Stapor, P. (2016). Medical data uni-
fication using ontology-based semantic model struc-
tural analysis. In Swiatek, J., Borzemski, L., Grzech,
A., and Wilimowska, Z., editors, Information Systems
Architecture and Technology: Proceedings of 36th In-
ternational Conference on Information Systems Archi-
tecture and Technology – ISAT 2015 – Part III, pages
139–151, Cham. Springer International Publishing.
Clark, K., Vendt, B., Smith, K., Freymann, J., Kirby, J.,
Koppel, P., Moore, S., Phillips, S., Maffitt, D., Pringle,
M., Tarbox, L., and Prior, F. (2013). The cancer imag-
ing archive (tcia): Maintaining and operating a public
information repository. Journal of Digital Imaging,
26(6):1045–1057.
Coenegrachts, K., Bols, A., Haspeslagh, M., and Rigauts,
H. (2012). Prediction and monitoring of treatment
effect using T1-weighted dynamic contrast-enhanced
magnetic resonance imaging in colorectal liver metas-
tases: Potential of whole tumour ROI and selec-
tive ROI analysis. European Journal of Radiology,
81(12):3870 – 3876.
Ford, J., Miles, K. A., Hayball, M. P., Bearcroft, P., Blee-
han, N., and Osborn, C. (1996). A simplified method
for measurement of blood-brain barrier permeability
ICPRAM 2018 - 7th International Conference on Pattern Recognition Applications and Methods
524

using CT: preliminary results and the effect of RMP-
7. Quantitative imaging in oncology, 1:1–5.
Fournier, L. S., Oudard, S., Thiam, R., Trinquart, L., Banu,
E., Medioni, J., Balvay, D., Chatellier, G., Frija, G.,
and Cuenod, C. A. (2010). Metastatic renal carci-
noma: Evaluation of antiangiogenic therapy with dy-
namic contrast-enhanced CT. Radiology, 256(2):511–
518.
Hachama, M., Desolneux, A., Cuenod, C. A., and Richard,
F. J. (2010). A classifying registration technique for
the estimation of enhancement curves of DCE-CT
scan sequences. Medical Image Analysis, 14(2):185
– 194.
Hill, D. L. G., Batchelor, P. G., Holden, M., and Hawkes,
D. J. (2001). Medical image registration. Physics in
Medicine and Biology, 46(3):R1.
Hou, Z., Wang, Y., Thng, C. H., Ng, Q.-S., Goh, V.,
and Koh, T. S. (2014). Automatic region-of-interest
segmentation and registration of dynamic contrast-
enhanced images of colorectal tumors. Physics in
Medicine and Biology, 59(23):7361.
Jia, Z., Huang, X., Chang, E. I. C., and Xu, Y. (2017).
Constrained deep weak supervision for histopathol-
ogy image segmentation. IEEE Transactions on Med-
ical Imaging, 36(11):2376–2388.
Kawulok, M., Kawulok, J., and Nalepa, J. (2014a).
Spatial-based skin detection using discriminative
skin-presence features. Pattern Recognition Letters,
41:3 – 13.
Kawulok, M., Kawulok, J., Nalepa, J., and Smołka, B.
(2014b). Self-adaptive algorithm for segmenting skin
regions. EURASIP Journal on Advances in Signal
Processing, 2014(1):170.
Liskowski, P. and Krawiec, K. (2016). Segmenting retinal
blood vessels with deep neural networks. IEEE Trans-
actions on Medical Imaging, 35(11):2369–2380.
Lorenzo, P. R., Nalepa, J., Kawulok, M., Ramos, L. S., and
Pastor, J. R. (2017). Particle swarm optimization for
hyper-parameter selection in deep neural networks. In
Proceedings of the Genetic and Evolutionary Compu-
tation Conference, GECCO ’17, pages 481–488, New
York, NY, USA. ACM.
Martin, S., Johnson, C., Brophy, M., Palma, D. A., Bar-
ron, J. L., Beauchemin, S. S., Louie, A. V., Yu,
E., Yaremko, B., Ahmad, B., Rodrigues, G. B., and
Gaede, S. (2015). Impact of target volume segmen-
tation accuracy and variability on treatment planning
for 4d-ct-based non-small cell lung cancer radiother-
apy. Acta Oncologica, 54(3):322–332.
Miles, K. A. (2002). Functional computed tomography in
oncology. European Journal of Cancer, 38(16):2079
– 2084.
Miles, K. A., Hayball, M. P., and Dixon, A. K. (1993).
Functional images of hepatic perfusion obtained with
dynamic CT. Radiology, 188(2):405–411.
Miles, K. A., Lee, T.-Y., Goh, V., Klotz, E., Cuenod, C.,
Bisdas, S., Groves, A. M., Hayball, M. P., Alonzi,
R., and Brunner, T. (2012). Current status and guide-
lines for the assessment of tumour vascular support
with dynamic contrast-enhanced computed tomogra-
phy. European Radiology, 22(7):1430–1441.
Nalepa, J. and Błocho, M. (2015). Co-operation in the par-
allel memetic algorithm. International Journal of Par-
allel Programming, 43(5):812–839.
Nalepa, J. and Blocho, M. (2016). Adaptive memetic al-
gorithm for minimizing distance in the vehicle rout-
ing problem with time windows. Soft Computing,
20(6):2309–2327.
Nalepa, J. and Kawulok, M. (2014). A memetic algorithm
to select training data for support vector machines. In
Proc. of the 2014 Annual Conference on Genetic and
Evolutionary Computation, GECCO ’14, pages 573–
580, New York, USA. ACM.
Nalepa, J. and Kawulok, M. (2016). Adaptive memetic
algorithm enhanced with data geometry analysis to
select training data for SVMs. Neurocomputing,
185:113 – 132.
Ng, Q.-S., Goh, V., Carnell, D., Meer, K., Padhani, A. R.,
Saunders, M. I., and Hoskin, P. J. (2007). Tumor
antivascular effects of radiotherapy combined with
combretastatin A4 phosphate in human non-small-cell
lung cancer. International Journal of Radiation On-
cology, 67(5):1375 – 1380.
O’Connor, J. P. B., Tofts, P. S., Miles, K. A., Parkes,
L. M., Thompson, G., and Jackson, A. (2011). Dy-
namic contrast-enhanced imaging techniques: Ct and
mri. The British Journal of Radiology, 84(spe-
cial issue 2):S112–S120. PMID: 22433822.
Oliveira, F. P. and Tavares, J. M. R. (2014). Medical image
registration: a review. Computer Methods in Biome-
chanics and Biomedical Engineering, 17(2):73–93.
PMID: 22435355.
Smistad, E., Falch, T. L., Bozorgi, M., Elster, A. C., and
Lindseth, F. (2015). Medical image segmentation on
GPUs a comprehensive review. Medical Image Anal-
ysis, 20(1):1 – 18.
Vitulano, S., Ruberto, C. D., and Nappi, M. (1997). Differ-
ent methods to segment biomedical images. Pattern
Recognition Letters, 18(11):1125 – 1131.
Walczak, M., Burda, I., Nalepa, J., and Kawulok, M.
(2017). Segmenting lungs from whole-body ct
scans. In Kozielski, S., Mrozek, D., Kasprowski,
P., Małysiak-Mrozek, B., and Kostrzewa, D., edi-
tors, Beyond Databases, Architectures and Structures.
Towards Efficient Solutions for Data Analysis and
Knowledge Representation: 13th International Con-
ference, BDAS 2017, Ustro
´
n, Poland, May 30 - June 2,
2017, Proceedings, pages 403–414, Cham. Springer
International Publishing.
Wei, J. and Li, G. (2014). Automated lung segmenta-
tion and image quality assessment for clinical 3-d/4-d-
computed tomography. IEEE Journal of Translational
Engineering in Health and Medicine, 2:1–10.
Extracting Biomarkers from Dynamic Images - Approaches and Challenges
525
