
Coarse Clustering and Classification of Images with CNN Features for
Participatory Sensing in Agriculture
Prakruti Bhatt, Sanat Sarangi and Srinivasu Pappula
TCS Research & Innovation, Mumbai, India
Keywords:
Unsupervised Classification, CNN Features, Automated Tagging, Participatory Sensing.
Abstract:
A solution is proposed to perform unsupervised image classification and tagging by leveraging the high le-
vel features extracted from a pre-trained Convolutional Neural Network (CNN). It is validated over images
collected through a mobile application used by farmers to report image-based events like pest and disease
incidents, and application of agri-inputs towards self-certification of farm operations. These images need to
be classified into their respective event classes in order to help farmers tag images properly and support the
experts to issue appropriate advisories. Using the features extracted from CNN trained on ImageNet database,
images are coarsely clustered into classes for efficient image tagging. We evaluate the performance of dif-
ferent clustering methods over the feature vectors of images extracted from global average pooling layer of
state-of-the-art deep CNN models. The clustered images represent a broad category which is further divided
into classes. CNN features of the tea leaves category of images were used to train the SVM classifier with
which we achieve 93.75% classification accuracy in automated state diagnosis of tea leaves captured in un-
controlled conditions. This method creates a model to auto-tag images at the source and can be deployed at
scale through mobile applications.
1 INTRODUCTION
Images constitute one of the major sources of em-
bedded information. With video and image data over
the world increasing at a phenomenal rate, accurate
image analysis plays a critical role in automating sy-
stem functions. Images are generally captured in un-
controlled conditions in most real time applications.
They need to be correctly categorized to make furt-
her inferences. The same applies to a stream of ima-
ges getting collected in our database generated for a
system to assist farmers in making intelligent decisi-
ons for crop cycle management to ensure faster acti-
ons and prevent yield loss. We have developed a mo-
bile crowd sourcing based application which is used
by farmers to report image-based events for crop gro-
wth, disease incidents and application of agri-inputs
towards self-certification of farm operations. Experts
associated with the farmers issue advisories to them
based on these incidents. We propose a solution
that would perform automated event classification and
tagging based on image features as well as help far-
mers tag images appropriately to support the experts
in making better decisions.
1.1 Background and Motivation
Conventional unsupervised image classification met-
hods are based on complex features. Image clustering
has been done using Information Bottleneck (Tishby
et al., 2000) after fitting GMM on the images (Gold-
berger et al., 2006). Authors in (O’Hara and Draper,
2011) present an overview of image classification and
clustering based on Bag of features defined by local
descriptors like SURF, Gabor filter banks, SIFT etc.
In (Chum et al., 2008), vector quantized local feature
descriptors (SIFT) are used as features and enhanced
min-hash method is used to estimate the similarity
measure for clustering. Image processing methods for
feature extraction are complex and based on identi-
fying specific thresholds which turns out to be speci-
fic on image dataset (e.g. crop and crop-part) in ques-
tion and usually have performance limitations on ima-
ges taken in uncontrolled conditions. Recently, image
classification using deep learning especially Convo-
lutional Neural Network (CNN) based methods are
preferred for image classification tasks. Considering
Large Scale Visual Recognition Challenge (Russa-
kovsky et al., 2015) based on ImageNet dataset (Deng
et al., 2009), the benchmark for error rates, CNN mo-
488
Bhatt, P., Sarangi, S. and Pappula, S.
Coarse Clustering and Classification of Images with CNN Features for Participatory Sensing in Agriculture.
DOI: 10.5220/0006648504880495
In Proceedings of the 7th International Conference on Pattern Recognition Applications and Methods (ICPRAM 2018), pages 488-495
ISBN: 978-989-758-276-9
Copyright © 2018 by SCITEPRESS – Science and Technology Publications, Lda. All rights reserved

dels have achieved lowest 3.57% error rate (He et al.,
2016) which is comparable to human error rate. Aut-
hors in (Mohanty et al., 2016) have performed su-
pervised leaf disease classification with 99.35% accu-
racy by fine tuning the top layer and 98.36% by trai-
ning from scratch the CNN models with a dataset ta-
ken in near ideal conditions. In (Fujita et al., 2016),
a CNN based classifier that achieved 82.3% average
accuracy in classification of viral diseases occurring
in cucumber has been proposed. It is also seen that
Support Vector Machine (SVM) (Cortes and Vapnik,
1995) trained on features extracted from a deep neural
network pre-trained on ImageNet database performs
better classification when compared to other complex
supervised classification approaches (Sharif Razavian
et al., 2014). This motivates us to leverage the high le-
vel features extracted from the pre-trained CNNs to be
utilized for unsupervised classification of farm related
images.
2 PROPOSED APPROACH
In this paper, we have explored the possibility to ex-
tract features from the deep CNN model pre-trained
on the ImageNet database consisting of over 14 mil-
lion images and broadly cluster the images submit-
ted by farmers using the mobile application. We have
collected a large set of untagged crop images where a
significant fraction of the images correspond to health
issues associated with different parts of the plant. For
these unlabeled images, we forward-pass the image
through the deep CNN models trained on the diverse
ImageNet data to extract the feature vector. We pro-
pose a system where using these features, the images
are coarsely clustered into classes and a finer classifi-
cation model is built to further categorize the images
in every cluster using the same features. For valida-
tion, we apply clustering to group similar images from
the database and tag them according to their category.
Each of these categories is further divided into dif-
ferent classes e.g. different health conditions of leaf
images of some crop labeled by expert. The featu-
res corresponding to the images in these classes were
used to train an SVM classifier, as the labeled data for
now is not enough for training or fine-tuning a deep
neural network. Keras (Chollet, 2015) implementa-
tion of models have been used to extract the feature
vector of the images and scikit-learn library (Pedre-
gosa et al., 2011) has been used for application of
SVM and clustering methods with default parameters.
Sec. 3 briefly describes the mechanism of data col-
lection and its properties. Sec. 4 describes how trai-
ning the CNN is effective for learning image features,
and the state-of-the-art CNN architectures that have
been used in the current setup. Sec. 5 and Sec. 6 des-
cribe the clustering methods and the classification that
has been performed in the proposed approach. Sec. 7
discusses the evaluation of clustering methods and the
classification performance over crop related images.
Finally we conclude the discussion about the applica-
tion of CNN features, their performance and further
fine tuning of the proposed approach in Sec. 8.
3 DATASET AND
PREPROCESSING
Participatory Sensing offers powerful capability
through mobile phones and web services to collect
and analyze relevant data for use in studying and pro-
viding solutions based on inferences of the submitted
data. The farmers of different regions submit ima-
ges related to the whole of crop management i.e. all
utility, processes and events from sowing till harves-
ting. This data is used for creating personalized advis-
ory systems related (but not limited) to crop disease,
pests, weeds as well as use of correct seeds and che-
micals. This being a crowd sourcing based system,
the quality and relevance of the images submitted at
times is not trustworthy. So it is required to confirm
the category of images in an automated way. We have
collected a large set of untagged crop images where a
significant fraction of the images correspond to health
issues associated with different parts of the plant. For
now, the data comprises citrus trunk, citrus fruit, ci-
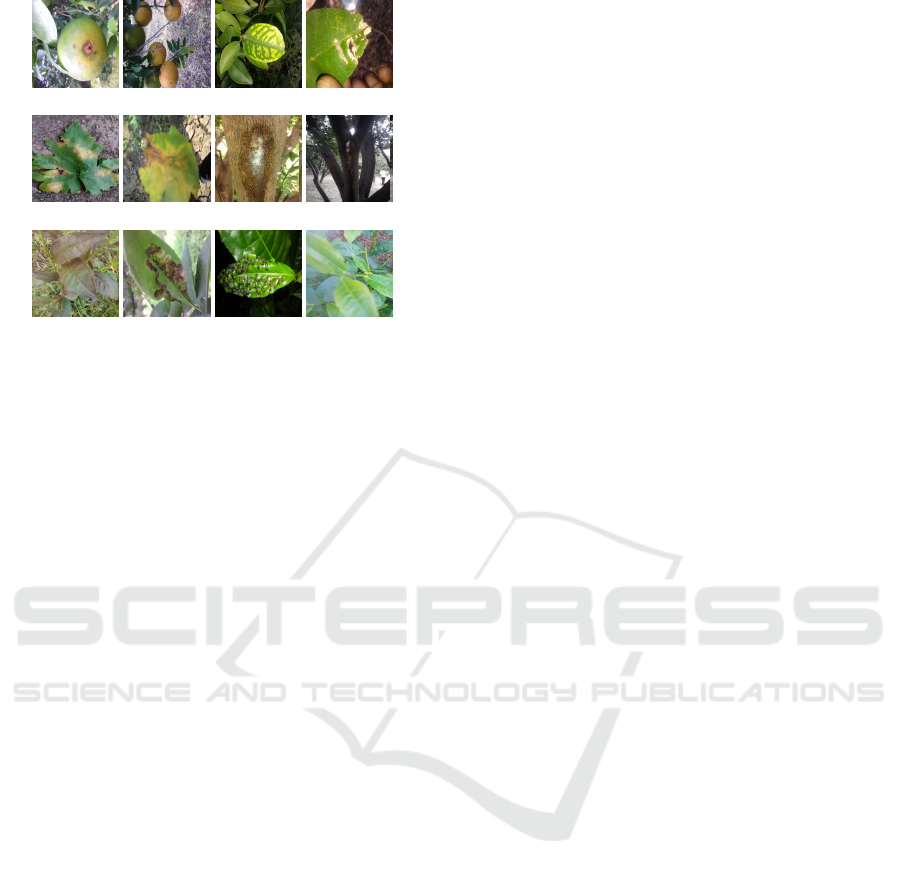
trus leaves, tea leaves, and grape leaves. Fig. 1 shows
some of the images collected in the database.
Brightness correction and normalization has been
performed over the images. Mean subtraction centers
the data around zero mean for each channel and nor-
malization binds the range of the image data. Apart
from helping eliminate brightness variation among
the images in the dataset, normalization also results
in contrast stretching, so it also enhances the poor
contrast images in the dataset. Image segmentation
techniques can be used if the nature of images is
known. Currently, as the images are not tagged to any
relevant information directly, the normalized images
with resized dimension same as the input size of the
CNN are forward passed through the pre-trained CNN
model in order to obtain the feature vector.
Coarse Clustering and Classification of Images with CNN Features for Participatory Sensing in Agriculture
489
(a) (b) (c) (d)
(e) (f) (g) (h)
(i) (j) (k) (l)
Figure 1: Images from the database collected (a,b) Citrus
fruits (c,d) Citrus leaves (e,f) Grape Leaves (g,h) Citrus
trunk (i-l) Tea leaves.
4 CNN FEATURES OF IMAGE
DATA
The convolution layer in CNN extracts features of an
input image while preserving spatial relation between
pixels by using a small matrix that strides over the
input image. This resulting output image is called
Activation map or Feature map. Convolution with
different filters generates different activation maps as
they act as feature detectors. Activation function after
the convolution introduces non-linearity in the CNN
as most of real-world data that CNN would be used
to learn is non-linear. Rectified Linear Unit (ReLU),
a generally used element wise activation function
max(0,x) replaces all negative pixel values in the fea-
ture map by zero. Spatial Pooling, i.e. downsampling
is applied on the feature map after ReLU to reduce
the dimensionality while preserving the most impor-
tant information. Pooling reduces number of parame-
ters and computations in networks, reduces over fit-
ting (Krizhevsky et al., 2012) and most importantly,
makes the feature invariant to scaling and small dis-
tortions in the input image. The last layer of a CNN is
Fully Connected (FC) neural network layer. Adding
FC helps the network to learn the non linear combina-
tion of features computed from convolutional layers
followed by average pooling for classification.
4.1 Pretrained CNN Models
The models Inception-v3 (Szegedy et al., 2016),
VGG-19 (Simonyan and Zisserman, 2014), Xcep-
tion (Chollet, 2016) and ResNet-50 (He et al., 2016)
are used to extract the features and validate the clus-
tering over them. We eventually aimed to choose one
out of them for the proposed system based on the clus-
tering performance. These architectures have diffe-
rences in terms of the depth as well as the basic buil-
ding blocks.
VGG-19 is a simpler deep network that is built as
a hierarchy of multiple 3 ×3 convolutional filters with
stride of 1 and maxpooling layers with stride 2 to ex-
tract more complex features and their combination.
The block of two 3 × 3 convolutional layers is simi-
lar to receptive field of 5 × 5 while a block of three
such layers have an effective receptive field of 7 × 7.
VGG also has 3 fully connected layers after the stack
of convolutional layer. Higher depth and FC layers
result into a large number of parameters to be trained.
Inception-v3 architecture is built using Inception
modules to make the model deeper while increasing
the width of the network. The conventional convo-
lutional filters can learn linear functions of their in-
puts while introducing the Inception module can in-
crease their learning abilities and abstraction power
by having more complex filters that independently ex-
ploit cross-channel as well as spatial correlations. In-
ception module does parallel computation of feature
maps using 1 × 1, 3 × 3, 5 × 5 and then concatena-
tes these feature maps thus giving advantage of multi-
level feature extraction from each input. By perfor-
ming the 1 × 1 convolution, the inception block com-
putes cross-channel correlations, ignoring the spatial
dimensions. This is followed by cross-spatial and
cross-channel correlations via the 3 × 3 and 5 × 5 fil-
ters.
Xception is a modification of the Inception ar-
chitecture where the inception modules are replaced
with depth-wise separable convolutions. It has 36
depthwise separable convolutional layers. The map-
ping of cross-channel correlations and spatial correla-
tions in the feature maps is entirely decoupled unlike
inception modules.
ResNet was developed by Kaiming He (He et al.,
2016) who showed that beyond a certain depth, addi-
tion of extra layers in a deep feed forward convolu-
tional networks can result in higher training and va-
lidation error. The problem of vanishing gradient in
training makes the learning slow and inaccurate. This
disappearing of data due to too many layers is sol-
ved by adding shortcut connection of the input and
the output of a convolutional layer so that extra layers
do not warp the representation of images very much.
The idea is that learning improves if the network le-
arns from the inputs while also correcting the resi-
dual error due to the previous layers. ResNet-50 is a
50 layered network made of such residual blocks that
adds residual to the input while computing the output
ICPRAM 2018 - 7th International Conference on Pattern Recognition Applications and Methods
490
of a particular layer. The input size of the Inception-
v3 and Xception is 299×299×3 and for VGG-19 and
ResNet-50 it is 224 × 224 ×3.
In the proposed approach, the input stream of ima-
ges is first categorized in an unsupervised manner.
For this purpose, the top layer feature vectors from
the average pooling layer of the deep CNN trained
on ImageNet database are taken as it is known that
the top layers of network learn generalized features.
The model trained on this database is seen to genera-
lize well on other datasets too for classification using
transfer learning (Zeiler and Fergus, 2014).
5 CLUSTERING IMAGE DATA
WITH CNN FEATURES
5.1 Data Visualization
The feature vectors are the output of fully connected
average pooling layer, extracted by forward passing
an image through pretrained Inception-v3 network.
These vectors corresponding to images in the data-
base are reduced to 2-D using t-stochastic neighbor
embedding (t-SNE) algorithm (Maaten and Hinton,
2008) for dimensionality reduction and visualization.
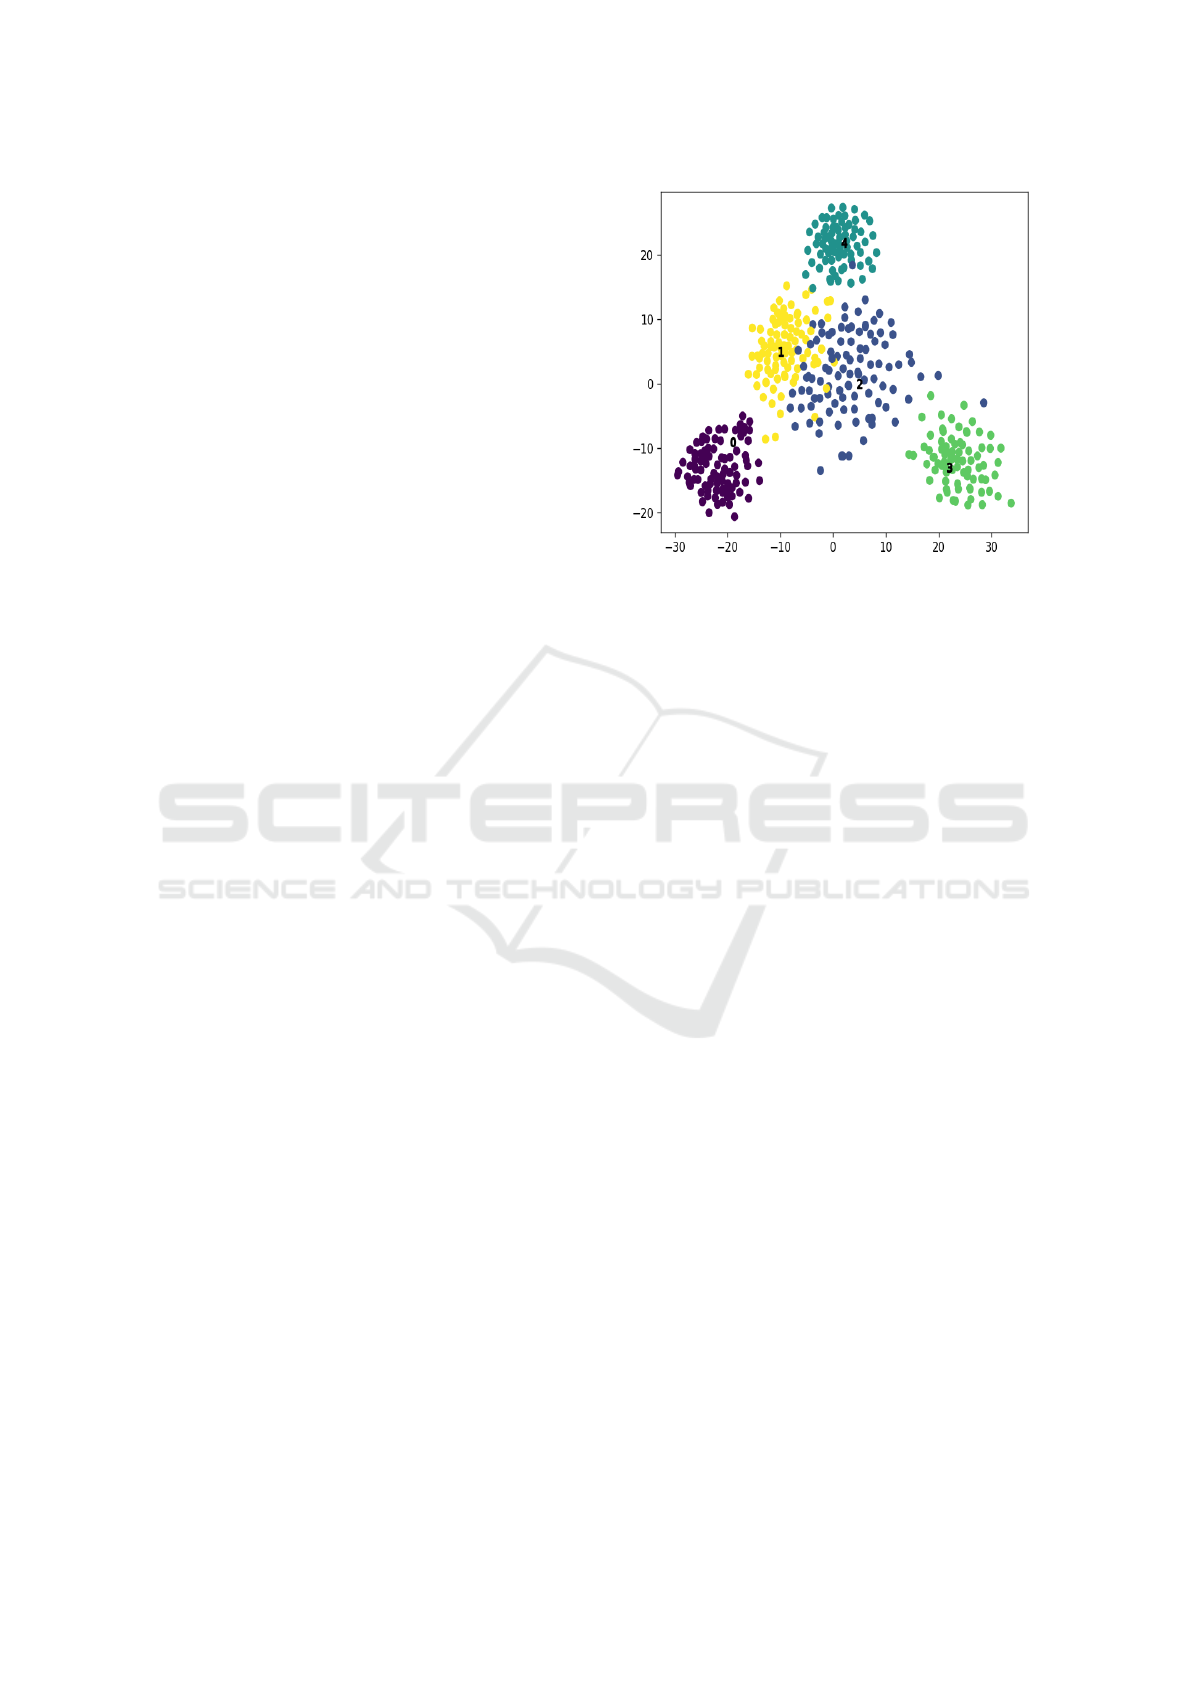
Fig. 2 shows the visualization of the 5 image cate-
gories in the database and makes it intuitive that the
CNN features are indeed useful in image clustering.
These are the broad categories into which the image
data has been clustered i.e. leaves of different crops,
trunks and fruits. It can be seen that the distance be-
tween the clusters for tea leaves and citrus leaves is
lesser than that between other clusters that are visu-
ally much different than each other.
5.2 Clustering Methods
We explore different clustering methods viz. K-
means (Arthur and Vassilvitskii, 2007), Batch K-
means (Sculley, 2010), Affinity Propagation (Dueck
and Frey, 2007), Mean shift (Comaniciu and Meer,
2002), Agglomerative clustering (Murtagh, 1983),
DBSCAN (Density-based spatial clustering of appli-
cations with noise) (Ester et al., 1996), BIRCH (Ba-
lanced iterative reducing and clustering using hierar-
chies) (Zhang et al., 1996) to select the best one con-
sidering their performance over the data as well as the
high-dimension feature vectors.
K-means (KM) iteratively assigns each feature
point to its nearest centroid and calculates new cen-
troids equal to mean of all of the points assigned to
each previous centroid. The iteration stops if the dif-
Figure 2: Clusters corresponding to images of 0: Citrus
trunk, 1: Citrus leaves, 2: Tea leaves, 3: Grape leaves, 4:
Citrus fruits.
ference between the previous and new centroids re-
mains almost same and is less than a particular thres-
hold. At start, the centroids are either chosen rand-
omly or specified to the algorithm. Initialization of
centroids plays a critical role in the convergence of
the algorithm.
Mini batch K-means (MBKM) iteratively performs
the same K-means over randomly sampled subsets
of the data. This reduces the amount of computa-
tion required for local convergence to the cluster cen-
troids. Performance of mini batch K-means is negli-
gibly worse than K-means but gives considerable im-
provement in efficiency for larger database.
Mean Shift (MS) algorithm is also a centroid ba-
sed algorithm where the feature points are updated as
candidates for centroids to be the mean of the points
within a certain region. These points are then elimina-
ted as near-duplicates to decide final set of centroids
of the clusters.
Affinity Propagation (AP) is based on the concept
of passing message of suitability of being an exem-
plar representing the other features to the other fe-
ature vectors till its convergence. The method does
not need number of clusters to be provided and choo-
ses the number of clusters according to the data. For
the experiment, the default parameters were used i.e.
damping factor of 0.5, 200 iterations and euclidean
affinity measure.
DBSCAN is a method based on clustering points
based on areas of high density and low density of the
points. The main concept of DBSCAN is the core fe-
ature point and recursively finding neighbors of the
core points. A core sample is one for which specified
number of other points i.e. neighbors are within a gi-
ven distance. A cluster here is defined as a set of these
Coarse Clustering and Classification of Images with CNN Features for Participatory Sensing in Agriculture
491

core points that is built by finding a core point, finding
the neighbors of it and assigning them as core points,
then again finding neighbors of these core points and
so on. A cluster can also have non-core points that are
at a distance more than the specified value and these
points are mostly on the boundary of the cluster.
Agglomerative Clustering (AC) is a hierarchical
clustering method that used bottom up approach in
which each feature is its own cluster and these clusters
are then merged. Metric for merging depend on three
linkage criteria which are (i) Ward (minimizes the va-
riance in the cluster), (ii) Complete linkage (minimi-
zes maximum distance between features in pairs of
clusters), (iii) Average linkage (minimizes the average
of the distances between all features of pair of clus-
ters). Hierarchical clustering methods are scalable to
large number of data points, increasing clusters. Also,
Agglomerative clustering is generally used for a large
number of data samples as it gives better scalability.
BIRCH is used to perform hierarchical clustering
over particularly large data-sets. It is able to clus-
ter incrementally incoming data mostly with a single
scan of the database. It is based on the Clustering
Feature Tree (CFT) which is a height balanced tree
data structure that stores the features for a hierarchi-
cal clustering. Cluster of data points is represented
by three values: number of feature points in the sub
cluster, linear sum of feature points, squared sum of
feature points. The new feature is added to the root of
CFT clubbed with a subcluster that has the centroid
closest to it. This is done recursively till it ends up at
the subcluster of the leaf of the tree having the clo-
sest centroid. Hierarchical or K-means clustering is
applied to cluster the leaf entries of CFT.
5.3 Evaluation of Clustering Methods
The clustering performance of these methods on
the database is compared using Silhouette coeffi-
cient (Rousseeuw, 1987) and Normalized Mutual In-
formation index (Vinh et al., 2010).
Silhouette coefficient is computed to validate the
clustering of unlabeled data. It is a measure of simila-
rity of a feature vector to the cluster it is assigned into
in comparison to other clusters. i.e. it helps visualize
how far a point is from other cluster boundaries and
how close it is into its own cluster. This coefficient
is also used to determine the clusters in the data if it
is not known. The range of coefficient is from -1 to
1, where +1 indicates that feature is at larger distance
from other clusters. 0 shows that feature is close to
decision boundary between clusters and negative va-
lues indicate that the features might be assigned to the
wrong cluster. If majority of features have a higher
value, the clustering is said to be reliable. For i
th
fea-
ture point, silhouette coefficient (s
i
) is given by Eqn. 1
where a
i
is average distance from other points in the
cluster and b
i
is minimum average distance to points
in other clusters. a
i
< b
i
and a
i
close to 0 is preferable
as coefficient s
i
takes maximum value 1 when a
i
= 0 .
s
i
=
b
i
− a
i
max(a
i
,b
i
)
(1)
which can also be written as
s
i
=
1 − a
i
/b
i
i f a
i
< b
i
0 i f a
i
= b
i
b
i
/a
i
− 1 i f a
i
> b
i
(2)
Normalized Mutual Information (NMI) score which is
a widely used metric to evaluate clustering methods
is also computed for the portion of data considered
in the experiment. The score value can be between
0 (no mutual information) and 1 (perfect correlated
labels). The images are hand labeled and compared
against the labels generated by clustering methods.
Mutual information gives a measure of similarity be-
tween the clustering and the manual categorization.
As seen in Eqn. 3, NMI is mutual information (MI)
normalized by product of entropy (H) of the labels ge-
nerated by clustering (pred labels) and the actual ones
(true labels). It helps to calculate similarity between
each couple of clusterings as well as the similarity be-
tween cluster labels and the actual categories.
NMI =
MI
true labels,pred labels
p
(H
true labels
× H
pred labels
)
(3)
6 CLASSIFICATION WITHIN
THE CLUSTERS
Unsupervised methods are seen to be effective in clas-
sifying crop parts for farm images. This coarse cluste-
ring method performed accurately on data with clas-
ses that had lesser similarity. The next task would be
to classify the different diseases and pests that ma-
nifest on the leaves of a specific crop. t-SNE vi-
sualization of data in Fig. 3 shows the healthy and
pest-infested tea-leaf images which we aim to clas-
sify. Considering the uncontrolled background and a
high inter-class similarity among the leaves as seen in
Fig. 4, we find that using K-means clustering for finer
classification within a class as discussed in previous
section would not perform accurately and has higher
chances of misclassification. So we consider training
SVM for further intra (within the) cluster classifica-
tion.
ICPRAM 2018 - 7th International Conference on Pattern Recognition Applications and Methods
492
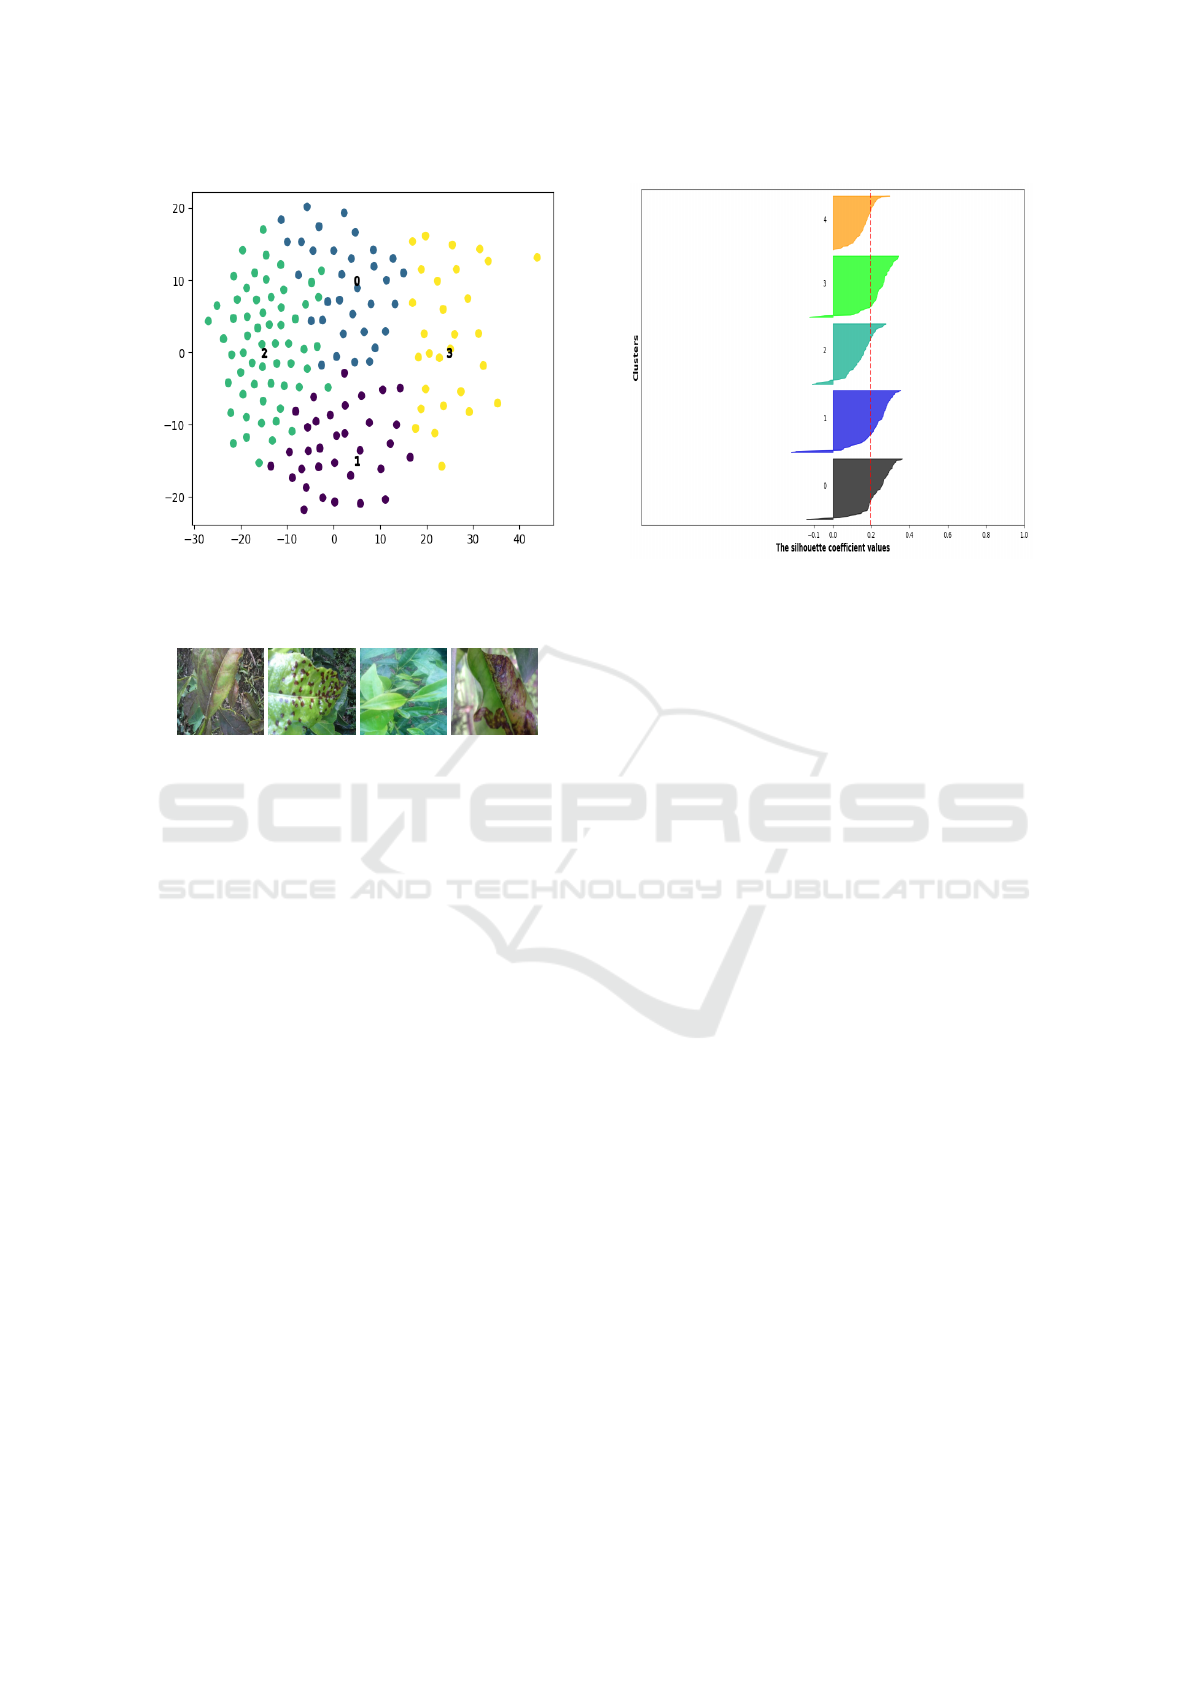
Figure 3: Visualization of clusters in tea-leaf images for 0:
Red black flat mite, 1: Melon aphid pest, 2: Leaf miners, 3:
Healthy leaf.
(a) (b) (c) (d)
Figure 4: Tea-leaf images: (a) Red black flat mite (b) Melon
aphid pest (c) Healthy leaf (d) Leaf miners.
7 RESULTS AND DISCUSSION
In the implemented approach, the database currently
is to be categorized into 5 classes viz. Grape leaves,
Citrus fruits, Citrus trunk, Citrus leaves, Tea leaves
as discussed in Sec. 3. The images corresponding
to these classes are then tagged accordingly. Each
category is further divided into classes representing
various conditions like diseases, pests within itself.
As discussed in Sec. 5, in order to validate if cluste-
ring can be applied, the categories within the images
are visualized using t-SNE diagram. Fig. 2 is an ex-
ample of such visualization plotted using the 2048-
D feature vectors obtained from pretrained Inception-
v3 model. To further evaluate the appropriateness of
the clustering, we have calculated the Silhoutte coef-
ficient values and NMI scores for features extracted
from considered pretrained CNN models and diffe-
rent clustering methods. For example, Fig. 5 shows
the Silhouette coefficients for all classes when clus-
tered using K-means algorithm. It can be seen that
the coefficient values for the same are positive thus
showing that clustering using these features is possi-
ble. Table 1 shows the coefficient values for the featu-
res extracted from top layers of considered CNN mo-
Figure 5: Silhouette scores for the 5 classes consisting of
Citrus trunks, Citrus leaves, Tea leaves, Grape leaves, Citrus
fruits considered under the experiment.
dels. Coefficient values for Agglomerative clustering
in table are calculated with average linkage and eucli-
dean affinity. The average Silhouette coefficient over
the clusters of considered images formed using basic
K-means algorithm using random initial centroids is
about 0.2.
Some of the images were labeled by the agri-
expert for checking the performance of the proposed
approach. We used the same labels to evaluate the
performance of the clustering by finding NMI score
for different clustering methods over features extrac-
ted from CNN models. Table 2 shows the NMI sco-
res for different clustering methods applied over the
data. We observed that the images with higher in-
tra cluster similarity and lower inter cluster similarity
were classified at an acceptably good accuracy. Cur-
rently, based on NMI score and Silhouette coefficient
values, we utilized mini batch K-means for categori-
zing the image features extracted from Inception-v3
model. The scores also suggest that scalable cluste-
ring algorithm like BIRCH with suitable parameters
can also be used for the expanding database.
Once the broad categories among images are
obtained, we use the same feature vectors to train
SVM classifier. Classification has been performed by
training linear SVM with scalar constant C=1 evalu-
ated using 10 fold cross validation on normalized fe-
atures i.e. making the feature range between 0 to 1.
The image classes for the Tea Leaf category are He-
althy leaves and three types of pest attacks viz. Red
Black Flat Mite, Melon aphid, Leaf miners. Through
the proposed system utilizing transferability of CNN
features, we could achieve test accuracy of 93.75%
with classification score of {precision, recall, F1-
score} = {0.95,0.94,0.94} in automated crop state di-
Coarse Clustering and Classification of Images with CNN Features for Participatory Sensing in Agriculture
493
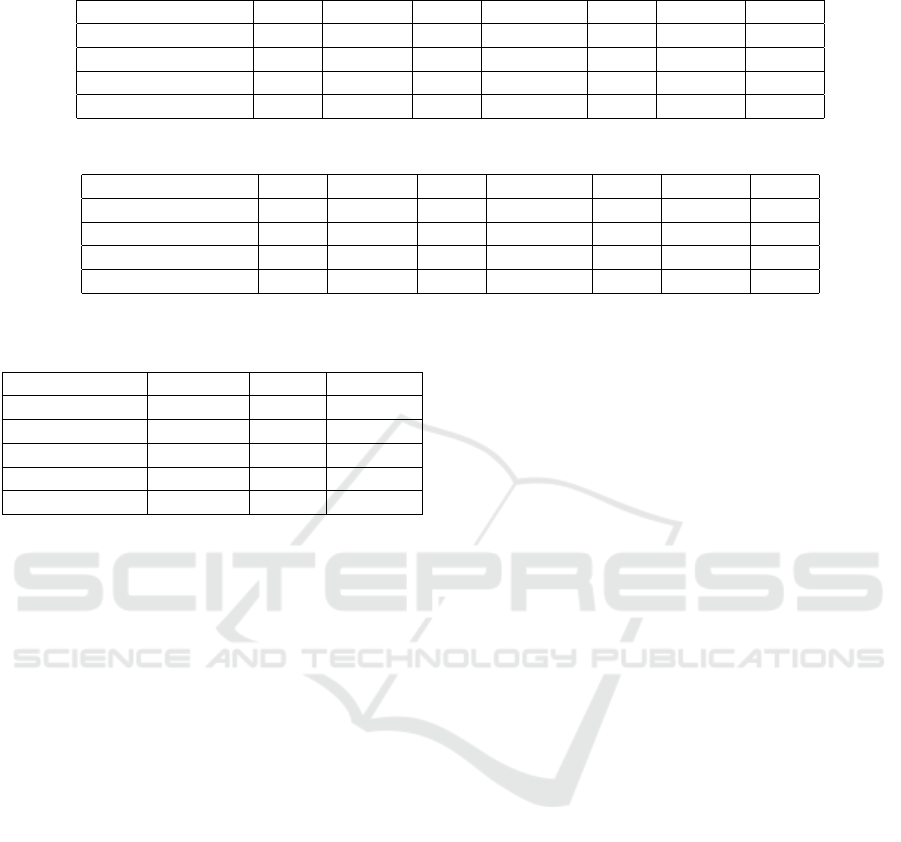
Table 1: Silhouette coefficients for different clustering techniques.
Evaluation metric KM MBKM MS DBSCAN AC BIRCH AP
VGG-19 0.198 0.198 0.110 0.180 0.186 0.200 0.056
Inception-v3 0.206 0.205 0.124 0.188 0.224 0.204 0.032
Xception 0.207 0.220 0.124 0.190 0.210 0.204 0.0248
Resnet-50 0.203 0.203 0.119 0.192 0.200 0.202 0.011
Table 2: NMI scores for different clustering techniques.
Evaluation metric KM MBKM MS DBSCAN AC BIRCH AP
VGG-19 0.743 0.732 0.090 0 0.650 0.600 0.027
Inception-v3 0.765 0.761 0.034 0.006 0.743 0.643 0.116
Xception 0.763 0.748 0.057 0 0.730 0.655 0.013
Resnet-50 0.691 0.690 0.040 0.0004 0.763 0.615 0.031
Table 3: Classification report for tea crop states.
Leaf state Precision Recall F1-score
Red black mite 1 0.86 0.92
Melon aphid 1 1 1
Healthy leaves 1 1 1
Leaf miners 0.86 1 0.94
Total 0.95 0.94 0.94
agnosis of tea leaves. Table 3 shows the classification
report with precision, recall and F1-scores for all the
leaf states when the accuracy is 93.75%.
8 CONCLUSION AND FUTURE
WORK
This approach of image data classification using fe-
atures through pre-trained CNN can be deployed on
large scale platforms with real time mobile applica-
tion to be used in fields. It illustrates how levera-
ging deep learning for unsupervised clustering and
supervised classification helps in developing a model
to auto-tag such images at the source with minimal
expert intervention. Most importantly, this reassures
that the high level features learned by the deep CNN
on a large disparate set of images generalize well to
the images on which the CNN is not trained. We furt-
her intend to expand the database in terms of classes
as well as variety, explore the image preprocessing
and segmenting techniques, see the effect of tuning
the parameters used by clustering algorithms, and use
different classifiers to improve the performance of the
system in terms of accuracy and efficiency.
REFERENCES
Arthur, D. and Vassilvitskii, S. (2007). k-means++: The
advantages of careful seeding. In Proceedings of the
eighteenth annual ACM-SIAM symposium on Discrete
algorithms, pages 1027–1035. Society for Industrial
and Applied Mathematics.
Chollet, F. (2015). Keras. https://github.com/fchollet/keras.
Chollet, F. (2016). Xception: Deep Learning with
Depthwise Separable Convolutions. arXiv preprint
arXiv:1610.02357.
Chum, O., Philbin, J., Zisserman, A., et al. (2008). Near
duplicate image detection: min-hash and tf-idf weig-
hting. In BMVC, volume 810, pages 812–815.
Comaniciu, D. and Meer, P. (2002). Mean shift: A robust
approach toward feature space analysis. IEEE Tran-
sactions on pattern analysis and machine intelligence,
24(5):603–619.
Cortes, C. and Vapnik, V. (1995). Support-vector networks.
Machine learning, 20(3):273–297.
Deng, J., Dong, W., Socher, R., Li, L.-J., Li, K., and Fei-
Fei, L. (2009). Imagenet: A large-scale hierarchical
image database. In IEEE Conference on Computer
Vision and Pattern Recognition, pages 248–255.
Dueck, D. and Frey, B. J. (2007). Non-metric affinity pro-
pagation for unsupervised image categorization. In
IEEE 11th International Conference on Computer Vi-
sion, ICCV, pages 1–8.
Ester, M., Kriegel, H.-P., Sander, J., Xu, X., et al. (1996).
A density-based algorithm for discovering clusters in
large spatial databases with noise. In Kdd, volume 96,
pages 226–231.
Fujita, E., Kawasaki, Y., Uga, H., Kagiwada, S., and Iya-
tomi, H. (2016). Basic investigation on a robust and
practical plant diagnostic system. In 15th IEEE Inter-
national Conference on Machine Learning and Appli-
cations (ICMLA), pages 989–992. IEEE.
Goldberger, J., Gordon, S., and Greenspan, H. (2006).
Unsupervised image-set clustering using an informa-
tion theoretic framework. IEEE transactions on image
processing, 15(2):449–458.
ICPRAM 2018 - 7th International Conference on Pattern Recognition Applications and Methods
494

He, K., Zhang, X., Ren, S., and Sun, J. (2016). Deep resi-
dual learning for image recognition. In Proceedings of
the IEEE Conference on Computer Vision and Pattern
Recognition, pages 770–778.
Krizhevsky, A., Sutskever, I., and Hinton, G. E. (2012).
ImageNet Classification with Deep Convolutional
Neural Networks. In Advances in Neural Information
Processing Systems 25, pages 1097–1105.
Maaten, L. v. d. and Hinton, G. (2008). Visualizing data
using t-sne. Journal of Machine Learning Research,
9(Nov):2579–2605.
Mohanty, S. P., Hughes, D. P., and Salath
´
e, M. (2016).
Using Deep Learning for Image-Based Plant Disease
Detection. Frontiers in Plant Science, 7:1419.
Murtagh, F. (1983). A survey of recent advances in hierar-
chical clustering algorithms. The Computer Journal,
26(4):354–359.
O’Hara, S. and Draper, B. A. (2011). Introduction to the
bag of features paradigm for image classification and
retrieval. arXiv preprint arXiv:1101.3354.
Pedregosa, F., Varoquaux, G., Gramfort, A., Michel, V.,
Thirion, B., Grisel, O., Blondel, M., Prettenhofer, P.,
Weiss, R., Dubourg, V., Vanderplas, J., Passos, A.,
Cournapeau, D., Brucher, M., Perrot, M., and Du-
chesnay, E. (2011). Scikit-learn: Machine learning
in Python. Journal of Machine Learning Research,
12:2825–2830.
Rousseeuw, P. J. (1987). Silhouettes: a graphical aid to
the interpretation and validation of cluster analysis.
Journal of computational and applied mathematics,
20:53–65.
Russakovsky, O., Deng, J., Su, H., Krause, J., Satheesh, S.,
Ma, S., Huang, Z., Karpathy, A., Khosla, A., Bern-
stein, M., et al. (2015). Imagenet large scale visual
recognition challenge. International Journal of Com-
puter Vision, 115(3):211–252.
Sculley, D. (2010). Web-scale k-means clustering. In
Proceedings of the 19th international conference on
World wide web, pages 1177–1178. ACM.
Sharif Razavian, A., Azizpour, H., Sullivan, J., and Carls-
son, S. (2014). Cnn features off-the-shelf: an astoun-
ding baseline for recognition. In Proceedings of the
IEEE conference on computer vision and pattern re-
cognition workshops, pages 806–813.
Simonyan, K. and Zisserman, A. (2014). Very deep con-
volutional networks for large-scale image recognition.
arXiv preprint arXiv:1409.1556.
Szegedy, C., Vanhoucke, V., Ioffe, S., Shlens, J., and Wo-
jna, Z. (2016). Rethinking the inception architecture
for computer vision. In Proceedings of the IEEE Con-
ference on Computer Vision and Pattern Recognition,
pages 2818–2826.
Tishby, N., Pereira, F. C., and Bialek, W. (2000). The
information bottleneck method. arXiv preprint phy-
sics/0004057.
Vinh, N. X., Epps, J., and Bailey, J. (2010). Informa-
tion theoretic measures for clusterings comparison:
Variants, properties, normalization and correction for
chance. Journal of Machine Learning Research,
11(Oct):2837–2854.
Zeiler, M. D. and Fergus, R. (2014). Visualizing and under-
standing convolutional networks. In European confe-
rence on computer vision, pages 818–833. Springer.
Zhang, T., Ramakrishnan, R., and Livny, M. (1996). Birch:
an efficient data clustering method for very large da-
tabases. In ACM Sigmod Record, volume 25, pages
103–114. ACM.
Coarse Clustering and Classification of Images with CNN Features for Participatory Sensing in Agriculture
495
