
VisABAC: A Tool for Visualising ABAC Policies
Charles Morisset and David Sanchez
School of Computing, Newcastle University, Newcastle upon Tyne, U.K.
Faculty of Engineering and Environment, Northumbria University, Newcastle upon Tyne, U.K.
Keywords:
Circle Packing, Visualisation, User Study, Attribute-based Access Control.
Abstract:
Authoring and editing access control policy can be a complex and cognitive demanding task, especially when
dealing with a large number of rules and attributes. Visualisation techniques are known to be helpful to
users analysing intricate data, and can, in some contexts, help decreasing the cognitive load. In this paper,
we propose a new tool, VisABAC, which enables the visualisation of attribute based access control policies
using the Circle Packing method. We used a participatory design, following a survey of existing visualisation
methods in access control. VisABAC is designed as a web-page component, developed in Javascript using
the D3.js library, and as such is easily usable without requiring any particular setup. In addition to presenting
VisABAC, we demonstrate its usability by conducting a controlled experiment with 32 participants, asking
them to change some attribute values in order to obtain a given decision for a policy, and measuring the time
taken by participants to conduct these tasks (the faster, the better). We show a small to medium effect size
(d = 0.44), thus indicating that VisABAC is a promising tool for authoring and editing access control policies.
1 INTRODUCTION
An access control policy can be seen a compendium
of authorisations that regulate the use of a particular
set of resources. They are defined by security ad-
ministrators and are processed by a trusted software
module called access control mechanism or reference
monitor (Benantar, 2005).
The first access control model is often considered
to be the Access Matrix (Lampson, 1974), where each
row indicates a subject, each column an object, and
each cell the access rights granted to the correspond-
ing subject over the corresponding object. This ap-
proach can be cumbersome for systems requiring a
large number of subjects and objects, and can lead to
policy misconfigurations (Bauer et al., 2008). Many
access control models have been introduced
1
, provid-
ing more suitable methods for designing access con-
trol policies in specific contexts.
General policy languages have subsequently been
created, including, but not limited to, ExPDT (Sack-
mann and K
¨
ahmer, 2008), EPAL (Ashley et al., 2003)
and the standard XACML (eXtensible Access Con-
trol Markup Language) (Standard, 2005). The lat-
1
See for instance (Barker, 2009) for an account on the va-
riety of access control models introduced over the past
decades.
est version, XACML 3.0, was released in 2013, and
standardizes Attribute-based Access Control, within
which an access request can be seen as a set of at-
tribute values, an access rule as a decision (e.g., per-
mit or deny) returned when a boolean expression (i.e.,
target and/or condition) holds for a request, and an ac-
cess policy as combining the decisions returned by a
collection of rules using a composition operator (e.g.,
deny-overrides or permit-overrides).
Although XACML is a very general and power-
ful framework, its underlying format is XML, which
makes XACML policies machine readable, but ar-
guably harder to author and edit by hand. The need
for including human factors in security is recognised
as an important problem: in the UK, for instance, 50%
of the worst breaches were caused by “inadvertent hu-
man error” (up from 31% in 2014) (PwC, 2015), and
there has been an increasing effort on usable security
(see, e.g., (Alavi et al., 2014; Lacey, 2009; Trudeau
et al., 2009; Kirlappos and Sasse, 2014)). The need
for regulatory mandates in computer security have
increased the number of policies and its complexity
far beyond human cognitive capacity (Barrett et al.,
2004). Security Administrators cope with such en-
tanglement by obviating irrelevant data, causing inad-
vertently security risks in the process (Vaniea et al.,
2008). Recent privacy breaches along with experi-
ments, such as Trudeau et al. (Trudeau et al., 2009)
Morisset, C. and Sanchez, D.
VisABAC: A Tool for Visualising ABAC Policies.
DOI: 10.5220/0006647401170126
In Proceedings of the 4th International Conference on Information Systems Security and Privacy (ICISSP 2018), pages 117-126
ISBN: 978-989-758-282-0
Copyright © 2018 by SCITEPRESS – Science and Technology Publications, Lda. All rights reser ved
117

corroborates this, showing that users (including ex-
perienced policy engineers) easily oversee details.
There is therefore a clear case to build tools helping
security administrators author and edit access control
policies.
Reducing complexity is an essential stage in any
kind of analysis and it is perfectly possible to simplify
a system without loosing essential functional prop-
erties. Information visualisation (Card et al., 1999)
comprises techniques that allow humans to under-
stand and manipulate huge quantities of abstract data
by simplification and it is being actively investigated
by security researchers (Vaniea et al., 2008; Becker
et al., 2014; Stepien et al., ). Languages such as
Mir6 (Heydon et al., 1990) have demonstrated that
it is even possible to specify security visually, albeit
with very limited complexity. In particular, visual-
isation techniques have been proposed in the con-
text of access control (Rosa, 2009; Heydon et al.,
1990), including the tools ALFA
2
(Axiomatics Lan-
guage for Authorization), which proposes a much
simplified textual syntax for describing XACML poli-
cies, or VisPE (Nergaard et al., 2015), which proposes
a Sratch-based interface. However, these approaches
tend to enhance the textual representation of the pol-
icy, rather than offer a visualisation of the evaluation
of a policy.
This paper contributes to solving this problem
by proposing a new tool, VisABAC, which provides
a visual interface for the evaluation of an attribute
based access control policies using the Circle Pack-
ing method. More precisely, we provide two main
contributions in this paper:
• We introduce the tool VisABAC, which is a client-
side browser application, and, given an attribute-
based access control policy, provides a textual
representation of that policy (inspired by XACML
3.0 and ALFA), a graphical visualisation using the
Circle Packing method, and an interface allowing
a policy designer to change policy and attribute
values. VisABAC is, to the best of our knowledge,
the first visualisation tool to support the XACML
3.0 extended decision set, which includes multiple
indeterminate decisions (indicating missing infor-
mation).
• We conduct a controlled experiment with 32 par-
ticipants, asked to interact with two versions
of VisABAC: the control group would only see
the textual representation, while the tested group
would see both the textual and graphical represen-
tations. Participants were given a series of ques-
tions, each question containing a policy and ask-
2
https://www.axiomatics.com/pure-xacml.html
ing the participant to modify attribute values in or-
der to obtain a specific decision. We show that the
tested group was, in average, faster to answer the
questions (with an effect size of d = 0.44 over the
monitored questions), and more likely to interact
with the tool (subjective preferences measured at
the end of the test showed that 76.47% of partici-
pants who tested the visualisation tool manifested
they felt more confident operating the policy.)
To the best of our knowledge, there is no standard
benchmark for evaluating the efficiency and usability
of policy authoring/editing tool, and we believe the
results of the controlled experiments could pave the
way towards establishing such a benchmark. In ad-
dition, VisABAC focuses on the visualisation of the
evaluation of policies, rather than on the structure of
the policy itself, and therefore is complementary to
several existing approaches, described in Section 2.
The rest of this paper is structured as follows:
we first introduce in Section 2 the background on
Attribute-Based Access Control, and related work on
the visualisation of access control. We then present
VisABAC in Section 3, the experiment in Section 4,
and the results are discussed in Section 5.
2 BACKGROUND AND RELATED
WORK
In this section, we first describe the notion of Attribute
Based Access Control (ABAC) policies, after which
we go through existing approaches, leading to our se-
lection of the Circle Packing method.
2.1 ABAC
As briefly described in the Introduction, ABAC con-
sists in considering an access request as a set of at-
tribute values. Following for instance the approach
adopted for PTaCL (Crampton et al., 2015), we there-
fore consider a set of attribute names A and a set of
attribute values V , such that the set of requests is de-
noted by Q = ℘(A × V ).
We assume here that the sets A and V are known
and fixed, and, in order to model missing information
(which is a key aspect of XACML 3.0), we consider
a request as a function q : A × V → {1,0,⊥}, such
that, given an attribute a and a value v, q(a,v) = 1 in-
dicates that a has the value v in q, q(a,v) = 0 indicates
that a does not have the value v in q, and q(a,v) = ⊥
indicates that we do not know whether a has the value
v in q or not.
An atomic target is defined as a pair (a, v), and a
composite target is defined as a proposition of atomic
ICISSP 2018 - 4th International Conference on Information Systems Security and Privacy
118

Table 1: Evaluation of the healthcare policy example on
some selected values for each atomic target.
Targets Rules Policy
t
1
t
2
t
3
t
2
∨t
3
r
1
r
2
p
1 1 1 1 Deny Permit Deny
0 1 1 1 NA Permit Permit
0 0 0 0 NA NA NA
0 ⊥ 0 ⊥ NA Indet(P) Indet(P)
⊥ 1 1 1 Indet(D) Permit Indet(PD)
⊥ 0 0 0 Indet(D) NA Indet(D)
targets. Since, in the controlled experiment presented
in Section 4, we targeted participants with no spe-
cific knowledge of access control, we only considered
simple conjunction (∧) and disjunction (∨) operators,
corresponding to the XACML AllOf and AnyOf ele-
ments, respectively. We leave the study of more com-
plex logical operators for future work.
Given a request q, the evaluation of an atomic
target t = (a,v) is equal to q(a,v). Here, we inter-
pret 1, 0, and ⊥ as the XACML elements Match,
NoMatch and Indeterminate, respectively. We use a
strong Kleene interpretation for the logical operators,
following the PTaCL and XACML semantics: given a
request q, and two targets t
1
and t
2
, the target t = t
1
∧t
2
evaluates to 1 if both t
1
and t
2
evaluates to 1, to 0 if
either t
1
or t
2
evaluates to 0, or to ⊥ otherwise. Simi-
larly, the target t = t
1
∨t
2
evaluates to 1 if either t
1
or
t
2
evaluates to 1, to 0 if both t
1
and t
2
evaluates to 0,
or to ⊥ otherwise.
An access rule is defined as a tuple (d,t), where d
is a decision (either Permit or Deny) and t is a target.
Given a request q, a rule (d,t) evaluates to d if t eval-
uates to 1, to NA (Not-Applicable) if t evaluates to 0,
to Indet(P)
3
if d = Permit and t evaluates to ⊥, or to
Indet(D) if d = Deny and t evaluates to ⊥.
An access policy is a collection of rules,
composed together with a composition opera-
tor. We implemented in VisABAC the six main
XACML operators: permit-overrides (POV), deny-
overrides (DOV), permit-unless-deny (PUD), deny-
unless-permit (DUP), first-applicable (FA), only-one-
applicable (OOA). We refer to the main documenta-
tion of XACML or for instance to (Morisset and Zan-
none, 2014) for the full definitions of these operators.
For instance, let us consider a health-care pol-
icy, regulating the access to a medical record, where
intuitively, access is permitted when there is no ex-
plicit disagreement from the patient and when either
the hospital or the concerned surgeon agrees for the
access, and access is denied otherwise. There are
therefore three possible attribute values/atomic tar-
3
For the sake of compactness, we abbreviate the XACML
Indeterminate extended decisions to Indet.
gets: t
1
= (patient, disagree), t
2
= (hospital, agree)
and t
3
= (surgeon, agrees). We then define two rules,
r
1
= (Deny,t
1
) and r
2
= (Permit,t
2
∨t
3
), and the pol-
icy p = DOV (r
1
,r
2
). The evaluations of these ele-
ments are presented in Table 1. It is worth observing
that this simple policy can in practice evaluate to ev-
ery possible XACML decision, depending on the val-
ues of the atomic targets.
A straight-forward machine readable textual rep-
resentation of this policy is presented below. We use
this format in VisABAC, in addition to the graphical
representation.
R1: Deny if PATIENT_disagrees
R2: Permit if OR(HOSPITAL_agrees,
SURGEON_agrees)
P: DOV(R1,R2)
2.2 Visualisation for Access Control
We now present visualisation techniques, some of
them actively applied into access control, that were
considered in the process of building VisABAC. Al-
though there is a rich literature for visualisation in se-
curity, few approaches deal with Attribute-based Ac-
cess Control, and these approaches tend to work on
the structure of the policy itself, such as VisPE (Ner-
gaard et al., 2015), rather than on policy evaluation.
There is a limited literature studying trees as a
way to visually find conflicts inside access policies;
this seems surprising since trees are used to create
XACML policies itself and it is the preferred method
for explaining XACML policies in the OASIS spec-
ification (Rissanen et al., 2009). Rosa (Rosa, 2009)
explore this approach for very light graphs in its
XACML Viz prototype. Pina Ros et al. (Pina Ros
et al., 2012) uses trees (Matching tree and Combin-
ing Tree) to optimise the evaluation of applicable
rules in an access policy engine called XEngine. The
tool is not aimed at visualisation, however, the paper
shows how policies are organised in a tree structure
than can be directly match to a tree representation.
Rao et al. (Rao et al., 2009) propose multi-level grids
to visualise results of multiple types of access con-
trol policy analysis and authoring. Although this ap-
proach is simple to implement, it can be very space
consuming.Semantic Substrates (Card et al., 1999)
use spatial representation to group common attributes
by regions. Pan and Xu (Pan et al., 2013; Pan and
Xu, 2012) propose a visualisation toolkit called “Pol-
icy Visualisation Framework (PVF)” which extends
XACML to support RBAC aiming to provide a clearer
representation than conventional role-permission tree
graphs. They further propose in (Pan and Xu, 2012)
to use treemaps (Johnson and Shneiderman, 1991)
VisABAC: A Tool for Visualising ABAC Policies
119
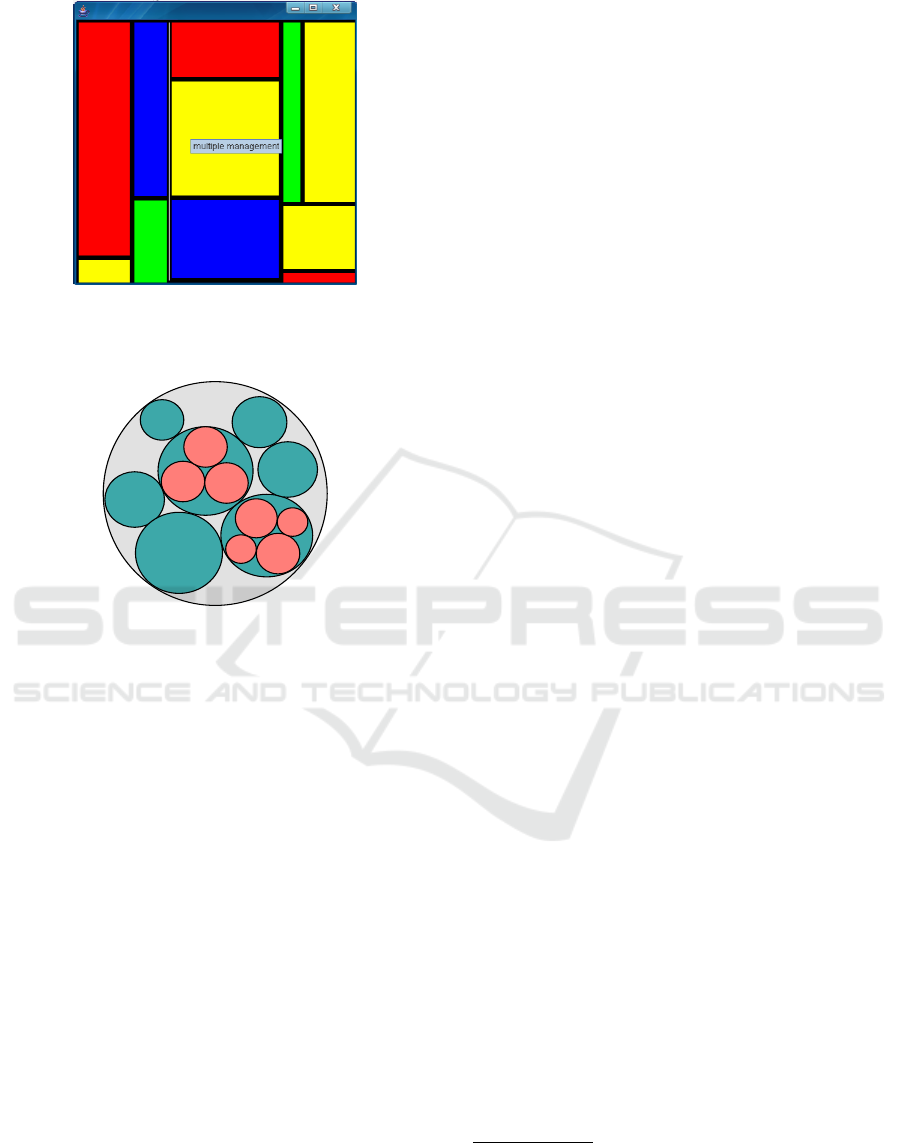
Figure 1: Tree-maps as a visualisation tool for analysing
conflict detection for multi-domain policies (Pan and Xu,
2012).
Figure 2: Circle Packing Diagram (Wang et al., 2006).
Level 0,1 and 2 painted light grey, green and red respec-
tively.
to complement Semantic Substrates instead of adja-
cency matrices to form macro and micro vision re-
spectively. Treemaps visualise hierarchical tree struc-
tures using a root rectangle that contains all nodes of a
given tree. Each subsequent level of the tree structure
divides the above square according to a particular at-
tribute of a node, such as size. They are used in (Pan
and Xu, 2012) to analyse RBAC access control po-
lices when multi-domain information is exchanged
(Figure 1).
Circle Packing (Wang et al., 2006) is very similar
in concept to Treemaps, as it was inspired by them.
As a marked difference, it uses circles instead of rect-
angles which give them a lower space efficiency ratio;
however they express more clearly the hierarchy they
represent. Figure 2 shows a very simple Circle Pack-
ing diagram which has three levels. Wang et al. (Wang
et al., 2006) have shown with a file visualisation tool
(FVT) that it is possible to handle efficiently thou-
sands of nodes with this method. However, to the best
of our knowledge, Circle Packing has never been used
in the context of access control.
3 VisABAC
In this section, we first explain the process with which
we have designed VisABAC, after which we describe
the tool itself
4
.
3.1 Participatory Design
In general, visualisation is not only a set of techniques
but also a process (Meyer, 2011) therefore, in order to
achieve a successful representation, it is important to
work closely with users affected by the shortcomings
of traditional analysis. Hence, we work closely with 5
members of our research group using a participatory
design (Ritter et al., 2014). That expertise targeted
essential usability aspects and the feedback acquired
(heuristic approach (Ritter et al., 2014)) was comple-
mented by heuristic evaluation and informal/formal
evaluation by recruited participants.
Some approaches, such as: graphs, hierarchical
graphs, hypergraphs, Euler diagrams, and binary de-
cision diagrams (BDD), have already been identified
as too complex to implement, visualise or unsuitable
to be of any practical use (Fisler et al., 2005; Heydon
et al., 1990; Montemayor et al., 2006; Fisler et al.,
2005; Kolovski, 2007). Some candidates, on the other
hand, were particularly promising, including trees and
treemaps, which have been applied previously to se-
curity visualisation. However, some limitations were
found during the participatory process, even after try-
ing to refine those ideas using zoomable treemaps and
collapsible trees:
• In particular, the relationship between screen state
utilisation and navigability has been highlighted
as very important by the participants. Screen util-
isation for collapsible trees, for example, was very
low (more than 50% is background)
5
but users
easily navigated inside the access control policy;
on the other hand, zoomable treemaps proposed a
full screen state utilisation but users got lost inside
the policy quickly.
• Treemaps made clear that once navigating inside
a policy users easily forgot the evaluation result
of the particular policy they were inspecting, hav-
ing to go a level back again to remember what the
outcome was.
A tradeoff between efficiency and usability was
found in circle packing, a visualisation technique crit-
4
VisABAC is available for demonstration at
http://homepages.cs.ncl.ac.uk/charles.morisset/visabac
5
A prototype version of VisABAC with collapsible trees
is available alongside the main tool, illustrating the poor
screen utilisation.
ICISSP 2018 - 4th International Conference on Information Systems Security and Privacy
120
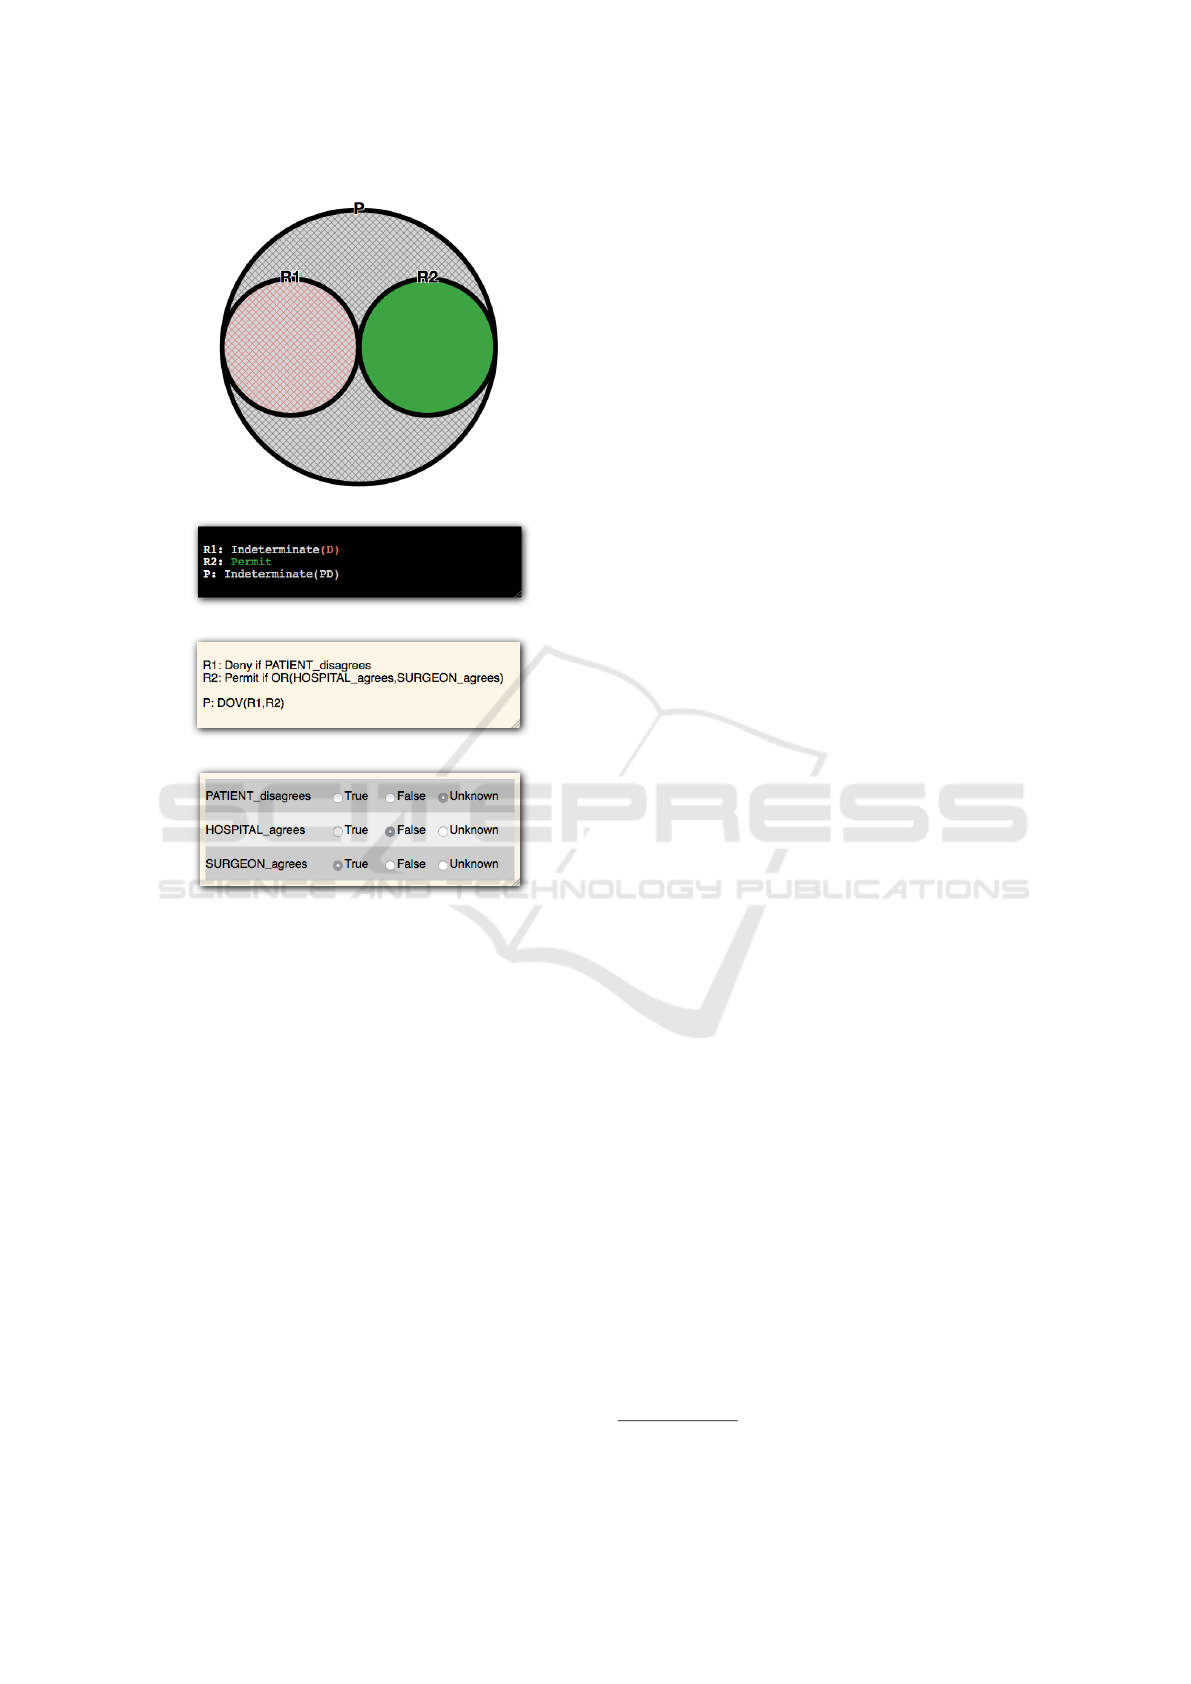
(a) Visual Decision Diagram
(b) Decision box
(c) Policy
(d) Attribute Values
Figure 3: Figure 3(a) and Figure 3(b) show the evaluation
of the policy P, represented in 3(c), when attributes are set
as 3(d) (fifth row of Table 1). The largest circle (P) is filled
in with a grey pattern, since it evaluates to Indet(PD), the
circle for R1 is filled in with a red pattern, since it evaluates
to Indet(D), and the circle for R2 is filled in green, since it
evaluates to Permit.
icised (Wang et al., 2006) for not being as space ef-
ficient as treemaps but praised for providing a better
hierarchy illusion than those obtained by, for exam-
ple, treemap representations.
3.2 VisABAC Interface
The VisABAC interface is designed as a web page
component and, as such, runs on any web browser.
The interface consists of four main components,
which we now detail, using the visualisation of the
policy described in Section 2.1 as an example (Fig-
ure 3).
The Policy component (Figure 3(c)) is a textual
box, directly editable from the browser, which con-
tains the definition of the policy following the syntax
described in Section 2.1. This definition can either
be typed in, loaded from a set of existing samples,
or loaded from a file. These rules are automatically
parsed into JavaScript Object Notation (JSON), where
the text of each rule is identified by its name. For in-
stance, the policy described in Section 2.1 would cor-
respond to the object:
policyRules=
{"R1": "Permit if PATIENT_disagrees",
"R2": "Permit if OR(HOSPITAL_agrees,
SURGEON_agrees)"
"P": "DOV(R1,R2)"}
The Attributes component (Figure 3(d)) allows the
user to set the value for each attribute value: true,
false, or unknown. For instance, Figure 3(d) corre-
sponds to a request where we do not know if the pa-
tient disagrees to the access, we know that the hospi-
tal does not agree to the access, and that the surgeon
agrees, which corresponds to the fifth row of Table 1.
The Decision component (Figure 3(b)) lists, for
each rule in the Policy component, the decision ob-
tained for that rule. These decisions are obtained by
iterating through the policyRules object, following
the evaluation rules established in (Crampton et al.,
2015). The evaluation returns an object with the same
structure, but where each rule has been replaced by its
decision. In the case where a rule is not well-formed
(e.g., missing reference, syntax error), it evaluates to
Indeterminate(PD). Note that cycles in rule defini-
tions are not currently detected, and an error would
occur.
Finally, the Visual component (Figure 3(a)) uses
Zoomable Circle Packing to visually explore ac-
cess control policies, using the D3.js library
6
. The
zoomable aspect is a crucial one, as it allows the
space occupied by the visualisation to remain con-
stant. A circle is either a rule or a composition of
rules grouped by a composition operators. As a con-
sequence, a policy comprised of sub-policies is rep-
resented by circles containing sub-circles in a similar
hierarchy as the given policy. The visual diagram is
dynamic, and is updated when the policy or the at-
tributes are updated and a new evaluation is calcu-
lated. Each circle is defined by two characteristics:
• The colour, which matches the result of the poli-
cy/rule they represent: green is for Permit, red for
Deny, white for NA, patterned-green for Indet(P),
patterned-red for Indet(D), and patterned-grey for
Indet(PD). We have also developed a colour de-
ficiency mode, which caters for different types
of colour deficiencies. In addition, since these
6
https://d3js.org
VisABAC: A Tool for Visualising ABAC Policies
121
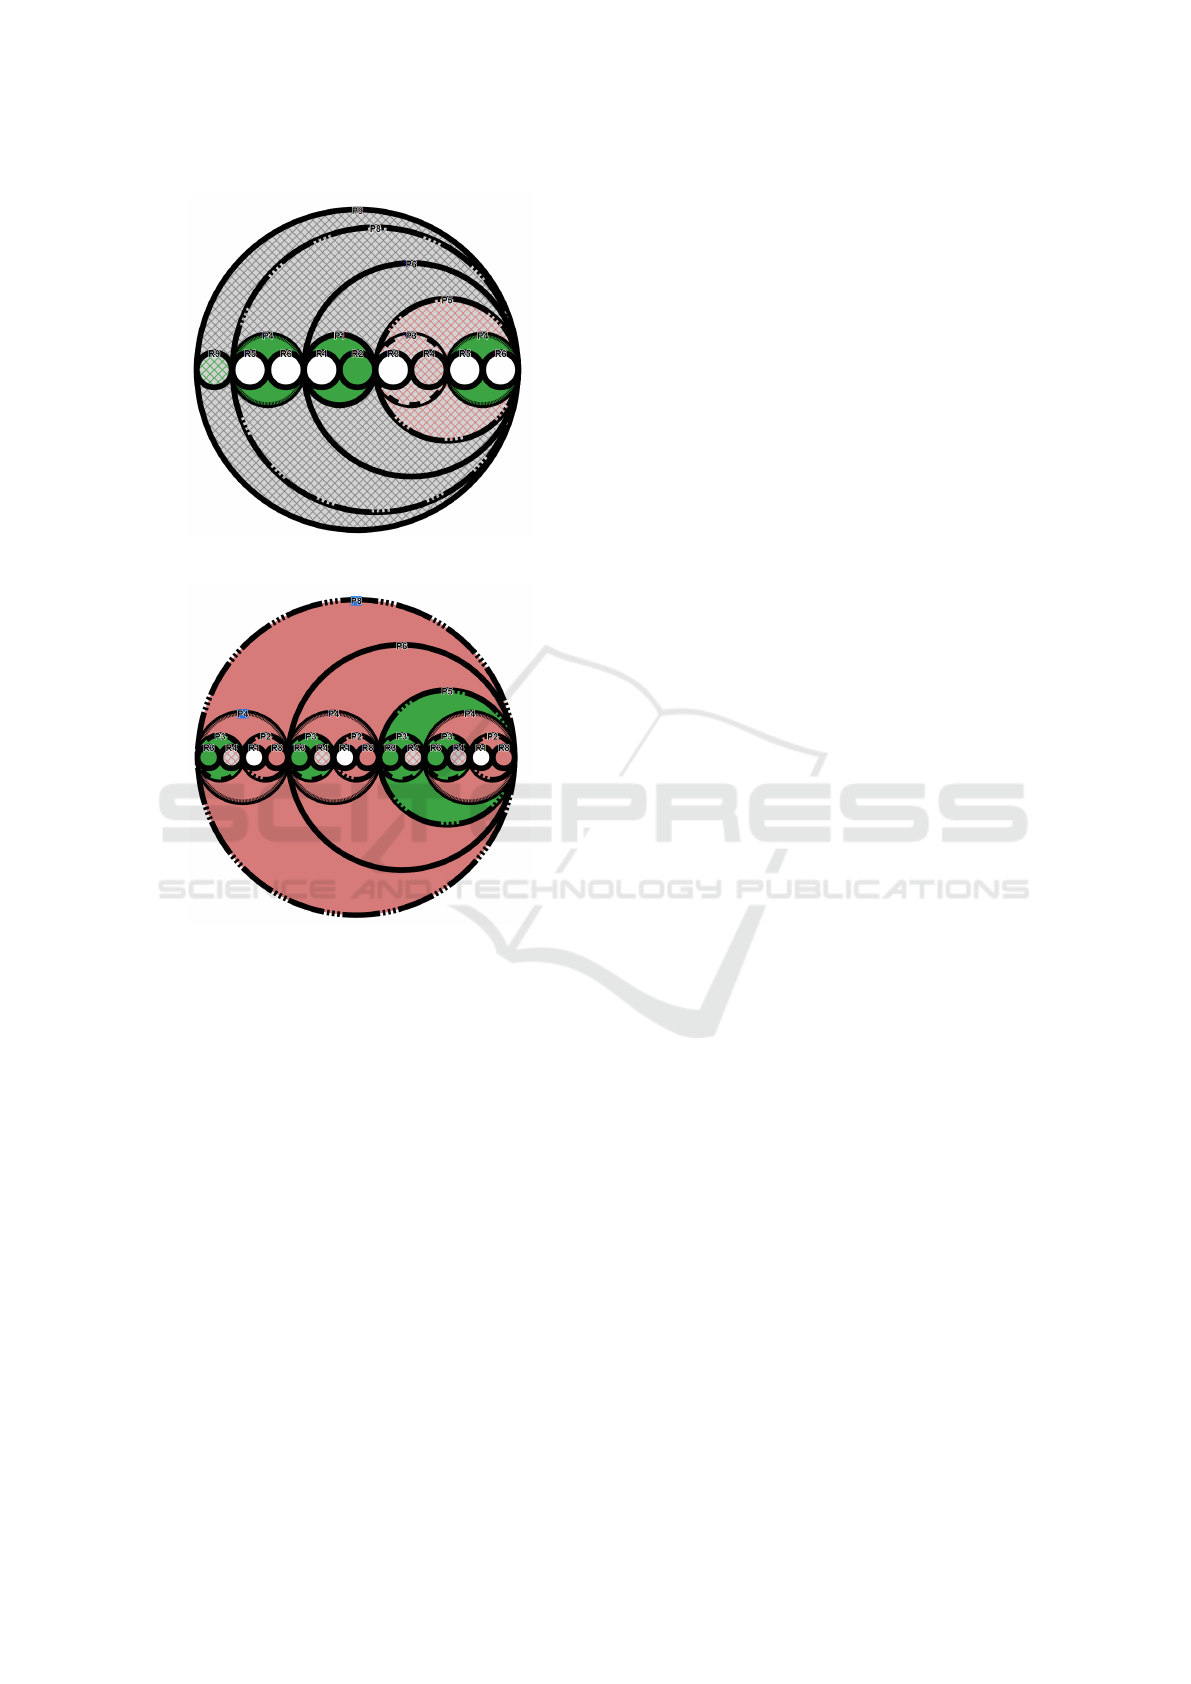
(a) Policy with 9 atomic rules and 9 binary poli-
cies.
(b) Variation of 4(a) with sub-policies used
multiple times.
Figure 4: Circle packing visualisation of arbitrary complex
policies in VisABAC.
colours are set through a simple CSS (Cascading
Style Sheet), they could be user configurable.
• The line pattern which matches the operator used.
In particular, we use full lines for Deny-overrides
and dashed lines for Permit-overrides. The lines
for the other operators can be found in the online
help of the tool.
For instance, Figure 3(a) shows that Level 0 (P)
represents the whole policy by the most outer circle
line; Level 1 (R1 and R2) represent the first level of
the tree policy with smaller circles inside. A zoom
on the inner circles would display their respective tar-
gets, since they are atomic policies. Figure 4 illus-
trates more complex examples of ABAC policies.
4 EVALUATION
VisABAC, presented in the previous section, is rela-
tively easy to use, since it is defined as an in-browser
application. The input language for policies is rel-
atively straight-forward from an Attribute-based Ac-
cess Control perspective. More importantly, the D3.js
library for Circle Packing is particularly fluid, mak-
ing the tool very responsive. Our participatory de-
sign elicited Circle Packing as the preferred visualisa-
tion technique, compared with other techniques such
as foldable trees or treemaps. However, we are also
interested in understanding whether VisABAC is ef-
fectively usable, i.e, whether its proposed graphical
representation could help users in their tasks.
Nielsen and Levy argue that usability should be
measured according to subjective user preferences
and objective performance measures, since, in some
cases, users have favoured interfaces that are measur-
ably worse for them (Nielsen and Levy, 1994). Sim-
ilarly, MacLean et al. (MacLean et al., 1985) found
that subjects inclined towards a proven slower data
entry method would still prefer it as long as it was not
20% slower than the faster method.
Hence, in addition to a subjective user preference
questionnaire, we want to design an objective perfor-
mance measure for using VisABAC. To the best of our
knowledge, there is no standard benchmark for the us-
ability of tools for access control policies, and there-
fore we define a new method in this paper. Roughly
speaking, we give the user a fixed policy, a valuation
for the attributes, and ask the user to change this valu-
ation in order for the policy to evaluate to a specified
decision. Our hypothesis is that the faster the user is
able to do this task, the more they understand the pol-
icy, and thus the better is the tool with which the user
interacts. We now describe this experimental settings,
and we discuss the limitations of our approach in Sec-
tion 6.
4.1 User Interface
We conduct a controlled-group experiment, where
users in different groups see a different user interface.
We define two different user interfaces (UI):
• The Graphics UI is an extension of the VisABAC
interface, described in Section 3.2, with the addi-
tion of two main elements: the context box, which
introduces the context of the policy, in English;
and the question box, which specifies the expected
decision. The boxes for the policy, the attributes,
ICISSP 2018 - 4th International Conference on Information Systems Security and Privacy
122

the decision box, and the visual decision diagram,
are as described in Figure 3
7
.
• The Text UI is similar to the Graphics UI, as the
notable exception that the visual decision diagram
box is missing. However, the user still has access
to the evaluation of the policy with the decision
box.
4.2 Policy Question
The aim of either UI described above is to answer a
question, given a context and a policy. Ideally, we
would like to ask questions related to any aspect of
the editing or maintenance of a policy. However, we
believe that this would introduce too many different
dimensions to control, and we focus instead on ques-
tions related to policy evaluation. We leave for future
work the study of more complex questions. The con-
text is a simple description of the motivation behind
the policy, for instance, for the policy described in
Section 2.1 and Figure 3, the context is:
Releasing medical records in a certain hospi-
tal requires compliance with an access control
policy. The system checks events with state-
ments that return True or False if the forms
have been filled and validated by the corre-
sponding departments.
The attribute values are initially set so that the policy
evaluates to Indet(PD), and the question is:
Can you change the radio buttons so that PC
evaluates to Deny ?
The user can change any radio button, and then click
on a button Evaluate, which refreshes the different
boxes with the new policy evaluation. There is no
limit on the authorised number of evaluation per ques-
tion, and they can go to the next question by clicking
on the Submit button. They were also instructed they
could go to the next question at any time if they did
not wish to submit an answer for the current question,
and this would be recorded as a wrong answer.
The experiment consists of a total of 32 sub-
questions, grouped in 8 main questions. All sub-
questions within a single main question have the same
context, and only differ on minor details. For in-
stance, a sub-question in the same group than the pol-
icy above use the First-Applicable (FA) operator to
combine R1 and R2 instead of the Deny-Overrides
(DOV). The main questions are denoted from Q1 to
Q8, the sub-questions for the main question Q
i
are
denoted from Q
i
a to Q
i
d.
7
The full test with both interfaces is available from the front
page of the tool.
4.3 Protocol
Each recruited participant P
i
goes through the follow-
ing steps:
1. After reading and signing the participant consent
form, P
i
is randomly assigned to either the Text
group (the control group) or the Graphics group
(the tested group).
2. P
i
is presented with a short introduction about
ABAC, going through a simple policy example
(similar to that described in Section 2.1). At
this stage, they can use the Text UI on the in-
troduced example (the Graphics UI is only intro-
duced in Step 4 for the Graphics group) and ask
any question. They are also explained what is ex-
pected of them and informed that their time will
be recorded. They are also informed that some
policies are on purpose hard to analyse, and that
we are measuring how the interface helps them,
rather than assessing them. This step takes in av-
erage 10 minutes.
3. Once they feel confident about using the tool, they
start answering the first series of main questions,
Q1 and Q2 (8 sub-questions in total), using the
Text UI, regardless of their assigned group.
4. After Q2, if P
i
is in the Text group, they keep
answering Q3 to Q8 (24 sub-questions in total);
If P
i
is in the Graphics group, they switch to the
Graphics UI, and they are briefly introduced with
the specifics of the Circle Packing representation;
They then answer Q3 to Q8 using the Graphics
UI.
5. After Q8, P
i
is debriefed, and explained the pur-
pose of the experiment. According to recom-
mended practices (Nielsen, 1993), a £10 Amazon
voucher is given as compensation for their time.
The entire protocol was designed to take, in av-
erage, between 30 to 45 minutes, including 20 min-
utes of actual assessment. The time to answer each
question was visible to the participant, and although
there was no strict countdown, to avoid adding time
pressure, participants were encouraged to move on to
the next question if they were spending more than 5
minutes on a sub-question (which happened in only
one instance). The experiment took place in the same
office and the same computer (a 27” iMac), in order
to control environmental changes. Participants were
asked about colour deficiency, but none was indicated
in our experiment.
4.4 Objective Performance Measure
Intuitively, we want to compare the time taken by
users in the two different groups, in order to evalu-
VisABAC: A Tool for Visualising ABAC Policies
123
ate whether the Graphics UI was beneficial. How-
ever, performance measure among different individ-
uals varies according to the capabilities of each one,
and the nature of the experiment makes it hard to en-
sure the distribution of the users in the groups is con-
sistent with user capabilities. As a consequence, a
procedure of normalisation had to be performed in or-
der to compare data.
The selected normalisation value was the inverse
of the number of seconds each participant spent on
solving Q2 (i.e., the total time spent on subquestions
Q2a, Q2b, Q2c and Q2d). We denote this as the nor-
malisation coefficient α
i
, for each participant P
i
. Sub-
sequently, the time taken by P
i
to answer each ques-
tion is normalised by multiplying it by α
i
. If this value
is lower than 1, this implies the subject performed a
particular question faster than Q
2
while a larger value
represents the opposite. For instance, if P
1
took 4 sec-
onds to complete Q2 (α
1
= 0.25) and 6 seconds to
complete Q3, their normalised time for Q3 is 1.5; If
P
2
took 16 seconds to complete Q2 (α
2
= 0.0625) and
23 seconds to complete Q3, their normalised time for
Q3 is 1.4375. In other words, even though, absolutely
speaking, P
2
was slower than P
1
for Q3, they were
comparatively faster.
This choice for the normalisation function comes
from the fact that we have designed different ques-
tions with different levels of difficulty, Q7 being the
most difficult. Hence, we expect that all users will
spend more time to answer Q7 than Q2, and we want
to measure this difference, rather than measuring di-
rectly the difference between users. Q2 was selected
as the normalisation value since all participants, re-
gardless of their group, had to do it with the Text
UI, and it was assumed some familiarity was already
gained by the user after performing Q1, since Q1 and
Q2 have a similar complexity level.
4.5 Subjective User Preferences
Subjective Testing was performed on users who were
exposed to the visualisation technique. A relatively
standard questionnaire was presented to collect their
impressions using a Likert scale (Nielsen and Levy,
1994) after finishing the objective testing.
5 RESULTS
We recruited 32 participants over 4 weeks, mostly
among undergraduate Computer Science students,
with no formal knowledge of ABAC, and randomly
assigned to the groups (16 participants each). The
aim of this study was to assess the impact of circle
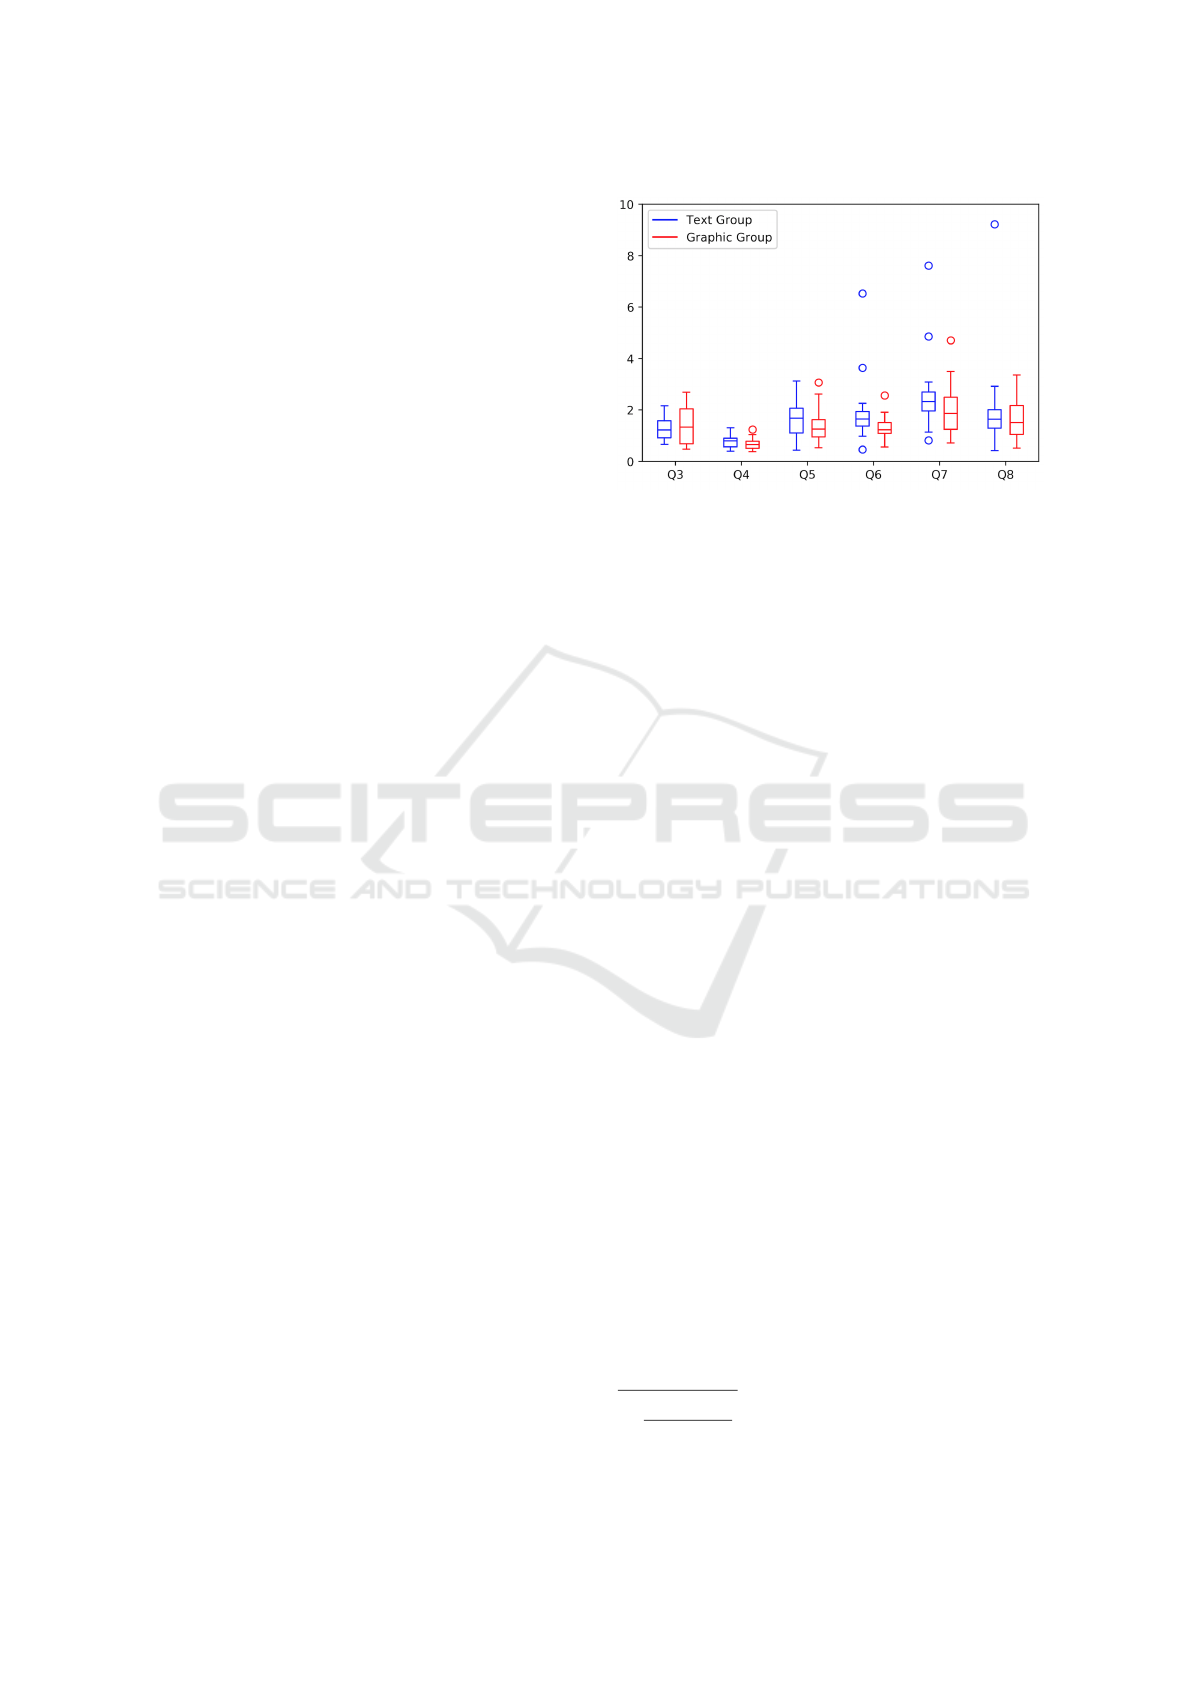
Figure 5: Boxplots comparison of normalised times for
questions Q3 to Q8 between the Text and Graphics groups
(lower is better). The body of each box represents the in-
tervals between the first (q
1
) and third quartiles (q
3
), the
bar represents the mean, the whiskers represent the max-
imal and minimal values between q
3
+ 1.5(q
3
− q
1
) and
q
1
− 1.5(q
3
− q
1
), fliers represent points outside of this
range.
packing, so we targeted a relatively uniform group in
terms of prior knowledge, rather than experts in Ac-
cess Control. Figure 5 shows the normalised time
average of participants for each question, including
wrong answers (there are 8 wrong answers in each
group). The mean for the Graphics group is lower
(i.e., better) from Q4 to Q8 (comparatively to the time
taken for Q2) compared to the Text group. The mean
of Graphics group is higher for Q3, which could indi-
cate a small learning curve with the Graphics UI.
Altogether, the normalised mean time for partici-
pants in the Text group to answer all questions from
Q3 to Q8 is m
t
= 10.38 (with a confidence interval of
[7.88,12.88] and a standard deviation of σ
t
= 5.10).
In comparison, the normalised mean time for partici-
pants in the Graphics group is m
g
= 8.58 (with a con-
fidence interval of [7.33,9.83] and a standard devia-
tion of σ
g
= 2.55). This allows us to conclude that
the effect size
8
is 0.44, which is traditionally seen as
a small to medium effect size (Cohen, 1988). In addi-
tion, the results of the user preferences survey showed
that 82.35% of participants described the presence of
the visualisation as useful; 76.47% of participants felt
more confident operating the policy with the presence
of the graph and 47.06% agree (35.39% agree to some
extent) that the presence of the graph makes them feel
they understand the policy better. Some questions
were however very conclusive, e.g. if complex men-
tal operations were needed, which could indicate this
question was not well formulated.
8
Cohen’s effect is computed as (m
t
− m
g
) divided by
q
(σ
2
t
+ σ
2
g
)/2
ICISSP 2018 - 4th International Conference on Information Systems Security and Privacy
124

6 CONCLUSIONS
VisABAC: A Usable Tool. VisABAC presents a
way to visually overview an access control pol-
icy, where composition operations seems to be ade-
quately represented and details are disclosed on de-
mand thanks to the zooming and progressive disclo-
sure of tags. VisABAC also provides interactivity to
the user and increments the exploring of the policy in
a graphical manner. The response was overall posi-
tive, both during the participatory design and with the
subjective user preferences survey. Most users liked
the concept very much, found it intuitive and easy to
use, although they remarked that some training could
have decrease their response time. Furthermore, the
experiment showed a small to medium effect size, al-
lowing to conclude that VisABAC improves the han-
dling of attribute-based access control policies for a
population with no formal training. Of course, at this
stage, it is not yet clear whether VisABAC can pro-
vide a significant contribution to access control ex-
perts, but we believe the tool as presented here and
our results pave the way towards an experiment at a
larger scale.
Comparison with Other Visualisation Techniques.
Although the experiment focuses only on the cir-
cle packing technique, it is worth recalling that Vis-
ABAC was designed using a participatory design,
where other techniques were rejected as less effec-
tive compared to circle packing. Furthermore, most
approaches described in Section 2 do not focus on
attribute-based access control, which is now con-
sidered to be standard. We believe that a wide-
ranging comparison of different visualisation tech-
niques would require a strong benchmark and a clear
methodology, and we designed our approach to be a
first step in that direction.
Extensions. Since VisABAC is designed as a web-
page component, using HTML (for the basic inter-
face), JSON (for the encoding of the policies), and
Javascript (for the evaluation of policies and the vi-
sualisation elements), additional visualisation tech-
niques can be added. The collapsible tree approach
(see Section 2.2) has received some positive response
during the participatory design phase of VisABAC
(policies tend to be naturally seen as trees). If the
space occupation issue could be fixed, they could be
an interesting candidate to integrate into VisABAC. In
particular, navigating large networks with hierarchies
and zooming has been explored in authors such as
Eick and Wills (Eick and Wills, 1993) with thorough
discussion about node placement algorithms. In ad-
dition, we could also embed the visualisation frame-
work into a more capable tool that could parse di-
rectly XACML policies, making it possible to com-
pare real XACML cases against their visualisation
(and not synthetic ones), and include authoring tools
such as VisPE (Nergaard et al., 2015). This would fa-
cilitate the deployment of VisABAC for realistic ex-
periments with field experts.
ACKNOWLEDGEMENTS
This work was partially sponsored by the Research
Institute in Cyber Security (RISCS) in collaboration
with the National Cyber Security Centre (NCSC). The
authors would also like to thank Nick Holliman from
Newcastle University for very useful discussions on
visualisation techniques.
REFERENCES
Alavi, R., Islam, S., and Mouratidis, H. (2014). HAS
2014. pages 297–305, Cham. Springer International
Publishing.
Ashley, P., Hada, S., Karjoth, G., Powers, C., and Schunter,
M. (2003). Enterprise privacy authorization language
(epal). IBM Research.
Barker, S. (2009). The next 700 access control models or a
unifying meta-model? In SACMAT, pages 187–196.
ACM.
Barrett, R., Kandogan, E., Maglio, P. P., Haber, E. M.,
Takayama, L. A., and Prabaker, M. (2004). Field
studies of computer system administrators: Analysis
of system management tools and practices. In Pro-
ceedings of the 2004 ACM Conference on Computer
Supported Cooperative Work, CSCW ’04, pages 388–
395.
Bauer, L., Garriss, S., and Reiter, M. K. (2008). Detect-
ing and resolving policy misconfigurations in access-
control systems. In SACMAT, pages 185–194. ACM.
Becker, J., Heddier, M.,
¨
Oks
¨
uz, A., and Knackstedt, R.
(2014). The effect of providing visualizations in pri-
vacy policies on trust in data privacy and security. In
2014 47th Hawaii International Conference on Sys-
tem Sciences, pages 3224–3233.
Benantar, M. (2005). Access Control Systems: Secu-
rity, Identity Management and Trust Models. Access
Control Systems: Security, Identity Management and
Trust Models. Springer US.
Card, S. K., Mackinlay, J. D., and Shneiderman, B., editors
(1999). Readings in Information Visualization: Using
Vision to Think. Morgan Kaufmann Publishers Inc.,
San Francisco, CA, USA.
VisABAC: A Tool for Visualising ABAC Policies
125

Cohen, J. (1988). Statistical power analysis for the behav-
ioral sciences lawrence earlbaum associates. Hills-
dale, NJ, pages 20–26.
Crampton, J., Morisset, C., and Zannone, N. (2015).
On missing attributes in access control: Non-
deterministic and probabilistic attribute retrieval. In
SACMAT, pages 99–109. ACM.
Eick, S. G. and Wills, G. J. (1993). Navigating large net-
works with hierarchies. In IEEE Conference on Visu-
alization, 1993., pages 204–210.
Fisler, K., Krishnamurthi, S., Meyerovich, L. A., and
Tschantz, M. C. (2005). Verification and change-
impact analysis of access-control policies. In Pro-
ceedings of the 27th International Conference on Soft-
ware Engineering, ICSE ’05, pages 196–205, New
York, NY, USA. ACM.
Heydon, A., Maimone, M. W., Tygar, J. D., Wing, J. M., and
Zaremski, A. M. (1990). Miro: visual specification of
security. IEEE Transactions on Software Engineering,
16(10):1185–1197.
Johnson, B. and Shneiderman, B. (1991). Tree-maps: A
space-filling approach to the visualization of hierar-
chical information structures. In Proceedings of the
2nd Conference on Visualization ’91, pages 284–291,
Los Alamitos, CA, USA. IEEE.
Kirlappos, I. and Sasse, M. A. (2014). HAS 2014, chap-
ter What Usable Security Really Means: Trusting and
Engaging Users, pages 69–78. Springer.
Kolovski, V. (2007). Logic-based access control policy
specification and management. Technical report, De-
partment of Computer Science, University of Mary-
land, College Park.
Lacey, D. (2009). Managing the Human Factor in Infor-
mation Security: How to Win over Staff and Influence
Business Managers. Wiley Publishing.
Lampson, B. W. (1974). Protection. Operating Systems
Review, 8(1):18–24.
MacLean, A., Barnard, P., and Wilson, M. (1985). Eval-
uating the human interface of a data entry system:
user choice and performance measures yield different
tradeoff functions. People and computers: Designing
the interface, 5:45–61.
Meyer, M. (2011). Information visualization for scientific
discovery.
Montemayor, J., Freeman, A., Gersh, J., Llanso, T., and Pa-
trone, D. (2006). Information visualization for rule-
based resource access control. In Proc. of Int. Sympo-
sium on Usable Privacy and Security (SOUPS), pages
24–0.
Morisset, C. and Zannone, N. (2014). Reduction of access
control decisions. In SACMAT, pages 53–62. ACM.
Nergaard, H., Ulltveit-Moe, N., and Gjøsæter, T. (2015).
ViSPE: A Graphical Policy Editor for XACML, pages
107–121. Springer International Publishing, Cham.
Nielsen, J. (1993). Usability Engineering. Morgan Kauf-
mann Publishers Inc., San Francisco, CA, USA.
Nielsen, J. and Levy, J. (1994). Measuring usability: Prefer-
ence vs. performance. Commun. ACM, 37(4):66–75.
Pan, L., Liu, N., and Zi, X. (2013). Visualization frame-
work for inter-domain access control policy integra-
tion. China Communications, 10(3):67–75.
Pan, L. and Xu, Q. (2012). Visualization analysis of multi-
domain access control policy integration based on
tree-maps and semantic substrates. Intelligent Infor-
mation Management, 4(5):188–193.
Pina Ros, S., Lischka, M., and G
´
omez M
´
armol, F. (2012).
Graph-based xacml evaluation. In Proceedings of the
17th ACM Symposium on Access Control Models and
Technologies, SACMAT ’12, pages 83–92, New York,
NY, USA. ACM.
PwC (2015). 2015 information security breaches survey.
Technical report, HM Government and PwC Consult-
ing and Infosecurity Europe.
Rao, P., Ghinita, G., Bertino, E., and Lobo, J. (2009). Vi-
sualization for access control policy analysis results
using multi-level grids. In IEEE International Sym-
posium on Policies for Distributed Systems and Net-
works, 2009., pages 25–28.
Rissanen, E., Lockhart, H., and Moses, T. (2009). Xacml
v3. 0 administration and delegation profile version 1.0.
Committee Draft, 1.
Ritter, F. E., Baxter, G. D., and Churchill, E. F. (2014).
Foundations for Designing User-Centered Systems.
Springer, Springer London Heidelberg New York Dor-
drecht.
Rosa, W. D. (2009). Toward visualizing potential policy
conflicts in extensible access control markup language
(xacml). Theses and dissertations, University of New
Orleans, New Orleans.
Sackmann, S. and K
¨
ahmer, M. (2008). Expdt: Ein policy-
basierter ansatz zur automatisierung von compliance.
Wirtschaftsinformatik, 50(5):366–374.
Standard, O. (2005). extensible access control markup lan-
guage (xacml) version 2.0.
Stepien, B., Matwin, S., and Felty, A. Strategies for reduc-
ing risks of inconsistencies in access control policies.
Trudeau, S., Sinclair, S., and Smith, S. W. (2009). The ef-
fects of introspection on creating privacy policy. In
WPES ’09: Proceedings of the 8th ACM workshop
on Privacy in the electronic society, pages 1–10, New
York, NY, USA. ACM.
Vaniea, K., Ni, Q., Cranor, L., and Bertino, E. (2008). Ac-
cess control policy analysis and visualization tools for
security professionals. In SOUPS Workshop (USM).
Wang, W., Wang, H., Dai, G., and Wang, H. (2006). Visu-
alization of large hierarchical data by circle packing.
In Proceedings of the SIGCHI Conference on Human
Factors in Computing Systems, CHI ’06, pages 517–
520, New York, NY, USA. ACM.
ICISSP 2018 - 4th International Conference on Information Systems Security and Privacy
126
