
High-Dynamic and High-resolution Automatic Photon Counting OTDR
for Optical Fiber Network Monitoring
Felipe Calliari
1
, Luis E. Y. Herrera
1
, Jean Pierre von der Weid
1
and Gustavo C. Amaral
1,2
1
Center for Telecommunication Studies, Pontifical Catholic University of Rio de Janeiro, Rio de Janeiro 22451-900, Brazil
2
Institute for Quantum Information Science, and Department of Physics and Astronomy,
University of Calgary, Calgary, Canada
Keywords:
Photon-Counting OTDR, Signal Processing, FPGA.
Abstract:
In this work, the development of a hybrid structure for the monitoring of optical fibers, using two types of
Photon Counting Optical Time Domain Reflectometers (ν-OTDR), is presented. While one ν-OTDR presents
a 32 dB dynamic range with spatial resolution of 6 m and minute-range measurements, the other has a 14 dB
dynamic range and a resolution of 3 cm with hour-range measurements. By employing a trend filter capable
of detecting fiber faults in the ν-OTDR fiber profile and interchanging between either OTDR techniques in an
automatic fashion, we were able to harness the qualities of both in the minimum amount of measurement time.
Our experimental results performed with multiple optical fiber links attest the structure’s capability of auto-
matically detecting faults in an optical fiber link with ultra-high-resolution and minute-range measurements.
Furthermore, tunability of the hybrid structure enabling the monitoring of wavelength-division multiplexed
optical networks has been demonstrated.
1 INTRODUCTION
Optical fibers have many advantages over other
transmission methods (cables, satellites, etc.), which
amounts to its immunity to electrical or magnetic in-
terference, its weight in relation to metallic cables,
and its low manufacturing cost. Although optical
fibers are rather reliable, they can sometimes be dam-
aged. The causes are the most varied: in the ocean,
for example, ships can break optical fibers, and even
sharks and other marine animals can chew the fiber
protective coating. On land, optical fibers are used
following physical infrastructures such as highways,
railroads and electric power transmission lines and
can be broken due to works, storms or accidents. In
general, mechanical stress is highly prejudicial and
should be avoided.
Fiber monitoring is essential to enable long-
distance optical telecommunications links since the
high data rates can be jeopardized due to the afore-
mentioned mechanical hazards that they might be ex-
posed to. In addition, the supervision of the phys-
ical layer of the network is fundamental because
a break can cause the suspension of essential ser-
vices, such as bank, telephone or internet services
links. One way of discovering where a failure oc-
curred in communications systems using fiber optics
is to use a Rayleigh scatter-based monitoring system.
There are some types of techniques that make use of
this phenomenon, but what stands out most certainly
is the Optical Time Domain Reflectometer (OTDR)
(Barnoski et al., 1977). Through the use of an OTDR
it is possible to extract information about the fiber’s
integrity by accessing only one end of the fiber, i.e., a
central transmission station can monitor all the fibers
connected to it without the need to install an apparatus
for monitoring at each of the multiple nodes of the op-
tical network. A good quality OTDR offers both good
spatial resolution (less than 20 meters) and long range
(greater than 200 kilometers) (Zhao et al., 2015).
The OTDR operates as follows: pulses of light,
which are emitted periodically, are coupled to the
test fiber through a circulator; the light pulses enter
through port 1 of the circulator and exit through port
2 which is connected to the optical fiber under test;
as these pulses propagate within the fiber a portion
of the light is back-reflected due to Rayleigh scatter-
ing and Fresnel reflection; the backscattered light en-
ters through port 2 of the circulator and is directed
to port 3, which is connected to a photodetector; the
electrical signal generated by the detector is sent to a
microprocessor which calculates the round trip time,
82
Calliari, F., Herrera, L., Weid, J. and Amaral, G.
High-Dynamic and High-resolution Automatic Photon Counting OTDR for Optical Fiber Network Monitoring.
DOI: 10.5220/0006643900820090
In Proceedings of the 6th International Conference on Photonics, Optics and Laser Technology (PHOTOPTICS 2018), pages 82-90
ISBN: 978-989-758-286-8
Copyright © 2018 by SCITEPRESS – Science and Technology Publications, Lda. All rights reserved

associates the backscattered power to a position in the
fiber and produces an OTDR trace otherwise known
as the fiber profile.
One of the most important parameters of an
OTDR is the dynamic range, which is expressed in
dB, and refers to the maximum length of an optical
link that can be measured; it can also be understood
as the maximum attenuation that can be measured in
a optical fiber link. Another important parameter is
the spatial resolution of the OTDR, which reflects the
sensitivity to resolve two adjacent events. The spatial
resolution depends mainly on the light pulse width en-
tering the fiber. The greatest compromise relationship
in OTDRs is between the dynamic range and spatial
resolution since, in order to achieve higher resolution,
narrow pulses are required, but, on ther other hand,
the narrower the pulse, the less energy it will carry
which results in a lower dynamic range (Agrawal,
1997).
1.1 Photon Counting OTDR
With the advent of the Geiger-mode Single Pho-
ton Detector (SPD) in the telecommunication wave-
length, the Photon-Counting OTDR (ν-OTDR) was
proposed. Such devices offer higher sensitivity due
to extremely low power detection in the single-photon
regime (Eraerds et al., 2010). Operating in the gated
mode, such SPDs can attain high photon detection ef-
ficiencies and extremely low dark count rates (Eraerds
et al., 2010). The gated operation requires, however,
an intelligent management system to reduce monitor-
ing periods and enhance the acquisition of statistically
relevant data (Amaral et al., 2015).
The ν-OTDR can offer some advantages when
compared to a conventional state-of-the-art OTDR,
some of which include: higher spatial resolution, bet-
ter dynamic range, better 2-point resolution, lower
timing jitter and superior behavior concerning after-
pulsing (Eraerds et al., 2010; Amaral, 2014). Of
course, there are disadvantages too, some of which
are: dead zones after large loss events (charge per-
sistence effect); and trace speed, depending on the
application (Herrera, 2015). Recently, a tunable ν-
OTDR with 6 meters spatial resolution and 32 dB
dynamic range has been proposed in a WDM-PON
context (Amaral et al., 2014), herewith dubbed the
High-Dynamic ν-OTDR, or HD-ν-OTDR. In (Her-
rera et al., 2015), the ν-OTDR is employed in a setup
for ultra-high resolution measurements up to 3 cen-
timeters with a 14 dB dynamic range, the Ultra-High
Resolution ν-OTDR, or UHR-ν-OTDR.
2 MEASUREMENT
ARRANGEMENT
In this work, the compromise relationship between
dynamic range and spatial resolution has been tack-
led and a proposal for reducing the gap between the
aforementioned prominent ν-OTDR techniques has
been reached. The herewith described monitoring
structure aims to unite the high dynamic range of the
HD-ν-OTDR to the high resolution provided by the
UHR-ν-OTDR with the objective of accurately and
quickly finding faults in an optical fiber link. More
importantly, the monitoring structure is fully auto-
matic since an algorithm tailored for the application
of finding faults in a fiber profile has been included.
The chart shown in Fig. 1 shows the steps taken by
the system to inspect a fiber optical link.
Figure 1: Flowchart of the Hybrid and Automatic ν-OTDR.
First, the system uses the HD-ν-OTDR to obtain
a fiber profile whose resolution is ∼ 6 m. Despite the
limited resolution, the acquisition rate is quite high
in a 20 km link, for example, the system allows the
determination of the last point of the profile with a
signal-to-noise ratio of 10 dB in just under two min-
utes (Amaral, 2014). Then the trend filter estimates
the positions that may present faults and sends them
as events list to the HR-ν-OTDR. The signal process-
ing step is also quite accelerated, with extremely ac-
curate results in just under a minute (Amaral et al.,
2015). The HR-ν-OTDR, in turn, analyzes only the
regions around the points of interest. Although the
acquisition is time-consuming, the extremely signifi-
cant reduction of the total fiber length to be inspected
enables the results to be acquired with palatable times,
in the order of minutes.
It is interesting, at this point, to explain the archi-
tectures of the different ν-OTDRs separately. How-
ever, in Fig. 2, the complete architecture of the pro-
posal is presented. It should be noted that all com-
ponents that originally belong to the HD-ν-OTDR ar-
chitecture are above the SPD’s line and, conversely,
the components below the SPD’s line are part of the
HR-ν-OTDR architecture. In this architecture, all the
devices that can be employed in both architectures are
shared so that it is not only simplified but, also, occu-
High-Dynamic and High-resolution Automatic Photon Counting OTDR for Optical Fiber Network Monitoring
83

pies less physical space.
In Fig. 2, the first Semiconductor Optical Am-
plifier (SOA), right after the Tunable Laser Source
(TLS), boosts the optical signal inside a narrow win-
dow of 60 ns with a 2 A peak current driver creating
high power narrow light pulses. The second SOA is
driven by a 600 mA current pulse with 60 ns width.
Even though the driving pulse is not enough to reach
full power operation of the second SOA alone, the
first boost guarantees optimal power usage while the
second acted as a gainless optical switch, shaping the
width of the optical pulse down to 60 ns. The tandem
configuration of the SOAs guarantees a high extinc-
tion rate, contributing to the overall dynamic range of
the detections. An FPGA is responsible for trigger-
ing a digital delay generator (DDG) which, in turn,
triggers both of the SOA’s drivers. The FPGA is
also responsible for creating the gate pulses for the
SPD; each detection is stored with its respective tim-
ing stamp and the data is transmitted through an USB
cable from the FPGA to a computer. Wavelength tun-
ability, in this setup, is guaranteed by the TLS.
In order to maximize the number of detections and
reduce the acquisition time, a train of gates, spaced
apart by the dead time of the SPD, is created (Weg-
muller et al., 2004; Amaral, 2014). With every new
light pulse that is sent into the optical fiber, a delay
is added to the train of gates to ensure that the entire
fiber is analyzed. The FPGA board is responsible for
managing the train of gates and the delays between
pulses as well as enabling the light pulses through the
SOA’s driver. This process is graphically detailed in
Fig. 3 (Amaral et al., 2015). Each detection is as-
sociated with a 16 bit word – the time stamp – com-
posed by r and s, the Gate and Pulse number, respec-
tively. The parameters a, b and c represent the gate
window, the dead time and the maximum delay be-
tween pulses.
Back to Fig. 2, we find, below the SPD line,
the architecture of the UHR-ν-OTDR. The 115 fs
wide pulses from an Ultra Wideband Laser Source
(UWS) passes through a narrow bandpass filter and
are then amplified by an Erbium Doped Fibre Am-
plifier (EDFA). The bandpass filter ensures that the
EDFA will amplify only the selected wavelength and
thus not wasting optical power. The tunability is guar-
anteed by the Tunable Filter which exhibits an ultra-
sharp roll-off ideal for Dense WDM (DWDM) moni-
toring. The pulses are, then, directed to an SOA which
works as fast optical switch, reducing the pulse repe-
tition rate and satisfy the condition of one light pulse
traversing the fiber at a time. The enabling pulses of
the SOA are generated by a DDG, which is triggered
by the synchronizing signal from the UWS. These en-
abling pulses are reshaped by the SOA driver which
is capable of driving the SOA with 4 ns-wide 600 mA
pulses.
Since the light pulse passing through the SOA is
115 fs wide which is much narrower than 4 ns, the
transmitted light pulse degrades due to the presence
of amplified spontaneous emission (ASE) generated
by the SOA. However, the corresponding ASE power
is approximately 10 dB below the pulse peak and has
little effect on the achievable spatial resolution of the
technique (Herrera et al., 2016). The DDG also trig-
gers the SPD with varying delays such as to cover
the whole fiber length. Detections are processed by
a Time-to-Digital Converter and sent to a computer.
A Variable Optical Attenuator (VOA) at the SPAD’s
input guarantees that the power does not exceed the
saturation limit so the detector is kept at linear regime
(Eraerds et al., 2010). Wavelength tunability, in this
setup, is achieved by the use of a narrow bandpass
filter at the source’s output (BPF).
It is evident from the schematic of Fig. 2 that the
management system is essential for the architecture
operation. It is responsible for interfacing with both
ν-OTDRs and to processes the respective fiber pro-
files with the fault finding algorithm. It is also re-
sponsible for switching between the operation modes,
which is accomplished by actuating upon the Optical
and Radio-Frequency switches – OS and RFS in Fig.
2. The OS is responsible for injecting either the HD-
ν-OTDR or the UHR-ν-OTDR pulse into the fiber
while the RFS is responsible for directing the correct
gate pulse to the SPD as they differ from one mode to
the other (Amaral et al., 2015; Herrera et al., 2016).
3 RESULTS - LONG-DISTANCE
FIBER LINK
A 36 km long fiber link composed of three almost
identical fibers with 12 km each was used to gener-
ate the OTDR trace and the filtered signature shown
in Fig. 4. The trend filter of choice for this work is the
Adaptive `
1
Filter, presented in (von der Weid et al.,
2016), which has been shown to outperform several
other signal processing techniques that focus on the
identification of trends in data series. Depending on
the size of the data series, the processing time can take
from a few minutes to a few hours, which would be
the case for a 36000 points data series. With the 6 me-
ters bin, which corresponds to the spatial resolution of
the HR-ν-OTDR, the approximately 36km fiber pro-
file is represented by a ∼ 6000 points data series, so
the Adaptive `
1
Filter takes about two minutes to pro-
cess the profile.
PHOTOPTICS 2018 - 6th International Conference on Photonics, Optics and Laser Technology
84
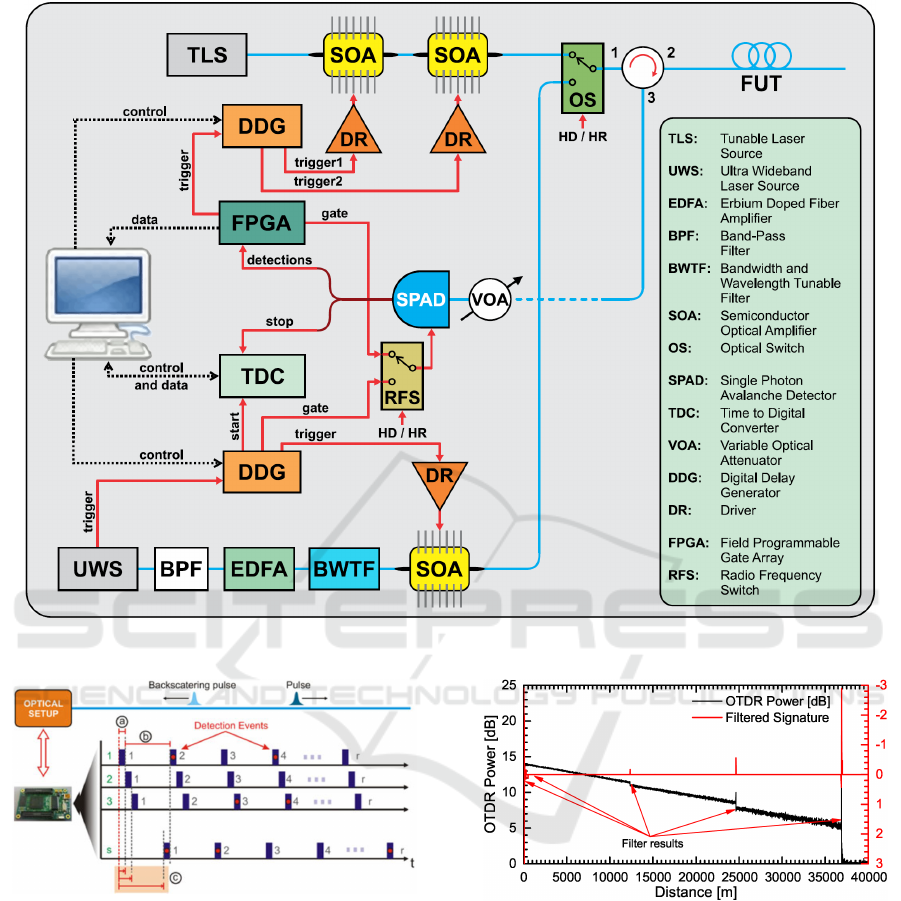
Figure 2: Architecture of the Hybrid and Automatic ν-OTDR for fast and accurate fault finding in optical fiber links.
Figure 3: Graphical representation of the higher data ac-
quisition method using the time-shifted train of gates in a
single optical pulse (Amaral et al., 2015).
The output from the Adaptive `
1
Filter is a list
of events containing the location of candidates for
fiber faults. The results were as follows: 0, 1011 ± 6,
12303 ± 6, 24603 ± 6 and 36830 ± 6 meters. It is ev-
ident that the beginning of the fiber is the first value
of the list, which is neglected. It is noteworthy that
the filter always selects the first positions, so it can be
consistently neglected and is not an ad hoc procedure.
The second value corresponds to a spurious detection
and the rest corresponds to connectors and the fiber
end.
Figure 4: HD-ν-OTDR trace and the filtered signature of
the ∼ 36km fiber link.
According to the chart presented in Fig. 1, this
list of events will be scrutinized with extreme reso-
lution by the UHR-ν-OTDR; its role is both to deter-
mine whether the points correspond to actual faults
and, in case it is indeed a fault, determine its position
with higher resolution. The UHR-ν-OTDR is fed with
the fault candidates positions and, also, with a spatial
window (arbitrarily set as ±100 meters) within which
to search. The results of the UHR-ν-OTDR are shown
in Figs. 5, 6, and 7.
Figs. 5 to 7 present the UHR-ν-OTDR monitoring
results for the three actual faults in the link. It also
High-Dynamic and High-resolution Automatic Photon Counting OTDR for Optical Fiber Network Monitoring
85
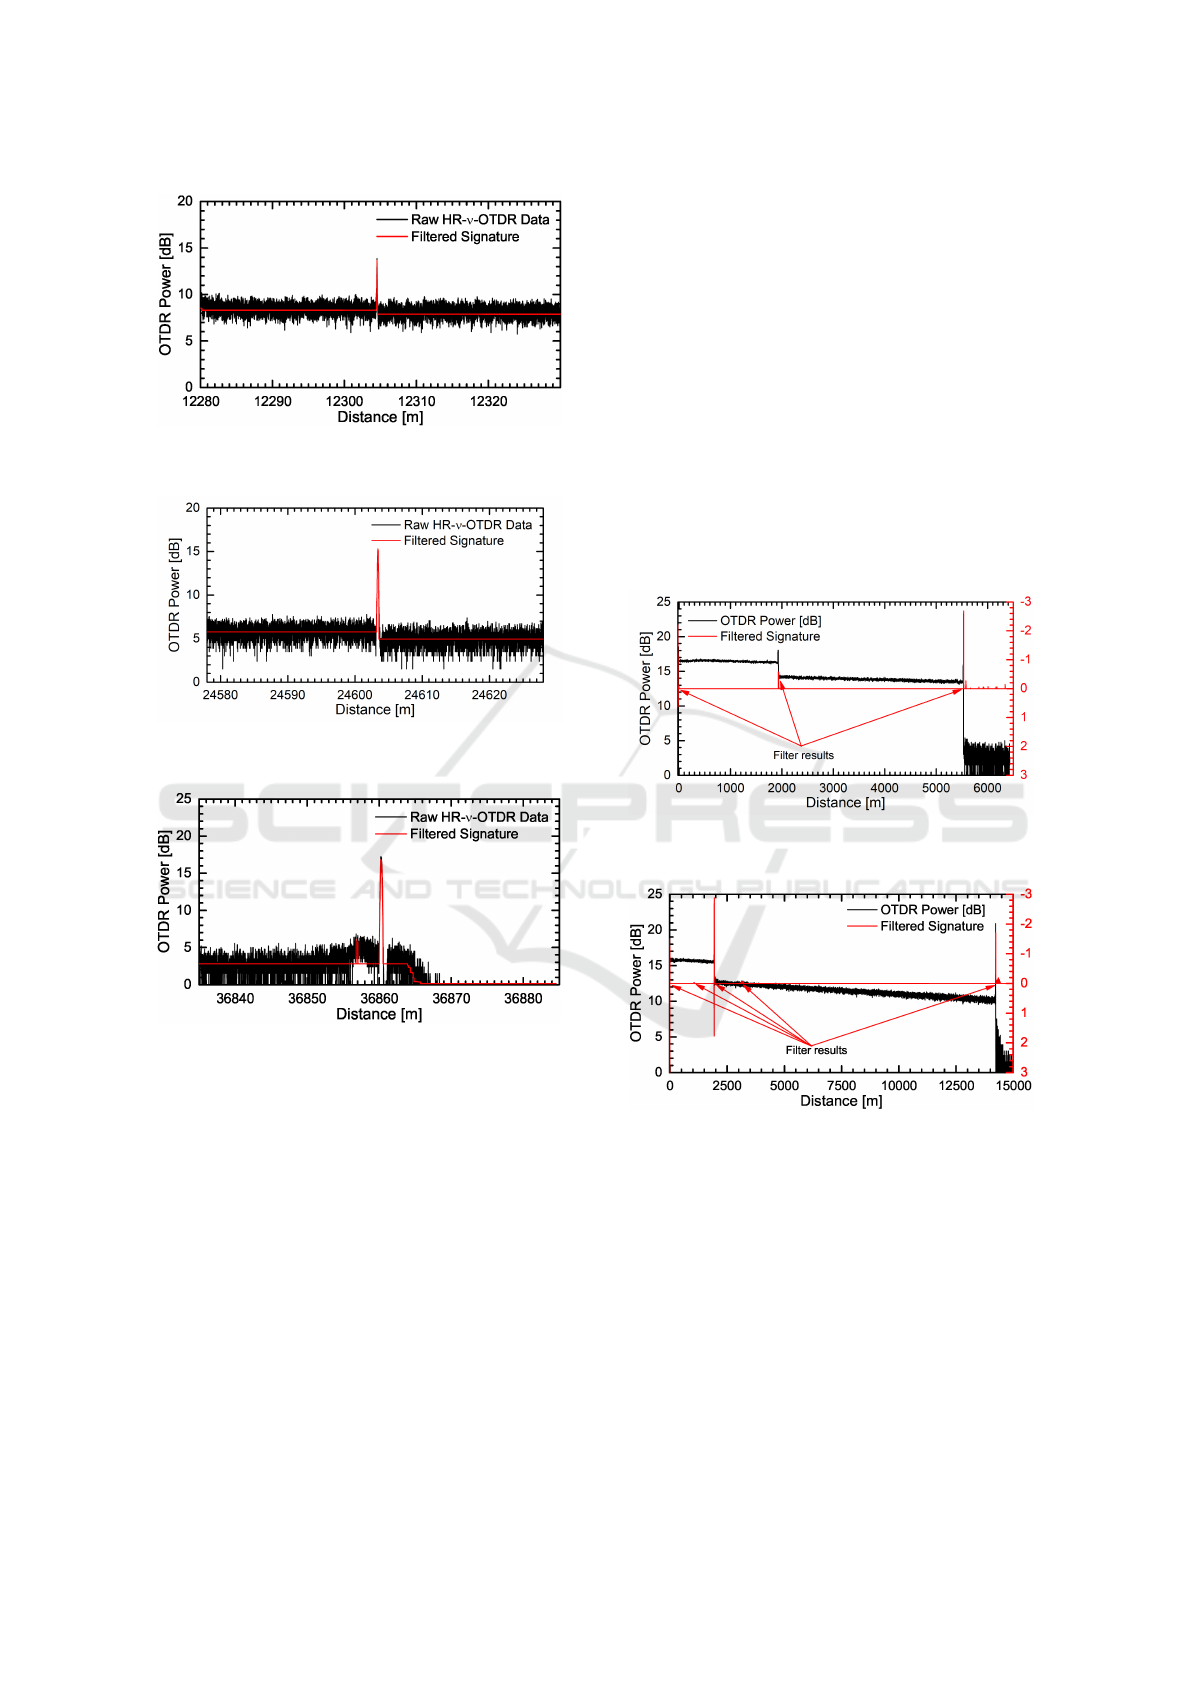
Figure 5: High-resolution measurement around 12303 ± 6
meters.
Figure 6: High-resolution measurement around 24603 ± 6
meters.
Figure 7: High-resolution measurement around 36830 ± 6
meters.
presents the detailed detection of the Adaptive `
1
Fil-
ter, closing the last step of the chart presented in Fig.
1. The result of the 1011 ± 6 meters spurious detec-
tion is not presented, for simplicity. However, as ex-
pected, the Adaptive `
1
Filter did not detect any trend
break, which is interpreted as the absence of fault.
Overall, the whole procedure of determining, with
precisions of up to 3cm, the fault positions of a 36km
fiber has taken approximately 18 minutes where: 150
seconds correspond to the acquisition of the first pro-
file with the HD-ν-OTDR; 150 seconds correspond
to the processing step of the Adaptive `
1
Filter that
identifies potential fault candidates; 600 seconds cor-
respond to the UHR-ν-OTDR measurements where
each 200 meter stretch take one fourth of the whole
time; and the final 300 seconds correspond to the time
the Adaptive `
1
Filter takes to process all of the high-
resolution measurements, one fourth of the time per
stretch.
4 RESULTS - MEDIUM-RANGE
DWDM LINK
In order to evaluate the possibility of inspecting a
wavelength-multiplexed link, link 2 was assembled
containing a ∼2 km feeder fiber and two wavelength-
dedicated fibers of ∼3.6 km and ∼12 km connected
by a passive wavelength division multiplexer (WDM)
at channels 37 and 40 of the DWDM grid. The results
of the HD-ν-OTDR are presented in Figs. 8 and 9.
Figure 8: HD-ν-OTDR trace and the filtered signature of the
∼ 2 + 3.6km fiber link at channel 37 of the DWDM grid.
Figure 9: HD-ν-OTDR trace and the filtered signature of
the ∼ 2 + 12km fiber link at channel 40 of the DWDM grid.
Since both HD-ν-OTDR measurements (for chan-
nels 37 and 40) discovered a fault candidate at the
same position (around 1948 ± 6 meters), we show,
in Fig. 10, the high-resolution measurement result
which is common for both measurements. Once
again, we do not present the high-resolution measure-
ment results for the spurious detections since, as ex-
pected, these have been discarded as fault positions
after scrutiny of the UHR-ν-OTDR.
Apart from the WDM that connects the feeder
fiber to the user fiber, no other faults were present at
the measured links apart from the fiber ends. These
PHOTOPTICS 2018 - 6th International Conference on Photonics, Optics and Laser Technology
86
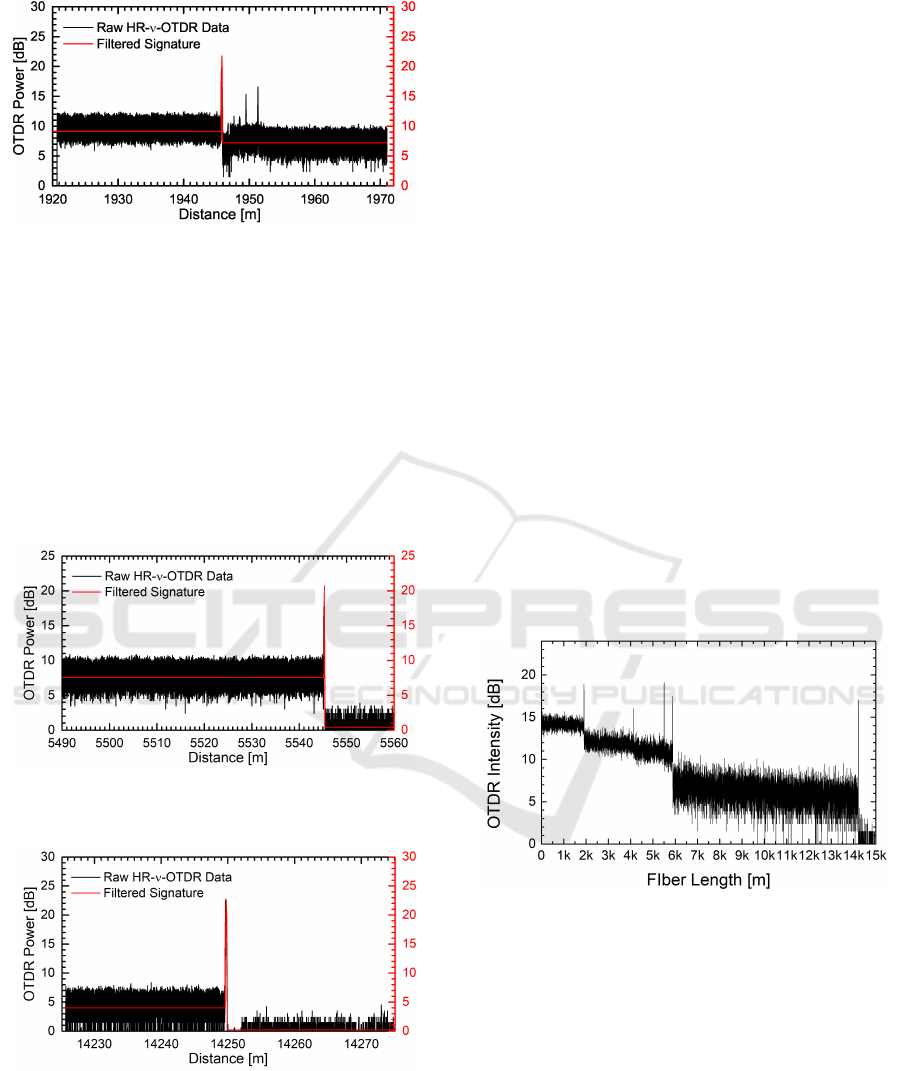
Figure 10: High-resolution measurement around 1945 ± 6
meters.
are presented in Fig. 11 and 12. The overall timing
taken by the monitoring structure to return the high-
resolution results for both links was approximately 25
minutes. It is clear that, even though the structure
is robust against spurious detections in the first step,
the impact is negative in the total timing. That is, of
course, because each extra candidate scrutinized by
the UHR-ν-OTDR translates into at least 3 extra min-
utes distributed between the data acquisition and the
signal processing steps.
Figure 11: High-resolution measurement around 5525 ± 6
meters.
Figure 12: High-resolution measurement around 14250 ± 6
meters.
5 TUNABILITY, COHERENCE,
CHROMATIC DISPERSION
AND SPATIAL RESOLUTION
A tunable OTDR measurement compatible with
WDM networks (as specified in ITUT G.694.1) must
not only be capable of selecting the center wavelength
of emission but also the spectral width of the opti-
cal signal. The current Dense WDM (DWDM) chan-
nels are either 0.8 nm wide comporting 40 channels
or 0.4 nm wide comporting 80 channels, but devices
that can operate with 0.2 nm wide channels (the so-
called Ultra-Dense WDM) have already been pro-
posed (Shahpari et al., 2015). The increasing num-
ber of channels will enable higher user capacity and
more flexibility of the interconnections at the expense
of reduced bandwidth per channel.
Compatibility between the probing pulse spectral
shape and the network to be monitored becomes clear
by the result of Fig. 13. In it, a broadband source was
used to probe a WDM network composed by a feeder
fiber, a WDM splitter and four user fibers. Since the
source does not provide wavelength selectivity, the
backscattered power from all the channels are over-
lapped and cannot be distinguished in the resulting
profile except by the end-fiber reflection peak.
Figure 13: OTDR trace of a WDM network using the HD-ν-
OTDR and a broadband light source. The overlapped profile
does not allow for the distinction between each user fiber.
In Fig. 14, on the other hand, the profiles were ac-
quired employing a spectrally-tailored optical source
in order to meet the WDM channel’s characteristics
so that each individual user fiber could be probed in-
dividually. Evidently, more time needs to be spent
in these measurements since each user fiber has to be
monitored individually.
Recall that the pulse generated by the UWS for
high-resolution inspection has an extremely broad
spectrum and must be spectrally-tailored in order to
fit the requirements of the WDM network it is applied
to – see Section 2. At this point, two distinct effects
High-Dynamic and High-resolution Automatic Photon Counting OTDR for Optical Fiber Network Monitoring
87
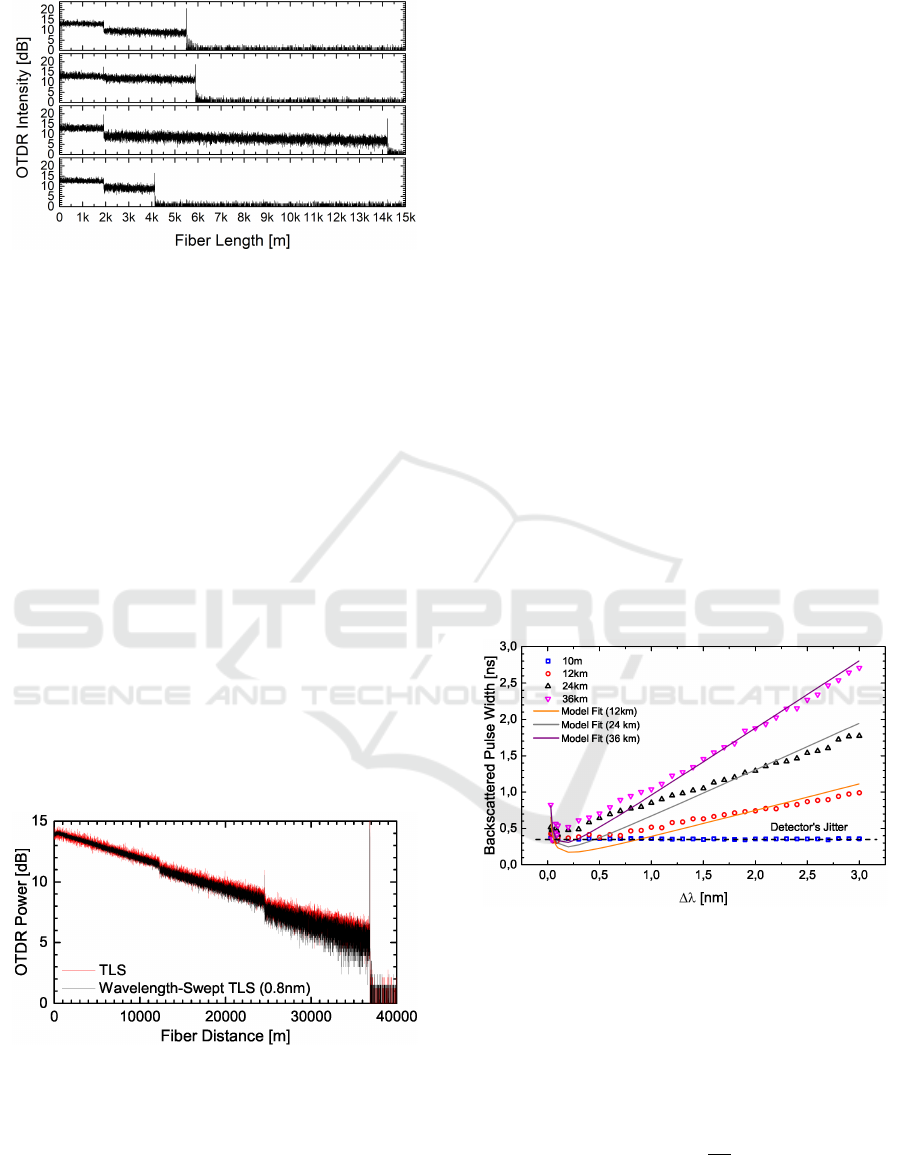
Figure 14: Individual OTDR traces using the HD-ν-OTDR
for each of the user fibers. By spectrally-tailoring the opti-
cal signal, each user fiber can be individually addressed due
to wavelength selectivity characteristics of WDM devices.
are in contrast: the coherent Rayleigh noise (CRN),
which grows inversely proportional to the spectral
width (De Souza, 2006); and the chromatic disper-
sion, which grows proportionally to the spectral width
(Herrera et al., 2015). The CRN are the fluctuations in
backscatter intensity due to the interference caused by
the superposition of several light waves arriving at the
detector with random phases (Shimizu et al., 1992).
Although the CRN arises due to the random dis-
tribution of the incoming wave phases, it cannot be
averaged out with long-time measurements such as
the counting noise (von der Weid et al., 2016). In
order to illustrate the effect of the CRN on OTDR
measurements, Fig. 15 presents two OTDR profiles
of the same fiber – but using probe pulses with dif-
ferent line-widths: 600 kHz, the intrinsic linewidth
of a tunable coherent laser; and 100GHz, a probe
pulse spectrally-tairoled to match the 0.8 nm channel
of DWDM-PONs (Caballero et al., 2013).
Figure 15: OTDR traces using the HD-ν-OTDR with two
different spectral widths. The red trace, which has a much
higher noise, was taken using a coherent laser with 600 kHz
linewidth. The black trace was taken by employing a wave-
length sweeping technique that mimics a broader linewidth
(Caballero et al., 2013); for this, the same TLS was swept
from 1554.13 to 1554.93 nm.
It becomes clear, thus, that, in order to avoid the
presence of CRN in the OTDR profile, the probe pulse
should be as spectrally broad as possible; in the spe-
cific case of WDM-PONs, the broader linewidth is
the one that matches the whole channel bandwidth.
Broadening the linewidth of the laser, however, will
increase the time stretching of the optical pulse as it
traverses the fiber due to chromatic dispersion (El-
refaie et al., 1988). Also, since the original emit-
ted pulses are transform-limited, the spectral tailor-
ing will have a direct impact on the time broaden-
ing. This condition constitutes a compromise rela-
tionship: if the optical pulse is spectrally-tailored
to a narrow bandwidth, it will be enlarged in time
and render poor spatial resolution in both short- and
long-distance measurements; however, if the pulse is
spectrally-tailored to the broader possible bandwidth
value, the optical pulse will exhibit a good spatial
resolution for short-distance measurements and, due
to chromatic dispersion, a poor spatial resolution for
long-distance measurements. This compromise rela-
tionship is translated in Fig. 16, where the achievable
spatial resolution versus the bandwidth of the pulse
is plotted for different fiber lengths. It is worth not-
ing that, for each distance measurement, there is an
optimal bandwidth value that corresponds to the best
achievable spatial resolution. Also, detector’s jitter
may, sometimes, limit the spatial resolution instead of
either the chromatic dispersion or the spectral width.
Figure 16: The compromise relationship between the spatial
resolution and the spectral width for different fiber lengths.
As expected, for longer fibers, broader bandwidths have a
harsher impact on diminishing the achievable spatial reso-
lution. In a 10 meter fiber, chromatic dispersion has negli-
gible effect and the spatial resolution will be limited by the
detector’s jitter, as demonstrated by the blue dots.
The model used to fit the experimental data was
the following:
W
p
= ∆λ · a +
b
∆λ
, (1)
where a corresponds to 2 · fiber length · D and b cor-
responds to pulse width of the UWS-1000H at full
bandwidth, ie, b ≈ 20fs · 800 nm. Also, we have used
PHOTOPTICS 2018 - 6th International Conference on Photonics, Optics and Laser Technology
88

an approximation for the dispersion factor D and as-
sumed that it remained constant within ∆λ. From the
results, it is clear that slope for ∆λ ≥ 1 nm is well
fitted, but the experimental results below this value
show some inconsistencies with the fit. We conjec-
ture that this behaviour may arise from the fact that
the pulse peak power for reduced ∆λ is very low and
the measurement results may be distorted. The back-
reflected power also diminishes as the fiber length
grows, which is observed in a higher contrast between
experimental and fitted data for the longer fibers of
24.6 km and 32.8 km. The pulse width enlargement
for low values of ∆λ is due to the transform-limited
pulse, i.e., it is as short as its spectral bandwidth per-
mits.
6 CONCLUSIONS
An automatic, highly accurate, and fast optical fiber
link monitoring structure that aims to ally the best fea-
tures of two distinct and prominent monitoring struc-
tures, namely the High-Dynamic and Ultra-High-
Resolution Photon Counting OTDRs (Amaral et al.,
2015; Herrera et al., 2015), has been successfully
assembled. The fundamental constituent of the pro-
posed architecture is a fault finding algorithm capa-
ble of accurately identifying fault candidates in a fiber
profile. The employed algorithm enables the automa-
tion of the whole process so that an operator is no
longer necessary to inspect each fiber profile, i.e., the
results are output automatically. A video contain-
ing an experimental run of the method can be found
in (Optoelectronics Laboratory – F. Calliari, L. E. Y.
Herrera, J. P. von der Weid, and G. C. Amaral, ).
The presented technology has been experimen-
tally verified in long-range, mid-range, and wave-
length multiplexed optical fiber links. The process
involves four distinct steps: initially, a fast high-
dynamic measurement is performed with the HD-ν-
OTDR; next, the fiber profile is processed by the
Adaptive `
1
Filter and the fault candidates are iden-
tified; having the candidates list from the previous
step, a high-resolution measurement is performed in
the vicinity of the fault candidate position using the
UHR-ν-OTDR; finally, the results of the previous step
are also processed by the Adaptive `
1
Filter and the
actual fault positions are identified with extremely
high accuracy. Our results show that faults in links
as long as 36 km could be inspected with spatial res-
olutions of up to 3 cm in less than 15 minutes. This
work paves the way for low-cost, highly reliable, au-
tomatic, and fast monitoring of optical fiber links.
ACKNOWLEDGMENT
The authors would like to thank brazilian agencies
CNPq, Capes and FAPERJ for financial support.
REFERENCES
Agrawal, G. P. (1997). Fiber-Optic Communication Sys-
tems. John Wiley & Sons, Inc.
Amaral, G. C. (2014). FPGA Applications on Single Photon
Detection Systems. Master’s thesis, PUC-Rio.
Amaral, G. C., Garcia, J. D., Herrera, L. E., Temporao,
G. P., Urban, P. J., and von der Weid, J. P. (2015).
Automatic Fault Detection in WDM-PON with Tun-
able Photon Counting OTDR. Journal of Lightwave
Technology, 33(24):5025–5031.
Amaral, G. C., Herrera, L. E., Vitoreti, D., Temporão,
G. P., Urban, P. J., and der von Weid, J. P. (2014).
WDM-PON monitoring with tunable photon count-
ing OTDR. IEEE Photonics Technology Letters,
26(13):1279–1282.
Barnoski, M. K., Rourke, M. D., Jensen, S. M., and
Melville, R. T. (1977). Optical Time Domain Reflec-
tometer. Applied Optics, 16(9):2375–2379.
Caballero, D. V., von der Weid, J., and Urban, P. (2013).
Tuneable otdr measurements for wdm-pon moni-
toring. In Microwave & Optoelectronics Confer-
ence (IMOC), 2013 SBMO/IEEE MTT-S Interna-
tional, pages 1–5. IEEE.
De Souza, K. (2006). Significance of coherent rayleigh
noise in fibre-optic distributed temperature sensing
based on spontaneous brillouin scattering. Measure-
ment Science and Technology, 17(5):1065.
Elrefaie, A. F., Wagner, R. E., Atlas, D., and Daut, D.
(1988). Chromatic dispersion limitations in coherent
lightwave transmission systems. Journal of Lightwave
Technology, 6(5):704–709.
Eraerds, P., Legré, M., Zhang, J., Zbinden, H., and Gisin,
N. (2010). Photon Counting OTDR: Advantages
and Limitations. Journal of Lightwave Technology,
28(6):952–964.
Herrera, L., Amaral, G., and von der Weid, J. P. (2015).
Ultra-high-resolution tunable pc-otdr for pon moni-
toring in avionics. In Optical Fiber Communications
Conference and Exhibition (OFC), 2015, pages 1–3.
IEEE.
Herrera, L. E., Calliari, F., Garcia, J. D., do Amaral, G. C.,
and von der Weid, J. P. (2016). High Resolution Auto-
matic Fault Detection in a Fiber Optic Link via Photon
Counting OTDR. In Optical Fiber Communication
Conference, page M3F.4. Optical Society of America.
Herrera, L. E. Y. (2015). Reflectometria óptica de alta res-
olução por contagem de fótons. PhD thesis, PUC-Rio.
Optoelectronics Laboratory – F. Calliari, L. E. Y. Her-
rera, J. P. von der Weid, and G. C. Amaral. Higy-
dynamic and high-resolution automatic photon count-
ing otdr. https://www.youtube.com/watch?v=
KQn9Du2l4NQ&feature=youtu.be.
High-Dynamic and High-resolution Automatic Photon Counting OTDR for Optical Fiber Network Monitoring
89

Shahpari, A., Ferreira, R., Ribeiro, V., Sousa, A., Ziaie, S.,
Tavares, A., Vujicic, Z., Guiomar, F. P., Reis, J. D.,
Pinto, A. N., et al. (2015). Coherent ultra dense wave-
length division multiplexing passive optical networks.
Optical Fiber Technology, 26:100–107.
Shimizu, K., Horiguchi, T., and Koyamada, Y. (1992).
Characteristics and reduction of coherent fading noise
in rayleigh backscattering measurement for optical
fibers and components. Journal of Lightwave Tech-
nology, 10(7):982–987.
von der Weid, J. P., Souto, M. H., Garcia, J. D., and Amaral,
G. C. (2016). Adaptive filter for automatic identifica-
tion of multiple faults in a noisy otdr profile. Journal
of Lightwave Technology, 34(14):3418–3424.
Wegmuller, M., Scholder, F., and Gisin, N. (2004). Photon-
counting otdr for local birefringence and fault analysis
in the metro environment. Journal of lightwave tech-
nology, 22(2):390–400.
Zhao, Q., Xia, L., Wan, C., Hu, J., Jia, T., Gu, M., Zhang,
L., Kang, L., Chen, J., Zhang, X., et al. (2015).
Long-haul and high-resolution optical time domain
reflectometry using superconducting nanowire single-
photon detectors. Scientific reports, 5:10441.
PHOTOPTICS 2018 - 6th International Conference on Photonics, Optics and Laser Technology
90
