
Enhancement of Emotion Recogniton using Feature Fusion and the
Neighborhood Components Analysis
Hany Ferdinando
1,2
and Esko Alasaarela
1
1
Health and Wellness Measurement, OPEM unit, University of Oulu, Oulu, Finland
2
Department of Electrical Engineering, Petra Christian University, Surabaya, Indonesia
Keywords:
Emotion Recognition, Feature Fusion, NCA, ECG, EDA.
Abstract:
Feature fusion is a common approach to improve the accuracy of the system. Several attemps have been made
using this approach on the Mahnob-HCI database for affective recognition, achieving 76% and 68% for va-
lence and arousal respectively as the highest achievements. This study aimed to improve the baselines for both
valence and arousal using feature fusion of HRV-based, which used the standard Heart Rate Variability analy-
sis, standardized to mean/standard deviation and normalized to [-1,1], and cvxEDA-based feature, calculated
based on a convex optimization approach, to get the new baselines for this database. The selected features,
after applying the sequential forward floating search (SFFS), were enhanced by the Neighborhood Compo-
nent Analysis and fed to kNN classifier to solve 3-class classification problem, validated using leave-one-out
(LOO), leave-one-subject-out (LOSO), and 10-fold cross validation methods. The standardized HRV-based
features were not selected during the SFFS method, leaving feature fusion from normalized HRV-based and
cvxEDA-based features only. The results were compared to previous studies using both single- and multi-
modality. Applying the NCA enhanced the features such that the performances in valence set new baselines:
82.4% (LOO validation), 79.6% (10-fold cross validation), and 81.9% (LOSO validation), enhanced the best
achievement from both single- and multi-modality. For arousal, the performances were 78.3%, 78.7%, and
77.7% for LOO, LOSO, and 10-fold cross validations respectively. They outperformed the best achievement
using feature fusion but could not enhance the performance in single-modality study using cvxEDA-based
feature. Some future works include utilizing other feature extraction methods and using more sophisticated
classifier other than the simple kNN.
1 INTRODUCTION
Although the standard HRV analysis (Task Force
of the European Society of Cardiology the North
American Society of Pacing Electrophysiology, 1996)
was not suitable to ECG signals in the Mahnob-
HCI database for affect recognition (Soleymani et al.,
2012) due to signal length requirements, the Neigh-
borhood Components Analysis (NCA) (Goldberger
et al., 2005) could refine the quality of the features,
improving the accuracy from about 43% and 48%
to 69% and 71% for valence and arousal respectivey
to solve 3-class classification problem (Ferdinando
et al., 2017a). Further, (Ferdinando and Alasaarela,
2017) extracted features using the cvxEDA, a convex
optimization approach to analyze EDA signal, (Greco
et al., 2016) from Galvanic Skin Response (GSR)
or Electrodermal Activity (EDA) signals from this
database for valence and arousal recognition achiev-
ing accuracies up to 75% and 77% respectively.
Previously, others have already applied feature
fusion for emotion recognition using the Mahnob-
HCI database to solve 3-class problem in valence
and arousal. Soleymani et al. (Soleymani et al.,
2012) provided the baselines, i.e. 76% and 68% for
valence and arousal respectively by combining fea-
tures from EEG and eye gaze using SVM. Zhu et al.
(Zhu et al., 2014) fused EEG and audio/video sig-
nals and achieved up to 58% and 61% for valence
and arousal correspondingly using the same classi-
fier. Wiem and Lachiri (Wiem and Lachiri, 2017)
used features from ECG, Resp, Temp and GSR, and
SVM with various kernel, achieving 57% and 55%
for valence and arousal respectively. Using EEG and
serveral physiological signals, Shu and Wang (Shu
and Wang, 2017) achieved 59% for valence and 66%
for arousal on SVM. Overall, the best accuracies were
achieved by Soleymani et al. and this work served
Ferdinando, H. and Alasaarela, E.
Enhancement of Emotion Recogniton using Feature Fusion and the Neighborhood Components Analysis.
DOI: 10.5220/0006642904630469
In Proceedings of the 7th International Conference on Pattern Recognition Applications and Methods (ICPRAM 2018), pages 463-469
ISBN: 978-989-758-276-9
Copyright © 2018 by SCITEPRESS – Science and Technology Publications, Lda. All rights reserved
463
as references. Another reference was the highest ac-
curacy from single-modality achieved by Ferdinando
and Alasaarela (Ferdinando and Alasaarela, 2017).
Aiming to improve the baselines, we fused features
from the standard HRV analysis, analyzed using the
standard HRV analysis (Task Force of the European
Society of Cardiology the North American Society
of Pacing Electrophysiology, 1996) and the cvxEDA
(Greco et al., 2016), to develop a multi-modal affect
recognition. The new set of features was subject to
feature selection using the sequential forward floating
search (SFFS) method, followed by the NCA (Gold-
berger et al., 2005) to enhance the features quality.
The kNN classifier was used to solve 3-class
classification problem in valence and arousal, vali-
dated using leave-one-out (LOO), leave-one-subject-
out (LOSO), and 10-fold cross validations to accom-
modate validation from the previous studies. The best
result from each dimensionality was selected based
on significance test using t-test with 0.05 significance
level. The final result from each validation was the
best result with the lowest dimensionality, assessed
with algorithm proposed in (Ferdinando et al., 2017a)
and compared to the previous results.
2 MATERIAL AND METHODS
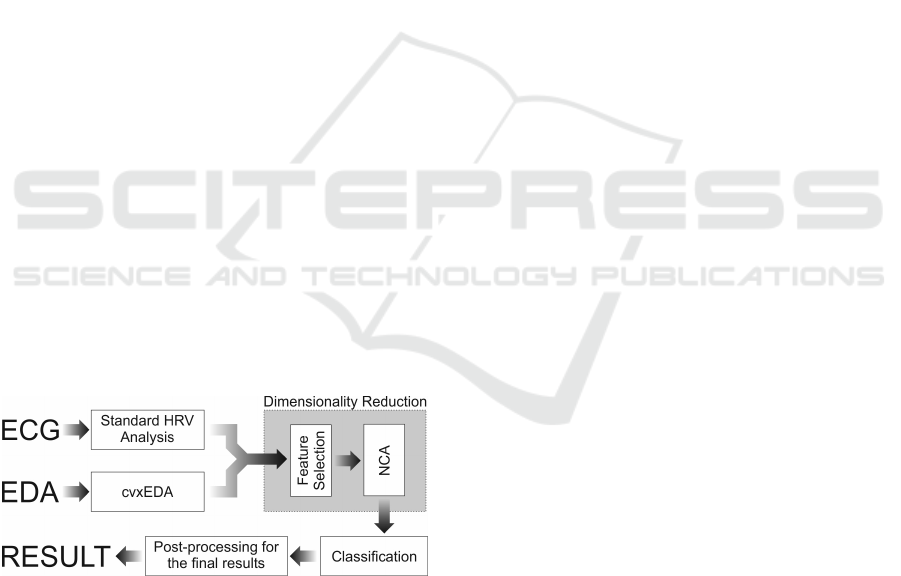
Figure 1 shows the block diagram of this study. There
were two dimensionality reduction processes applied
to the fused features. After the dimensionality reduc-
tion process, the features were fed to a classifier and
an algorithm was used to select the best result with
the lowest dimensionality.
Figure 1: Block diagram of this study.
2.1 Database
Both ECG and EDA signals used in this study were
from the Mahnob-HCI database for affect recogni-
tion. Recorded from 30 subjects stimulated by pic-
tures and videos, the Mahnob provides synchronized
measurement to enable multimodal affect recognition
study (Ferdinando et al., 2016). To be more specific,
the signals were downloaded from database server un-
der Selection of Emotion Elicitation, providing 513
samples from 26 subjects because samples from some
of the subject were corrupted.
2.2 Feature Extraction
During the experiments, there were 30 seconds before
and after the stimulated phase called relaxing phase
when the subjects were not emotionally stimulated.
A synchronization pulse was used to mark the begin-
ning and the end of stimulation phase. Features from
ECG signals were derived from ECG signal before
the stimulation, called baseline, and during the stim-
ulation, called response.
Feature indices from standard HRV analysis were
(Ferdinando et al., 2017a):
• RMS of the Successive Difference between adja-
cent R-R intervals (RMSSD).
• Standard Deviation of the Successive Difference
between adjacent R-R intervals (SDSD).
• Standard Deviation of all NN intervals (SDNN).
• Number of pairs of adjacent NN intervals differ-
ing by more than 50 ms (NN50).
• Number of pairs of adjacent NN intervals differ-
ing by more than 20 ms (NN20).
• NN50 count divided by the total number of NN
intervals (pNN50).
• NN20 count divided by the total number of NN
intervals (pNN20).
• Power spectral density for very low frequency
(VLF), low frequency (LF), high frequency (HF),
and total power.
• Ratio of HF to LF.
• Poincar analysis (SD1 and SD2).
• Ratio of response to baseline features.
The acquired features were standardized based on
mean and SD, and also normalized to [-1,1] to get
three sets of HRV-based features, i.e. standardized
features, normalized features, and joined standardized
and normalized features.
Features from EDA were extracted using a op-
timization approach, called cvxEDA (Greco et al.,
2016), which was applied to EDA from the Mah-
nob and provided good performance for both valence
and arousal (Ferdinando and Alasaarela, 2017). The
cvxEDA can be applied directly to raw signal and
splits it into phasic, tonic, and noise. Similar to ECG
signal, features from EDA were also calculated using
baseline and response point of view. Feature indices
from EDA were (Ferdinando and Alasaarela, 2017)
ICPRAM 2018 - 7th International Conference on Pattern Recognition Applications and Methods
464

• nSCR1, number of significant SCR within 5-
second non-overlap window, divided by number
of window.
• nSCR2 = number of significant SCR within 5 sec-
ond non-overlap window, divided by length of the
signal in seconds.
• nSCR3 = number of significant SCR divided by
length of the signal in seconds.
• Area under curve (AUC) of phasic and tonic sig-
nals.
• 14 items of statistical distribution: mean, standard
deviation, Q1, median, Q3, IQR, percentile 2.5,
percentile 10, percentile 90, percentile 97.5, max-
imum, skewness, and kurtosis.
• Power in 0-0.1 Hz, 0.1-0.2 Hz, 0.2-0.3 Hz, 0.3-0.4
Hz.
• Ratio of response to baseline features.
The three sets of HRV-based features were fused in-
dividually to cvxEDA-based feature, resulting three
sets of fused features for the next process.
2.3 Dimensionality Reduction
Prior to feeding the fused features to classifier, a se-
quential forward floating search (SFFS) method was
used to select a set of features having high discrimi-
nant values from the three sets of fused features utiliz-
ing kNN to evaluate its performance. Next, the Neigh-
borhood Components Analysis (NCA) (Goldberger
et al., 2005) was used to calculate a projection ma-
trix able to transform the selected features into certain
space such that the distances among features belong
to the same class were decreased while increasing dis-
tances among features belong to different classes. The
NCA calculation used the implementation in the dr-
toolbox written for Matlab
1
. The projection matrix
also reduced the dimensionality of the features in the
new space to [2,9] (Ferdinando and Alasaarela, 2017).
2.4 Classifier and Validation
We used the kNN classifier to compare our results
with the other previous studies appropriately and
validated using 10-fold cross, leave-one-out (LOO),
and leave-one-subject-out (LOSO) validation meth-
ods. For 10-fold cross validation, 20% of the samples
were held out for validation while the rest of the sam-
ples were subject to training and testing purpose with
1000 repetitions and new resampling for every repeti-
tion to get the average as close as possible to the true
value.
1
https://lvdmaaten.github.io/drtoolbox/
In the LOO validation, one sample is excluded to
validate the model built using the remaining samples.
This process continues to each sample and the average
is reported. Generally, the LOSO validation is similar
to the LOO but the excluded samples are from one of
the subjects.
2.5 Post-processing
The results were grouped according to the dimension-
ality. One result must be chosen to represent the re-
sults of that dimensionality. We used t-test with 0.05
significance level to assess if the differences among
the results within the same dimensionality was sig-
nificant or not. Later, an algorithm was used to select
the best result with the lowest dimensionality for each
validation (Ferdinando et al., 2017a):
1. Find the best accuracy (namely, A1).
2. If the best accuracy is occurred at the lowest di-
mensionality, then the best result is found (the best
result = A1).
3. Otherwise, find the second-best accuracy (namely,
A2) from the lower dimensionality and compare
A1 to A2 using t-test with significance level 0.05.
4. If the difference is statistically significant, then
the best results is found (the best result = A1).
5. If the difference is not statistically significant,
then the second-best turns to the best accuracy.
Repeat process from step 2 until it reaches the
lowest dimensionality.
3 RESULTS AND DISCUSSIONS
3.1 Fused Feature Evaluation
After applying the SFFS to fused features of stan-
dardized HRV-based, normalized HRV-based, and
cvxEDA-based features, it was found that none of
standardized HRV-based features were selected in
both valence and arousal. It seemed using ordinary
mean and standard deviation, instead of median and
median absolute deviation (MAD) or median and in-
terquartile range (IQR), were not suitable to the distri-
bution, so that the standardized features captured less
information about valence and arousal than the ones
from the others. Consequently, there were no experi-
ment from fused features of standardized HRV-based
and cvxEDA-based features. The SFFS reduced the
dimensionalities from 168 to 14 and from 168 to 11
for valence and arousal respectively.
Enhancement of Emotion Recogniton using Feature Fusion and the Neighborhood Components Analysis
465
3.2 Recognition Results
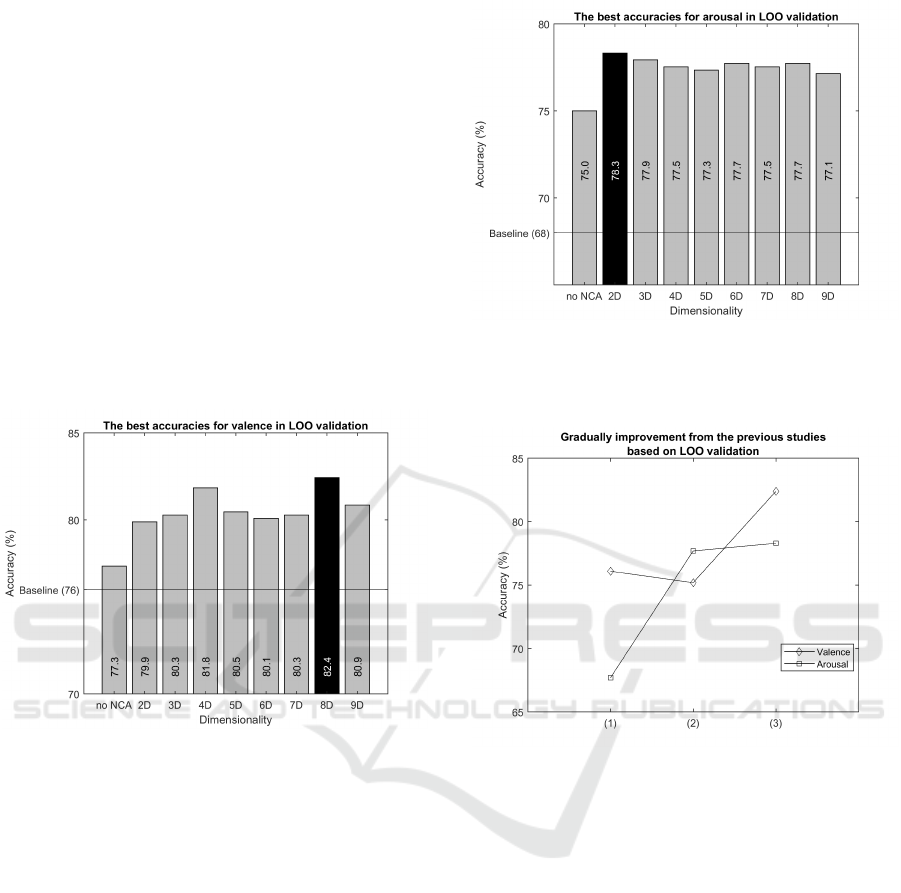
Figure 2 shows the valence accuracy based on LOO
validation of the fused features with and wihout ap-
plying the NCA, and also the baseline from (Soley-
mani et al., 2012). The proposed method offered bet-
ter accuracy than the baseline, even without apply-
ing the NCA. Applying the algorithm in (Ferdinando
et al., 2017a), the difference between 82.4% (8D) and
81.8% (4D) was evaluated using t-test at 0.05 signif-
icance level and found that 82.4% (8D) was the best
result with the lowest dimensionality. Similar phe-
nomenon occurred in arousal, see Figure 3, where
the performance without applying the NCA already
outperformed the baseline. Since the highest perfor-
mance was already in the lowest dimensionality, it be-
came the best result with the lowest dimensionality.
Figure 2: The best accuracy for valence with and without
involving the NCA using kNN classifier in LOO validation
and the baseline from (Ferdinando and Alasaarela, 2017)
showed that the NCA improved the accuracies of system.
Now, we compare these achievements to the some
previous studies. Table 1, visualized in Figure 4,
compare the current results to the original baseline
from the database (Soleymani et al., 2012) and the
same system using cvxEDA-based features only (Fer-
dinando and Alasaarela, 2017), which presented the
result based on LOO validation. For valence, our re-
sult outperformed the one from both previous studies.
For arousal, our result was slightly above the system
used cvxEDA-based features only (Ferdinando and
Alasaarela, 2017) but outperformed the one from the
database owner (Soleymani et al., 2012).
Figure 5 shows the accuracy for valence in 10-fold
cross validation and the baseline from (Ferdinando
and Alasaarela, 2017) because no previous studies
used 10-fold cross validation. Both implementation
with and without involving the NCA outperformed
the baseline significantly, confirmed using t-test at
0.05 significance level. Applying supervised dimen-
Figure 3: The best accuracy for arousal with and without
involving the NCA using kNN classifier in LOO validation
and the baseline from (Ferdinando and Alasaarela, 2017)
showed that the NCA improved the accuracies of system.
Figure 4: Visual representation of improvements for va-
lence and arousal from the previous studies based on LOO
validation (1): all peripheral physiological signals (Soley-
mani et al., 2012), (2): EEG+Gaze (Soleymani et al., 2012),
(3): EDA (Ferdinando and Alasaarela, 2017), (4): current
results.
sionality reduction to the fused features boosted the
accuracy but kept the standard deviation accuracy al-
most unchanged. On the other hand, the NCA failed
to boost all accuracies for arousal as only some of
them outperformed the baseline while the other were
below the baseline, see Figure 6. Using the algorithm
to select the best result with the lowest dimensional-
ity as proposed in (Ferdinando et al., 2017a), the best
performances were achieved at 79.6 ± 3.7 (8D) and
77.7 ± 3.8 (2D) for valence and arousal respectively.
Table 2, visualized in Figure 7, compared the cur-
rent results to the previous studies based on 10-fold
cross validation. As shown in the previous studies,
it was easier to recognize arousal than the other but
findings in this study presented the opposite. The ac-
curacies were also gradually improved significantly,
ICPRAM 2018 - 7th International Conference on Pattern Recognition Applications and Methods
466
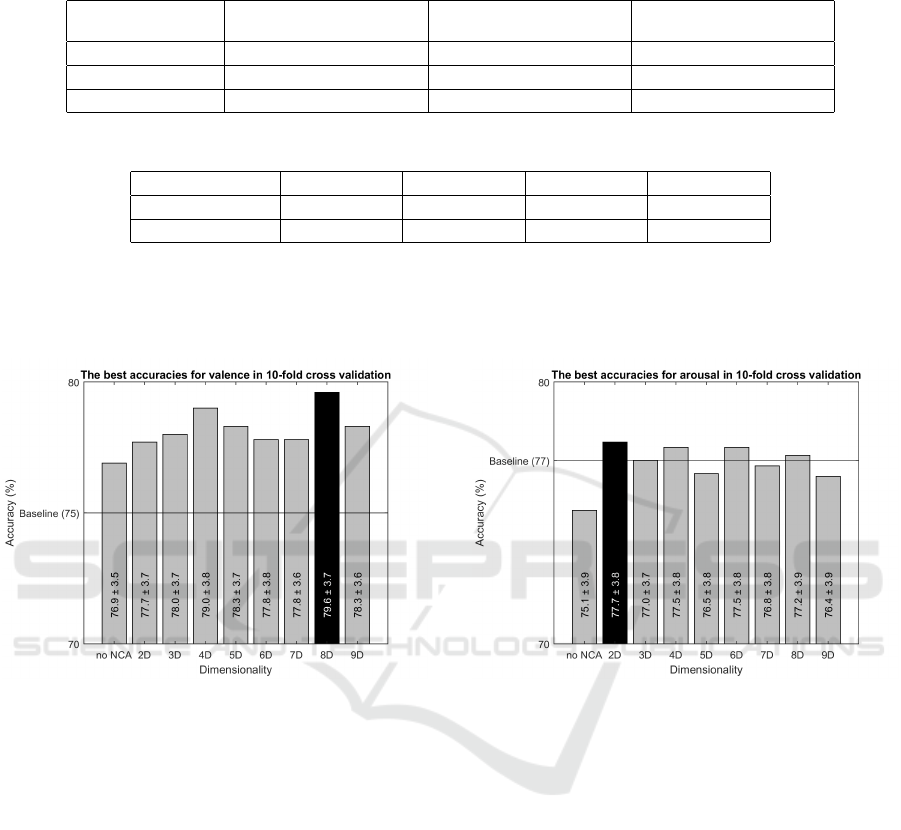
Table 1: Performance comparison to the original baseline from the owner of the database (Soleymani et al., 2012) and the
other previous study (Ferdinando and Alasaarela, 2017) in leave-one-out (LOO) validation.
(Soleymani et al.,
2012)
(Ferdinando and
Alasaarela, 2017)
Current Results
Input Signals
EEG+Gaze EDA
HRV+EDA
Valence 76.1 75.2 82.4
Arousal 67.7 77.7 78.3
Table 2: Compare the performance with the previous study for 10-fold cross validation.
Input Signals
ECG
1
ECG, HRV
2
EDA
3
HRV+EDA
4
Valence 64.1 ± 7.4 68.6 ± 4.4 74.6 ± 3.8 79.6 ± 3.7
Arousal 66.1 ± 7.4 70.7 ± 4.3 77.3 ± 3.6 77.7 ± 3.9
1
Results from (Ferdinando et al., 2017b)
2
Results from (Ferdinando et al., 2017a)
3
Results from (Ferdinando and Alasaarela, 2017)
4
Results from proposed method
Figure 5: The best accuracy for valence with and without
involving the NCA using kNN classifier in 10-fold cross
validation after 1000 iterations and the baseline from (Fer-
dinando and Alasaarela, 2017) showed that the NCA en-
hanced the accuracies very well.
except for arousal, see Figure 7. It indicated the
NCA could not improve the accruacy anymore. To
get better accuracy, another feature extraction method
is needed or other modalities are used. The fused fea-
tures also kept the standard deviation unchanged, in-
dicating the same consistency among the repetitions.
The results based on the LOSO validation for both
valence and arousal are displayed in Figure 8 and 9 re-
spectively. The results in Figure 8 presented the same
facts as in Figure 4, where all of them outperformed
the baseline. What stands out from Figure 8 was the
best result with the lowest dimensionality was repre-
sented by 4D instead of 8D, although the later has
higher performance. Significance test between 82.7 ±
8.5 (8D) and 81.9 ± 8.8 (4D) resulted no significance
difference, bringing consequence that 81.9 ± 8.8 (4D)
was chosen. It was interesting to note here that the di-
Figure 6: The best accuracy for arousal with and without
involving the NCA using kNN classifier in 10-fold cross
validation after 1000 iterations and the baseline from (Fer-
dinando and Alasaarela, 2017) showed that the NCA did not
enhanced all accuracies, see 3D, 5D, 7D, and 9D.
mensionalities, which outperformed the baseline for
arousal were exactly the same as in the other valida-
tion method, compare Figure 6 and 9.
Table 3, visualized in Figure 10, revealed several
interesting results. Firstly, the NCA could improve
the quality of the fused features and boost the accu-
racy for valence to 82%. Unfortunately, there was
no significant improvement from (Ferdinando and
Alasaarela, 2017) for arousal. Applying the NCA to
the fused features failed to improve the performance.
Secondly, the standard deviation of the current re-
sults were close to (Ferdinando and Alasaarela, 2017),
which used cvxEDA-based feature only.
Enhancement of Emotion Recogniton using Feature Fusion and the Neighborhood Components Analysis
467
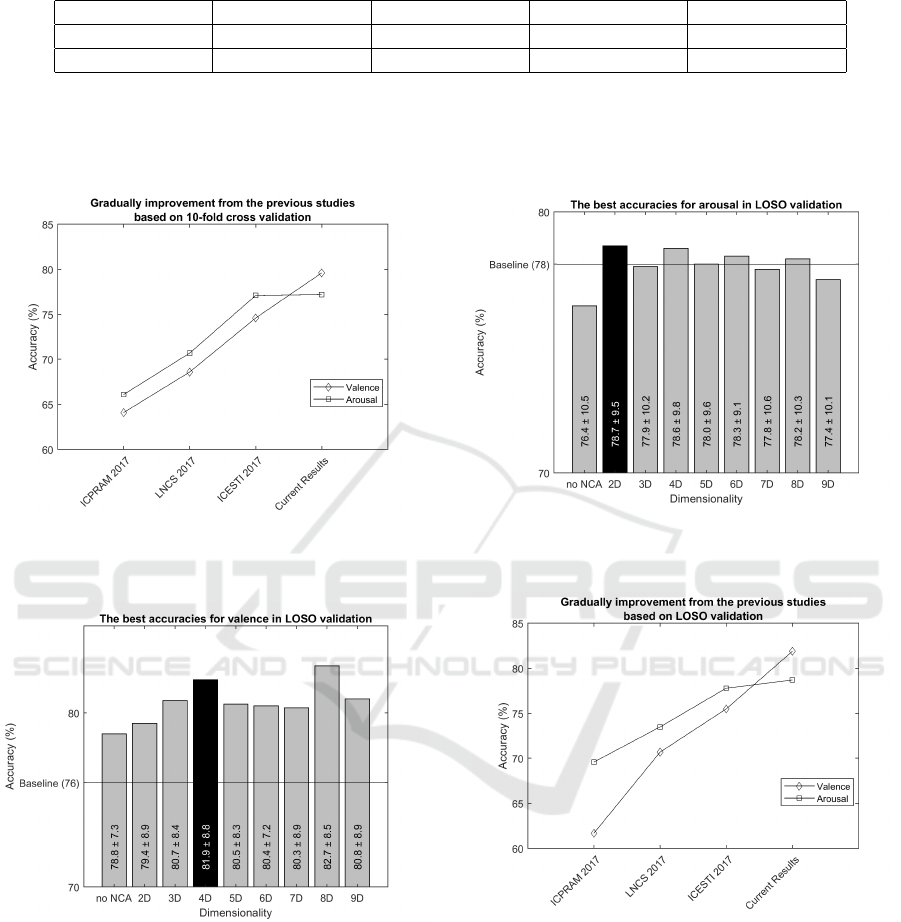
Table 3: Compare the performance with the previous study for LOSO validation.
Input Signals
ECG
1
ECG, HRV
2
EDA
3
HRV+EDA
4
Valence 61.7 ± 14.1 70.7 ± 4.9 75.5 ± 7.7 81.9 ± 8.8
Arousal 69.6 ± 12.4 73.5 ± 4.4 77.8 ± 8.0 78.7 ± 9.5
1
Results from (Ferdinando et al., 2017b)
2
Results from (Ferdinando et al., 2017a)
3
Results from (Ferdinando and Alasaarela, 2017)
4
Results from proposed method
Figure 7: Visual representation of improvements for va-
lence and arousal from the previous studies based on 10-
fold cross validation.
Figure 8: The best accuracy for valence with and without in-
volving the NCA using kNN classifier in LOSO validation
and the baseline from (Ferdinando and Alasaarela, 2017).
Although 82.7 ± 8.5 (8D) was higher than 81.9 ± 8.8 (4D),
the later was selected as the best result with the lowest
dimensionality through the proposed algorithm in [LNCS
2017].
4 CONCLUSIONS
Performances of affect recognition using feature fu-
sion of HRV-based and cvxEDA-based features in-
Figure 9: The best accuracy for arousal with and without
involving the NCA using kNN classifier in LOSO validation
and the baseline from (Ferdinando and Alasaarela, 2017).
Figure 10: Visual representation of improvements for va-
lence and arousal from the previous studies based on LOSO
validation.
volving the NCA were presented. The HRV-based
features involved in this study were from the normal-
ized one only while the other conveyed information
about valence and arousal insufficiently, confirmed by
the SFFS. The fused features contained a lot of un-
useful features as most of them were discarded by
the SFFS, leaving 14 and 11 features for valence and
arousal respectively.
For valence, the fused features without applying
the NCA offered better performance than the previous
ICPRAM 2018 - 7th International Conference on Pattern Recognition Applications and Methods
468

studies in all validation methods, so also the enhanced
features after applying the NCA. For arousal, feature
fusion did not work as good as for valence. How-
ever, applying the NCA enhanced them to work better
but not at all dimensionality. Results presented here
were the best results with the lowest dimensional-
ity. Overall, feature fusion of normalized HRV-based
and cvxEDA-based features together with feature en-
hancement using the NCA offered new baselines for
both valence and arousal in three validation methods.
Our results in arousal were only slightly above the
best ones from the previous studies based on LOO and
LOSO validation, and was similar to the one based on
10-fold cross validation. Using other feature extrac-
tion method is recommended to enhance the perfor-
mance in all validation methods and employing more
sophisticated classifier other than the simple kNN are
left for future works.
ACKNOWLEDGEMENTS
This research was supported by the Finnish Cultural
Foundation, Northern Ostrobothnia Regional Fund
2017.
REFERENCES
Ferdinando, H. and Alasaarela, E. (2017). Emotion recog-
nition using cvxEDA-based features. In Proceed-
ing of the 3rd International Conference on Electrical
Systems, Technology and Information (ICESTI) 2017.
MATEC Web of Conference.
Ferdinando, H., Sepp
¨
anen, T., and Alasaarela, E. (2016).
Comparing features from ECG pattern and HRV anal-
ysis for emotion recognition system. In 2016 IEEE
Conference on Computational Intelligence in Bioin-
formatics and Computational Biology, CIBCB 2016,
Chiang Mai, Thailand, October 5-7, 2016, pages 1–6.
Ferdinando, H., Sepp
¨
anen, T., and Alasaarela, E. (2017a).
Emotion recognition using neighborhood components
analysis and ecg/hrv-based features. In M. De Mar-
sico, G. S. di Baja, A. F., editor, Lecture Note on Com-
puter Science: Pattern Recognition Applications and
Methods. Springer Berlin Heidelberg, Berlin, Heidel-
berg. Accepted.
Ferdinando, H., Sepp
¨
anen, T., and Alasaarela, E. (2017b).
Enhancing emotion recognition from ECG signals us-
ing supervised dimensionality reduction. In Pro-
ceedings of the 6th International Conference on Pat-
tern Recognition Applications and Methods, ICPRAM
2017, Porto, Portugal, February 24-26, 2017., pages
112–118.
Goldberger, J., Hinton, G., Roweis, S., and Salakhutdinov,
R. (2005). Neighbourhood components analysis. In
Saul, L. K., Weiss, Y., and Bottou, L., editors, Ad-
vances in Neural Information Processing Systems 17,
pages 513–520. MIT Press.
Greco, A., Valenza, G., Lanata, A., Scilingo, E. P., and
Citi, L. (2016). cvxeda: A convex optimization ap-
proach to electrodermal activity processing. IEEE
Trans. Biomed. Engineering, 63(4):797–804.
Shu, Y. and Wang, S. (2017). Emotion recognition through
integrating eeg and peripheral signals. In Proceeding
of the IEEE International Conference on Acoustics,
Speech and Signal Processing (ICASSP). IEEE.
Soleymani, M., Lichtenauer, J., Pun, T., and Pantic, M.
(2012). A multimodal database for affect recognition
and implicit tagging. IEEE Trans. Affective Comput-
ing, 3(1):42–55.
Task Force of the European Society of Cardiology the
North American Society of Pacing Electrophysiology
(1996). Heart rate variability standards of measure-
ment, physiological interpretation, and clinical use.
Circulation, 93(5):1043–1065. HRV autonomic risk
factors.
Wiem, M. B. H. and Lachiri, Z. (2017). Emotion classi-
fication in arousal valence model using mahnob-hci
database. International Journal of Advanced Com-
puter Science and Applications, 8(3).
Zhu, Y., Wang, S., and Ji, Q. (2014). Emotion recogni-
tion from users’ eeg signals with the help of stimulus
videos. In Proceeding of IEEE International Confer-
ence on Multimedia and Expo (ICME). IEEE.
Enhancement of Emotion Recogniton using Feature Fusion and the Neighborhood Components Analysis
469
