
Medical Decision Support Tool from a Fuzzy-Rules Driven Bayesian
Network
Vasilios Zarikas
1,2
, Elpiniki Papageorgiou
1
, Damira Pernebayeva
2
and Nurislam Tursynbek
2
1
School of Engineering, University of Apllied Sciences at Central Greece (TEI of Central Greece), Lamia, Greece
2
School of Engineering, Nazarbayev University, Astana, Kazakhstan
Keywords: Bayesian Networks, Decision Support System, Expert Systems, Fuzzy Rules, Medical Statistics.
Abstract: The task of carrying out an effective and efficient decision on medical domain is a complex one, since a lot
of uncertainty and vagueness is involved. Fuzzy logic and probabilistic methods for handling uncertain and
imprecise data both provide an advance towards the goal of constructing an intelligent decision support
system (DSS) for medical diagnosis and therapy. This work reports on a successfully developed DSS
concerning pneumonia disease. A detailed and clear description of the reasoning behind the core decision
making module of the DSS, is included, depicting the proposed methodological issues. The results have
shown that the suggested methodology for constructing bayesian networks (BNs) from fuzzy rules gives a
front-end decision about the severity of pulmonary infections, providing similar results to those obtained
with physicians’ intuition.
1 INTRODUCTION
Many techniques in the field of artificial intelligence
have been used to represent knowledge: production
rules, semantic nets, Bayesian nets, frameworks,
scripts, statements, logic, causal networks, among
others. Two significant topics of artificial
intelligence are fuzzy logic and bayesian probability
networks (Berner, 2007), (Konar and Chakraborty,
2005), (Konar, 2001). They have been shown to be
effective in the medical decision tasks (Pearl, 2005),
(Adlassnig, 1998), (Steimann and Adlassnig, 2000),
(Chen et al. 2005), (Sittig et al., 2008), (Hudson,
2006), (Fox et al., 2010), (Charitos et al., 2009),
(Fine et al. 1997). The choice of one of these two
techniques is based on two main factors: the nature
of the application and the designer’s skills. Both
decision making methods have been used in many
applications in medicine.
In the last decade, probabilistic reasoning and
fuzzy logic based methodologies were utilized in
handling imprecise data in pulmonary infections
(Pereira and Escuder, 1998), (Schurink et al., 2005),
(Aronsky and Haug, 1999), (Hoare and Lim, 2006),
(Saraoğlu and Sanli, 2007), (Cooper et al., 2005).
In this work, a useful step by step presentation of
the design of an implemented DSS and its reasoning
is given. It concerns pulmonary infections and a
decision making concerning the severity of the
disease (Zarikas et al., 2015). Physicians (stand as
medical experts) reported certain and uncertain
scientific knowledge concerning the disease of
pneumonia (Mani, 2000). The physicians expressed
their knowledge in the form of if-then rules. The
designer of the network in cooperation with the
experts/physicians assigned linguistic fuzzy values
to describe the probability between the observables
and the decision. Then these linguistic values were
transferred to numerical values using defuzzification
process in order to fill the conditional probability
tables. Finally, the system forecasts the severity of
pneumonia and drive a decision concerning their
admission in Internal Care Unit (ICU). The
simulations for test patients performed using the
implementation of the proposed methodology.
The main objective of this paper is to introduce,
analyze, and illustrate in a pedagogical way the
methodology that have already been described
mathematically in (Zarikas et al., 2015). Many
researchers contacted us and required a more
detailed description of the reasoning behind the
formulas appeared in (Zarikas et al., 2015). Because
of the relative novel character of the application in
the field of medical sciences, this paper gives a
detailed explanation on the proposed methodology
and the application preview the effectiveness of the
method.
Zarikas, V., Papageorgiou, E., Pernebayeva, D. and Tursynbek, N.
Medical Decision Support Tool from a Fuzzy-Rules Driven Bayesian Network.
DOI: 10.5220/0006642705390549
In Proceedings of the 10th International Conference on Agents and Artificial Intelligence (ICAART 2018) - Volume 2, pages 539-549
ISBN: 978-989-758-275-2
Copyright © 2018 by SCITEPRESS – Science and Technology Publications, Lda. All rights reserved
539

The paper is organized into the following
sections: the second section presents a description on
Bayesian networks and influence diagrams. It also
provides a description on how fuzzy rules assigned
by medical doctors, are used to construct conditional
probability tables. The third section presents a
statement of the problem and how the BNs for the
specific problem is constructed by fuzzy rules
introduction. The fourth section provides a
description on stages of the development of the
correct topology used in the BN tool, presenting the
inference approach too. The fifth section outlines the
results and the main conclusions of the study.
2 BAYESIAN NETWORKS AND
FUZZY RULES
The definition of a consistent mathematical
framework that allows the integration of certain and
uncertain pieces of information into a plan of
reasoning, would provide a necessary knowledge
representation platform for every domain expert.
Such a model of knowledge representation already
exists and is known as belief network or Bayesian
Network (BN) or causal graph (Jensen, 2000),
(Pearl, 1988), (Stutz an Cheeseman, 1994),
(Friedman and Goldszmidt, 1998), (Heckerman and
Geiger, 1994).
Designing a Bayesian network means the
following tasks (i) define arcs from cause variables
to their effects; causal relationships reveal the
conditional dependencies and independencies, (ii)
assign values in Conditional Probability Tables
(CPT) based on prior knowledge and data, (iii)
finally appropriate algorithms have to been
employed (Pearl, 1986), (Pearl, 1987), (Pearl and
Verma, 1987) to determine various probabilities
from the network.
The synthesis of Utility theory and Bayesian
graph theory formulates the Decision theory
(Winkler and Robert, 1972), (Horvitz, 1988),
(Morgan and Bruce, 1968). The decision system that
is described in the present work follows the usual
assumptions. First we work with a set of mutual
exclusive actions and non-intervening actions i,e,
actions that their state is not correlated with P(H),
where H is the determining variable that affects the
decision. The expressive power of BNs becomes
obvious considering that they can encapsulate
statistical results, probability distributions, certain or
uncertain opinions, utilities, preferences, strategies,
goals and actions.
The fuzzy logic is based on fuzzy if-then rules
which have the general form “IF X is A THEN Y is
B,” where A and B are fuzzy sets. A fuzzy set is a
set containing elements that have varying degrees of
membership in the set. Elements in a fuzzy set,
because their membership need not be complete, can
also be members of other fuzzy set on the same
universe.
The physicians express their knowledge in the
form of fuzzy if-then rules due to the human
thinking approach. The experts accompanied with
the physicians assign linguistic fuzzy values
produced by each IF-THEN rule, to describe the
probability between the decision and the
observables. These linguistic values, through the
defuzzification approach of fuzzy logic, are
transferred to numerical values in order to fill the
conditional probability tables.
In order to show how the probability tables for
BNs are developed using the above type of if-then
rules, a generic approach is provided. Let’s consider
the following rule for the assessment of risk or
severity of an infection X: “IF symptom/observable-
A increases Then severity of infection X decreases”
(rule 1). This rule suggests information capable to
provide probabilities for the conditional probability
table (CPT) between the severity of infection and the
observable A.
The above rule is translated as: there is a
negative effect on severity from symptom A. This
means that the lower state of severity conditioned on
the higher state of symptom has a very very large
probability. In the simple case that both
``symptom/observable A” and ``severity of
infection/decision X” have only two states CPT
assignment is shown in Table 1. The inference of the
rule 1 could be described as:Rule Infer: The
probability P(severity-|A+)=very very high. The
linguistic description "very very high" might be
assigned with a fuzzy set with corresponding
membership functions.
Table 1: CPT of symbol A.
Symptom A
Severity X +-
+ complement 0.5
- v.v. high 0.5
The membership functions that constitute the
fuzzy sets which describe the inference of the fuzzy
rules are depicted in Figure1. This means that from
rule 1, there is a fuzzy belief which is assigned by
the fuzzy set shown in Fig. 1. After defuzzification
with the Center of Area method, a numerical value
of each fuzzy set is produced. The produced
numerical value is used to fill the probabilities in
ICAART 2018 - 10th International Conference on Agents and Artificial Intelligence
540

CPT (Zarikas et al., 2015).
Therefore, we attempt to fill up the CPT for the
different states of A and severity of infection X
using this reasoning. In this point it worth stressing
that experts together with the physicians assign the
fuzzy values to describe the probabilities in CPT
between the decision and symptoms. First, they
extract the correct inference of the rule 1 i.e. that the
probability P(severity-|A+) is "very very high".
Second, the "very very high" probability is
transferred to the numerical value of 0.9, according
to the defuzzification process of the related fuzzy
sets. If there is no information for the effect on
severity X in the case that A decreases then neutral
policy is followed. This means that a probability of
0.5 for both ‘+’ and ‘–’ states of a variable is
assigned. This means that we assign probabilities
following neutral policy. Thus, Table 2 changes to
Table 3.
Table 2: CPT-probability (severity (X|A)).
Symptom A
Severity X + -
+ 0.1 0.5
- 0.9 0.5
Let's consider the “opposite” case of a rule in the
form: If symptom/observable A decreases Then the
severity of infection X increases. Now the Infer of
the rule is:
Probability P(severity+|A-)=v.very high and the
CPT table is completed in an analogous way
resulting to probability P(severity+|A-)=0.9. It is
obvious that A is in general a different symptom
than the one mentioned before in Tables 1, 2.
There are also cases that the number of states of
the severity of a disease is more than two. In what
follows, an explanation of how it is possible to
construct CPTs for such multistate variables based
on fuzzy rules is given. Let us work with the rule 1,
“If severity A increases then severity of infection X
decreases”. Assuming that the symptom/observable
A is described by three states: {weak, moderate,
strong} and the severity or risk of infection X has
four states: {small, medium, high and very high},
then for the CPT it is needed to assign values for:
P(very small severity|A weak), P(very small
severity|A strong), P(very small severity|A
moderate), P(small severity|A weak), P(small
severity|A strong ), P(small severity|A
moderate),....etc.
These probabilities are proposed to be described
by eight (8) membership functions for
P(severity_state
i
|A moderate) and
P(severity_state
i
|A strong ) borrowed from fuzzy
logic methodology. Finally all P(severity_State
i
|A
weak) are equal to 1/4 due to neutral assignment
policy. These membership functions have been
defined by the related fuzzy sets as illustrated in
Figure 1.
Figure 1: Membership functions used.
Thus the probability to decrease severity X as A
increases could be assigned in a numerical value 0.7
derived by fuzzy sets as presented in membership
functions describing the “high” probability. The
following CPT for the different states of A and
severity X is needed to fill up Table 3 considering
the above fuzzy sets and their ranges.
Table 3: Probability (severity (X|A)) for multistate
example.
Symptom-A(state)
Severity X Weak Moderate Strong
small - medium high 0.6 High 0.7
med -
weak
0.3
very weak
0.2
high - very weak 0.2 v.v.wea
k
0.1
very high - 0 0
Next, Table 4 is filled up respecting axioms of
bayesian probabilistic theory. Furthermore, neutral
policy was also applied for the entries we have no
information coming from the rule. It is worth
mentioning that if a companion rule of the form “If
symptom/observable A decreases Then the severity
of infection X increases” then it would be possible to
fill all the entries of the CPT.
Table 4: Probability (severity (X|A)) for multistate
example.
Symptom A
Severity-X Weak moderate strong
Small 0.25 0.55 0.7
Med 0.25 0.3 0.2
High 0.25 0.15 0.1
Very high 0.25 0 0
Medical Decision Support Tool from a Fuzzy-Rules Driven Bayesian Network
541

Let us now consider another type of medical rule
with two observables A and B to determine the
severity of an infection X. The severity of the
infection X is considered to have four states: {small,
medium, large, v.large}. The physician assigns next
rule to determine severity:
``IF observable A is "Yes" and observable B
decreases THEN severity of infection is medium”.
This rule could be infer the probabilities:
P(Severity med|low, Yes)=v.high (equals to 0.8)
P(Severity med|moderate, Yes)=high (equals to 0.7).
The CPT for the different states of observables A
and B and severity of infection X is filled up as in
Table 5.
Table 5: CPT-Probability (severity |AB,BA).
(A)NO (A)YES (exist)
(B)
low
(B)
mod
(B)
high
(B)
low
(B)
mod
(B)
high
Small
Medium 0.8 0.7
Large
v. large
Next step is to normalise the columns (A)YES-
(B)low and (A)YES-(B)mod and finally complete all
the other collumns following neutral policy. Thus,
Table 6 (CPT-completed filled-
Probability(Severity|B,A)) is derived.
Table 6: CPT-completed Probability (severity |B,A).
Observable A
Severity NO YES (exist)
low mod high low mod high
Small 0.25 0.25 0.25 0.1 0.15 0.25
Medium 0.25 0.25 0.25 0.8 0.7 0.25
Large 0.25 0.25 0.25 0.1 0.15 0.25
v. large 0.25 0.25 0.25 0 0 0.25
3 PROBLEM AND TARGET
Some common criticisms about applied Bayesian
networks concern the necessity of filling correctly a
lot of conditional probability tables. However, the
involvement of all these probability tables, is the
reason that makes this decision tool extremely
precise, expressive and mathematically consistent.
BNs indicate emphatically to any decision builder
how many pieces of information are involved for a
precise decision making. The required big set of
probabilities by no means can be disregarded
unwisely for the sake of simplicity or approximation
or a fault decision will be driven. However, it is
possible to find methods for filling in a correct way
the missing pieces of information. The present work
describes such a method for the problem under
study.
Another issue is that experts complain that the
human brain does not work in this way and even
scientists (not experienced in “Bayesian language”)
cannot easily report safely all these numbers in order
to describe a domain knowledge. A practical
solution of this problem is presented in this work for
a particular medical case. However, the selected
medical decision problem is not a special one but a
quite typical and general case. Experts report a list
of rules containing estimates about probabilities.
These rules are a subset of all the possible rules that
the full problem would require and the reasoning
and the justification behind this reduction is
explained in the relevant sections below.
For the chosen medical problem of pneumonia
(pulmonary infections) the prediction of severity is a
complicated process with many parameters, factors
and preconditions (Gennis et al., 1989), (Langer
1994). See also CDC Criteria for Defining
Nosocomial Pneumonia, online available in http://
www.cdc.gov/.
For the problem of pneumonia, a number of
typical symptoms are associated. If pneumonia is
suspected on the basis of a patient's symptoms and
findings from physical examination this indicates
that more tests are needed to confirm the diagnosis.
The set of all these data provide a basis for
evaluation the severity of infection and the need for
intensive care (Schurink et al., 2005).
Thus, severity of getting infected by pneumonia
can be approximated by observing several
symptoms. In the present work, three physicians
(stated as experts), from the General Hospital of
Lamia, Greece, were selected at first to define the
number and type of symptoms-observables affecting
the problem of pulmonary infection. Thirty-four
different symptoms were reported, named from C1
to C34. These symptoms listed in Table 7, are well
documented in bibliography. These are the main
variables that have an important role in the final
diagnostic inference. For this application,
symptom/observable values take either two, three,
four or five possible discrete or fuzzy values, as
shown in Table 8. Each one variable/observable has
different states, for example C4 (fever) is separated
into five fuzzy values: no fever (36-38.4C), low
grade (38.5-38.9C), moderate, high grade,
hyperpyrexia (>41^{0}).
Next, the three physicians (expert doctors) were
ICAART 2018 - 10th International Conference on Agents and Artificial Intelligence
542

interviewed in order to construct a certain list of
rules containing estimates of the probability of
infection. Such rules, defining which symptoms
increase or decrease the risk of infection, can build
the base for a Bayesian network. The target is to
encode the medical expert's knowledge about
pneumonia in a Bayesian network. The complete set
of rules can be found in the published work (Zarikas
et al., 2015) in Appendix, “Rules”. Rules have been
given in the form of:
If Cn {increases|decreases|exists}then the risk of
infection is {small|medium|large|very_large} or
{increases, decreases},
while for two or more symptoms in the following
form:
If Cn {increases|decreases|exists} and Cm
{increases|decreases|exists}then the risk of infection
is {small|medium|large|very_large}or {increases,
decreases},
where Cn and Cm are two different symptoms.
Experts have also stated that most of the times
doctors know evidence for one, two or three at most
symptoms from an examined patient.
Here it is worth pointing out that the proposed
decision module is not a rule based expert
subsystem. It is rather a probabilistic decision
subsystem encoding medical “rules” expressing
certain and uncertain knowledge. In order to design
and implement the full Bayesian network with all
the conditional probability tables a much larger set
of rules is needed to cover them. However
interviewing doctors, a medically correct strategy
was constructed in order to fill the gaps in the
probability tables.
So far, we have only presented a general
approach on how from the previously mentioned
fuzzy rules, CPTs are constructed. In what follows,
the proposed approach as well as the overall
reasoning is explored and analyzed to the particular
problem to accomplish the final decision.
Table 7: Concepts coding pulmonary infections.
Nodes
C1: Dyspnea
C17: Radiologic evidence of
complicated pneumonia
C2: Cough C18: Acidity (pH)
C3: Rigor/chills C19: Partial pressure of oxygen
C4: Fever C20: Partial pressure of CO2
C5: Loss of appetite C21: Oxygen saturation O2%
C6: Debility C22: White blood cells (WBC)
C7: Pleuritic pain C23: Immunocompromise
C8: Heamoptysis C24: Comorbidities
C9:Oxygen
requirement
C25: Age
C10: Tachypnea C26: Sputum culture
C11:Acoustic C27: Bronchial secrets culture
characte
r
C12:(Glascow Comma
Scale)
C28: Blood culture
C13:Systolic-Blood
Pressure (mmHg)
C29:Pleural Fluid culture
C14: Diastolic blooΙf C30: Mantoux
C15:Tachyca
r
dia C31:Gram stain (gram (+)
C16:Radiologic
pneumonia
C32: Urinary antigen test
C33: Pathogen Sensitivity
4 DESIGNING THE BAYESIAN
NETWORK
In this section we describe how a Bayesian network
is designed for the particular medical problem. We
are going to create three types of nodes:
• for every symptom a symptom node
• for every rule or group of paired rules a rule node
• for every rule node a severity utility node
• one central utility comprising the overall utility
and one decision node concerning admission to
the ICU or not.
4.1 Symptoms
As a first step the symptoms should be entered in the
BN, see Fig.2. In general, one symptom has different
number of states according to physicians-expert
knowledge and medical guidelines. Consequently,
these states are associated with fuzzy membership
functions, see Table 8 for examples.
Every symptom is represented by a probability
informational node called Cn with the symptom's
states as possible values for the node. From now on,
these nodes will be denoted as symptom nodes.
The probability table of these nodes can be filled
with certain or uncertain information (prior
probabilities/evidences). Physicians report their
knowledge by providing fuzzy rules based on their
knowledge and guidelines from which our system
extracts probabilities. This extraction is done
following the method described in the section 3.
Table 8: Examples for symptoms.
Symptom Type of values (discrete or fuzzy)
C7 Pleuritic
pain
Two discrete values: 0, 1
C4 Fever
Six Fuzzy values (“hypothermia” (34-36),
“no fever” (36-38.4), “low” (38.5-38.9),
“moderate” (38.9-39.5), “high” (39.5-
40.9), “hyperpyrexia” (>41))
C23: Immuno Two fuzzy values (presence, absence)
Medical Decision Support Tool from a Fuzzy-Rules Driven Bayesian Network
543

Figure 2: Symptom nodes.
Values according to the results of patient's
examinations or according to physicians's subjective
appraisal are entered. In case that there is no
evidence for one particular symtom statistical data
that can provide frequencies may be used either for
the group that the patient belongs to, or for the
patient's historic profile. Thus, for a particular
case/patient the probability table for the symptom
C7 Pleuritic pain could look like this opposed in
Table 9.
Table 9: Probability table for the sympton C7 Pleuritic
Plain.
C7 Pleuritic pain Probability
State0 0.3
State1 0.7
Thus, the value 0.7 for the probability of State1
can arise from statistics about a high-risk group or
from a doctor's judgment or patient’s examination,
see Table 9. In case a physician detects no clarity or
definiteness on the answer of a patient he can assign
a probability less than unity. If there is no evidence
about the prior probabilities of a symptom node then
a neutral policy regarding the prior probabilities can
be applied (assign equal probabilities for a multiple
state symptom). In most cases, soon after the
patient's visit to the medical center only a few
symptoms can be reported or measured with a
certain or uncertain degree of belief. For the rest of
them that remain unspecified, either a neutral policy
should be followed in order to assign prior
probabilities or (as in our case) the setup of an
algorithm which disregards from the whole BN all
the child of the non-relevant symptom nodes is
needed.
4.2 Implementing the Rules
Medical rules encode the necessary information with
the help of which, it is possible to associate
probabilistically disease’s severity and symptoms.
Table 10: Conditional probability table of the risk of
infection node as a direct children.
Symptom
1
State 0 …
Symptom
2
State 0 State 1
State
2
.. ..
Symptom 3
State
0
State
1
State
2
…
State
0
State
1
… .. . …
.
.
.
.
.
.
.
.
.. .. .. . .. . …
large
severit
y
p1 p2 p3 … … … … .. . …
small
severit
y
1-p1 1-p2 1-p3 … … … … .. . …
4.2.1 A First Topology
Naively, since all symptoms causally influence the
node severity, a connection of all symptom nodes to
the central node representing severity is expected.
However, this design results to an non solvable
topology. It generates a quite large probability table.
Furthermore, for adding a new rule, it would be
required to modify the values for the previous
entered rules! In summary, a CPT that represents
more than two or three rules is not manageable.
Table 10 illustrates clearly the complexity of the
CPT in the simple case of a two-state severity node.
The row large severity encapsulates the chances for
large severity of infection, given the states of the
column for the symptoms
1, 2
( ,..., )
m
p
pp
, where
N is given by
i
Nn
with i=1,2,..k. where k is
the number of symptoms and
i
n
the number of
states of symptom
i. The row small severity
contains the complementary probabilities. It is
obvious that although one rule concerns only one or
two symptoms the topology results to the fact that
every rule affects all probabilities in the CPT.
Nevertheless, this is the correct topology that ideally
represents the modelling of knowledge for the
disease and its set of symptoms. This clearly shows
all the elementary pieces of knowledge involved.
Thus, in some cases, where a set of rules encode
critical information, it may be necessary to acquire
the relevant knowledge and construct a part of this
very detailed topology.
ICAART 2018 - 10th International Conference on Agents and Artificial Intelligence
544
4.2.2 Tractable Topology
A new simplified topology that works very
efficiently is generated if for every rule a single rule
node is assigned (see Figure 3). Fr this reason we
name each rule node as sev-Cn or sev-Cn-Cm where
n and m identify the symptoms involved in the rule.
Rule nodes are causally affected by the symptom
modes. In general, one or more symptoms affect one
or more rules. Sometimes, it is preferable, two rules
with the same symptoms to be combined in one rule
node. Figure 3 shows the improved BN containing
all symptoms and all rule nodes. Each rule node can
be viewed now as a determining variable.
Figure 3: Rule nodes.
Although this is not a complicated topology
many conditional probabilities have to be
determined. Naively, one can say that the available
rules provide less than the required amount of
information. However, as we have previously
explained physicians interpret and work with them
in a way that allows to fill in the table. Let's explain
the proposed method with one more example based
on the following rule: “if symptom A is strongly in
state1 (one of three states) then the severity of
infection is large”. Apart from the obvious
information that the conditional probability of large
severity is a number close to unity conditioned on
state 1, we can deduce more information. Following
physicians' instructions, reported in the interviews,
for some particular rules a complement (in our case
small) probability for severity of infection can be
assumed if the condition of the rule isn't satisfied.
However, note that for most cases the negation
of the first part of the rule is connected with no
preference i.e. leads to neutral assignment of
probabilities for risk states. Such cases have already
been presented in the previous section. Now what
about the other states; if the states of the symptom A
comprise an ordinal scale (state "1" is smaller than
state "2" and state "2" smaller than state "3") then in
most cases, except if physicians state otherwise, it is
allowed to understand that the rule remains less true
for symptom in state “2” and not true for symptom
in state “3”.
Let's consider rule 30 and rule 31, see (Zarikas et
al., 2015). These two rules can be represented by
one combined rule node. When both these rules are
not satisfied it means that they point to a not large
severity. One can assign a conditional probability
equal to 1 for C22 on state “normal” and on state
“small” severity. Since the condition of the rule is
not satisfied (C22 is neither in the higher state nor in
the lower state) we assign 1 to the probability for a
small risk independently of what is the state of C1.
Alternatively another possible assignment is to set
probability equal to one for P(severity|normal,state0)
and P(risk|normal,state1) and a probability close to 1
(for example 0.9) for the other two
P(severity|normal,state2) and
P(severity|normal,state3) since the latter are
associated with states of increased C1-dyspnea.
Table 11 presents a first realization of rule 30 and its
companion rule 31:
Table 11: Conditional probability table of the risk of
infection node as a direct children.
C22 leuko
p
enia Normal Leukoc
y
tosis
C1 ...
State
0
State
1
State
2
State
3
...
small ... 1 1 0.8 0.8 ...
m
ediu
m
... 0 0 0.15 0.15 ...
lar
g
e ... 0 0 0.05 0.05 ...
very
lar
g
e
... 0 0 0 0 ...
Note that if in Table 11 all entries in the first raw
(small severity) are set to one while all entries in all
other rows (medium, large, very large) are set to
zero, no large modifications will be raised in the
final provision of decisions.
If C22 has the value leukocytosis means that C22
have increased and therefore the condition of the
rule 30 is satisfied, provided that C1 is increasing
too, pointing to large severity. Linear interpolation
provides values in between, for the row “large”, see
Table 12.
In case that C1 is in State1 or State2,
P(medium|leukocytosis,1or2) is essential to be
greater than 0. For example, it could be initially
P(medium|leukocytosis,1or2)=0.3 and
P(medium|leukocytosis,0or3)=0.
Medical Decision Support Tool from a Fuzzy-Rules Driven Bayesian Network
545

Table 12: First part of the probability table for rule C22-
C1.
C22 Leukopenia Normal Leukocytosis
C1 ... ...
State
0
State
1
State
2
State
3
small ... ... 0.7 0.5 0.2 0
Medium ... ... - - - -
large ... ... 0.2 0.5 0.8 1
Very large ... ... - - - -
Next, row “large” is kept the same while reduced
values of probabilities are set to the CPT entries
above and below a specific element of row “large”.
Consequently, every column is normalized to a sum
of 1 in each column. Therefore, following this
reasoning, we retune values in Table 12, composing
Table 13:
Table 13: First part of the CPT for rule C22-C1.
C22 Leukopenia Normal Leukocytosis
C1 ... ... State
0
State
1
State
2
State
3
small ... ... 0.5 0.1 0 0
medium ... ... 0.15 0.2 0.1 0
large ... ... 0.2 0.5 0.8 1
Very
large
... ... 0.15 0.2 0.1 0
Keeping the same reasoning (explained for
leukocytosis), the column leukopenia can be
determined by rule 31. The usage of all given riles
resulted to the development of 102 rule nodes in the
final decision network.
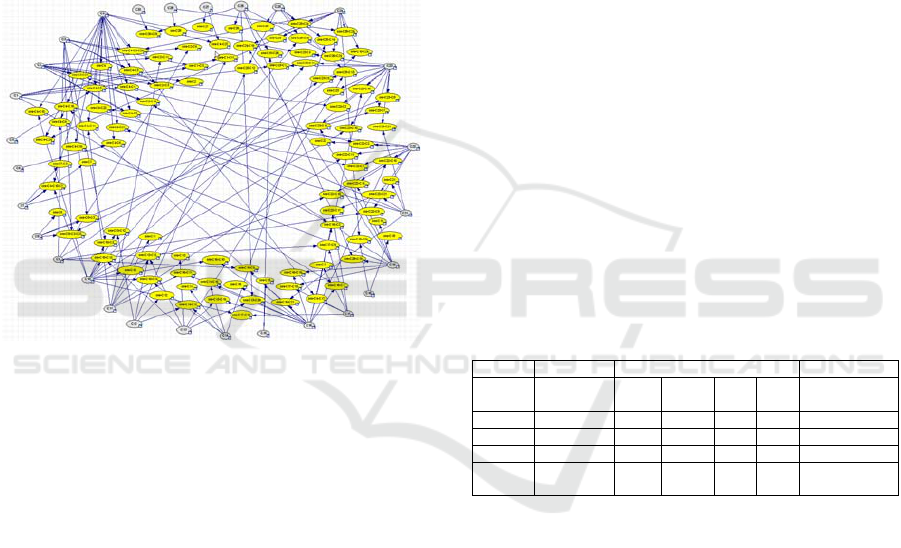
4.2.3 Connecting the Rule Nodes
After defining and setting all the rule nodes, the next
step connects them with a utility node and through it
to the final decision node. The Utility node can be
modelled like Table14 and associates the decision
node with the determining variable or variables. In
this table a determining variable representing the
total information which concerns the severity of the
infection has been assumed. The decision node has
been modeled with two states “Admission” meaning
ICU admission and “No admission”. Table 14
contains utility values for the four states of the
determining variable. It will become apparent below
that it is preferable to design more than one utility
nodes (one utility for a group of similar determining
variables). Now, determining variables are the so
named rule nodes.
Table 14: First part of the CPT for rule C22-C1.
Determining
variable of
severity
ICU admission
no ICU
admission
low 0 1000
medium 330 660
large 660 330
very_large 1000 0
The utility table is not a uniquely determined
quantity. It reflects the strategy of the domain expert
and thus different utility values can be set,
depending on how conservative or strict is the
selected policy. Physicians, suggest that a larger
certainty for one state of severity of infection should
be given, if more rules point towards it. However, in
some cases that evidence is given (updating the prior
probabilities of certain symptoms for a patient) a
discrepancy may arise. If one or more rules indicate
a small risk, while other rules indicate a large risk
the implemented software provides a warning signal.
This build in check of all active rules enhance
significantly the performance of our decision tool.
Note, that active rules are the rules that have been
activated by updating the prior probabilities of
certain symptoms.
4.2.4 Connecting All Rules
It was explained why it is not a wise choice to
connect all the 102 rule nodes to one central utility
node. The central utility node contains a double-row
table with utility weights expressing the strength of
infection for the given states of the parent nodes
(Table 15). Therefore, a column represents one
combination of states of the parents’ nodes. Every
rule node has four states small, medium, large and
very large. So for every possible assignment of each
of the 102 nodes with one of the 4 values, we need a
utility table with
102
4
columns, which are too many
for a decision system to deal with.
However, for clarification reasons further
elaboration on this topology with one utility will be
devoted in order to illustrate the meaning of the
entries of this utility table. The decision node ICU
admission with the states yes and no allows defining
utility values for these two states, see Figure 4 and
Table 15.
A problem that appears usually in medical
diagnostic decision systems is the possibility the
reported symptoms to lead to a serious discrepancy
regarding the risk/severity of infection. It is always
possible a patient to report mistakenly a symptom
ICAART 2018 - 10th International Conference on Agents and Artificial Intelligence
546

that activate rule or rules that point to a very large
risk/severity of infection while other symptom or
symptoms point to small chance of infection.
Therefore, a separate check for a discrepancy by an
appropriate algorithm is necessary.
A significant remark is that in realistic cases only
few rules from the whole set are activated by the
updated symptoms. This has an important
consequence. All these rule nodes that have not been
activated by updated symptoms, are associated with
a parent symptom node with neutral set of
probabilities. This finally drives the system towards
a neutral decision. If most rules are not activated and
only two or three rules indicate with 0.8 chance a
large severity, the final result through the utility
node would point to a medium level expected utility
value in the scale of 0-1000. This fact provides
difficulties for the system to drive a clear positive
infection decision. However, this is also an issue that
can easily resolve with the help of a special
algorithm that excludes non-activated rules.
The proposed solution includes an extra layer of
utility nodes. Each rule node is connected to a utility
node i-Cn-Cm which is named “admission node”
(see figure 4). Thus, the role of the admission nodes
is to convert the probabilistic representation of the
severity of infection into a utility value as it can be
seen in Table 15.
The central utility (weighted severity for
admission) is the chιld of all admission nodes (see
figure 4). This final node combines the utilities on
admission from all rules together. Technically the
central utility node is expressed by a utility node of
type MAU (Multiple Algorithm Utility). MAU,
utility node integrates many utility nodes with the
help of a mathematical expression depending on the
values of their parent nodes. It uses typical functions
such as sum, division, maximum/minimum and
logical operations.
Table 15: Theoretical Central Utility Table.
Rule 1 small small ... small
Rule 2 small small ... large
... ... ... ... ...
Rule n small small ... medium
Infection positive negative ... positive
Value 50 950 ... 500
Rule 1 small ...
Very
large
Very
large
Rule 2 large ...
Very
large
Very
large
... ... ... ... ...
Rule n medium ...
Very
large
Very
large
Infection negative ... positive negative
Value 500 ... 1000 0
Figure 4: Inflection nodes (in blue).
The decision tool was developed based on the
code of Bayes Fusion, given for academic use This
software provides a built-in maximum function for
MAU nodes. The code cannot support an estimation
of the maximum over all rule values if they are more
than 20. One solution is to collect the infection
nodes into small groups and then calculate the
maximum of the maximums. Another way is to
assign equal weight to utilitiy of each rule.
In order to evaluate the severity of infection there
is no need to take under consideration all the set of
the rules. Since only a few symptoms are given for a
particular patient, the rules that contain these
symptoms will control the decision. Consequently, a
few rules are often updated with non neutral prior
probabilities which result in a noteworthy risk.
However, as we have noticed the contribution of all
the rest may affect considerably the final decision.
This problem is resolved easier with the extra layer
of utility nodes and the addition of a central node
with a maximum MAU nodes evaluation scheme.
As a last step it's necessary to ensure that there
are no discrepancies otherwise a notification has to
be provided. As mentioned earlier we expect every
symptom to report more or less the same results. If a
patient has a very large and a small value of severity
at the same time, something went wrong. The tool
have implement an algorithm which evaluates the
differences of the minimum and the maximum of all
risks given by the selected rules. If the difference is
above a predefined threshold the user is notified
about.
5 RESULTS AND DISCUSSION
After construction of Bayesian network using the
Bayes Fusion platform (https://www.
Medical Decision Support Tool from a Fuzzy-Rules Driven Bayesian Network
547

bayesfusion.com/), a number of patient cases have
been examined in order to set evidences to the
network and illustrate its decision-making
capabilities. Specifically, (84) decision making cases
on pneumonia severity assessment have been
derived from a randomly selected set of anonymous
patients with confirmed pneumonia. The decision-
making capabilities of the technique was presented
by simulating these patient cases and estimating the
outcomes. The results have been reported in (Zarikas
et al., 2015).
This work provides a pedagogical description of
all the methodology that was followed to design the
implemented DSS. It is a response to many requests
to provide a clear explanation of the reasoning
behind the formulas presented in (Zarikas et al.,
2015). First, a new methodology for construction of
BNs using if-then rules and main aspects of fuzzy
logic is clearly presented and second, the efficient
modeling and reasoning concerning the
implementation of all rules to a network with a
specific topology, is given. The method, we
presented in this paper can be generalized to similar
fuzzy rule bases.
Novel ideas that have been materialized in the
DSS are: 1) Physicians have not been involved for
the probability assignments but only for reporting
and explaining the rules 2) Fuzzy rules have been
translated into probabilities 2) There is an
intermediate layer of utilities that transfer their
values to a central utility node 4) The fuzzy rules are
comprehensive enough for a physician, and describe
a simple symptom/disease causal relation. A
particular set of patients with pulmonary infections
were studied as a first preliminary test of the
decision making system on severity assessment and
show the methodology's performance.
Future work is focused to analyze and implement
this approach in other domains and decision
problems, to include more knowledge and
information types for the decision model
enhancement. Specifically, extracted knowledge
from other sources except physicians’ suggestions,
such as data through data mining and medical
guidelines, will be taken under consideration for the
model enhancement.
REFERENCES
Adlassnig, K. P., 1998. A fuzzy logical model of computer
assisted medical diagnosis, Meth. Inf. Med., 19, 141–
148.
Aronsky, D., and Haug, PJ., 1999. An integrated decision
support system for diagnosing and managing patients
with community-acquired pneumonia, Proc AMIA
Symp, 197–201.
Berner, E.S., 2007. Clinical Decision Support Systems:
Theory and Practice, Springer.
Charitos, T., van der Gaag, L.C., Visscher, S., Schurink,
K.A.M., Lucas, P.J.F., 2009. A dynamic Bayesian
network for diagnosing ventilator-associated
pneumonia in ICU patients. Expert Systems with
Applications, 36 (2), 1249-1258.
Chen, H., Fuller, S.S., Friedman, C.P., 2005. Medical
Informatics: Knowledge Management and Data
Mining in Biomedicine. Integrated Series in
Information Systems, Springer Verlag.
Cooper, G.F., Abraham, V. Aliferis, C.F. Aronis, J.M.,
Buchanan, B.G., Caruana, R., Fine, M.J., Janosky,
J.E., Livingston, G., Mitchell, T., Monti, S., Spirtes,
P., 2005. Predicting dire outcomes of patients with
community acquired pneumonia, In Journal of
Biomedical Informatics, Volume 38, Issue 5, 2005,
Pages 347-366.
Fine, M.J., Auble, T.E., Yealy, D.M., Hanusa, B.H.,
Weissfeld, L.A., Singer, D.E., Coley, C.M., Kapoor,
W.N. 1997. A prediction rule to identify low-risk
patients with community-acquired pneumonia, New
England, Journal of Medicine, 336 (4), 243-250.
Fox, J., Glasspool D., Patkar V., Austin M., Black L.,
South M., Robertson D., Vincent C., 2010. Delivering
clinical decision support services: There is nothing as
practical as a good theory, In Journal of Biomedical
Informatics, Volume 43, Issue 5, Pages 831-843.
Friedman, N. & M. Goldszmidt, 1998. "Learning Bayesian
Network from Data." SRI International.
Gennis, P., Gallagher, J., Falvo, C., Baker, S., Than, W.,
1989. Clinical criteria for the detection of pneumonia
in adults: guidelines for ordering chest
roentgenograms in the emergency department. The
Journal of emergency medicine, 7 (3), 263–8.
Heckerman, D., Geiger D., 1994. "Learning Bayesian
Networks. Microsoft Research: Redmond WA., p. 3.
Hoare, Z., Lim, W.S., 2006. Pneumonia: update on
diagnosis and management. BMJ 332, 1077–79.
(http://www.bmj.com/cgi/content/full/332/7549/1077).
Horvitz E.J., Breese, J. S., Henrion S.M., 1988. “Decision
Theory in Expert Systems and Artificial Intelligence”.
Hudson D.L., 2006. Medical Expert Systems,
Encyclopedia of Biomedical Engineering, John Wiley
and Sons.
Jensen, F.V. 2000. “An Introduction to Bayesian
Networks”, UCL Press Limited.
Konar, A., 2001. Artificial Intelligence and Soft
Computing – Behavioral and Cognitive Modeling of
the Human Brain, first ed., CRC Press.
Konar, A., Chakraborty, U. K., 2005. Reasoning and
unsupervised learning in a fuzzy cognitive map.
Information Sciences, 170(2-4), 419–441.
Langer, M., Pifferi S. Peta, M., 1994. Diagnosis of
bacterial infection in the ICU: General principles.
Intensive Care Medicine, 20(4), 1432-1238.
Mani, S., Valtorta, M., Dermott, S 2005. Building
Bayesian Network Models in Medicine: The
ICAART 2018 - 10th International Conference on Agents and Artificial Intelligence
548

MENTOR Experience, Applied Intelligence 22, 93–
108.
Morgan, Bruce W. 1968. An Introduction to Bayesian
Statistical Decision Processes. Prentice-Hall Inc.,
Englewood Cliffs, N.J., p. 15.
Pearl, J., 1986. "Fusion, Propagation and Structuring in
Belief Networks," UCLA Computer Science
Department Technical Report 850022 (R-42);
Artificial Intelligence, Vol. 29, No. 3, 241-288.
Pearl, J., 1988. Probabilistic Reasoning in Intelligent
Systems: Networks of Plausible Inference, (San
Mateo, CA: Morgan Kaufmann).
Pearl, J., 1987. "Evidential Reasoning Using Stochastic
Simulation of Causal Models," UCLA Computer
Science Department, Technical Report 860021 (R-68);
Artificial Intelligence, Vol. 32:2, 245-258.
Pearl, J., & Verma,T., 1987. "The Logic of Representing
Dependencies by Directed Graphs," UCLA Cognitive
Systems Laboratory, Technical Report 870004 (R-79),
in Proceedings, AAAI Conference, Seattle, WA, 374-
379, July 1987.
Pearl J., 2005. "Influence Diagrams--Historical and
Personal Perspectives", UCLA Cognitive Systems
Laboratory, Technical Report (R-326), In Decision
Analysis, Vol. 2, No. 4, 232-234,
Pereira, J.C.R., Escuder, M.M.L., 1998. The importance of
clinical symptoms and signs in the diagnosis of
community-acquired pneumonia. Journal of Tropical
Pediatrics, 44 (1), pp. 18-24.
Saraoğlu, HM, Sanli, S., 2007. A fuzzy logic-based
decision support system on anesthetic depth control
for helping anesthetists in surgeries. J Med Syst.
Dec;31(6):511-9.
Schurink, C.A.M et al. 2005. Computer-assisted decision
support for the diagnosis and treatment of infectious
diseases in intensive care units. Lancet Infect Dis 5:
305–12.
Sittig, D.F., Wright, A., Osheroff, J. A., Middleton B.,
Teich, J.M., Ash J. S., Campbell, E., Bates D.W.,
2008. Grand challenges in clinical decision support, In
Journal of Biomedical Informatics, Volume 41, Issue
2, 387-392
Steimann, F. and Adlassnig, K.-P., 2000. Fuzzy Medical
Diagnosis. Online available: http://www.
citeseer.nj.nec.com/160 037.html.
Stutz, J. & P. Cheeseman, 1994. "A Short Exposition on
Bayesian Inference and Probability.", National
Aeronautic and Space Administration Ames Research
Centre: Computational Sciences Division, Data
Learning Group.
Winkler, Robert L., 1972. An Introduction to Bayesian
Inference and Decision. Holt, Rinehart and Winston,
Onc., Toronto.
Zarikas, Vasilios, Papageorgiou E., Regner, P., “Bayesian
network construction using a fuzzy-rule based
approach for medical decision support”, Expert
Systems, Volume 32, Issue 3, 1 June 2015, Pages 344-
369.
Medical Decision Support Tool from a Fuzzy-Rules Driven Bayesian Network
549
