
Development of Mid-IR Fiber Bundle for Thermal Imaging
Andrea Ventura, Joris Lousteau, Fedia Ben Slimen, Nicholas White and Francesco Poletti
Optoelectronics Research Centre, University of Southampton, Southampton, SO17 1TW, U.K.
Keywords: Thermal Imaging, Infrared Fibers, Coherent Bundle, Modelling.
Abstract: We present and discuss the fabrication and characterization of a Mid-Infrared (Mid-IR) transparent flexible
bundle based on 1200 fibers whose cores consist of a Ge
30
As
13
Se
32
Te
25
chalcogenide glass and the cladding
of a Fluorinated Ethylene Propylene (FEP). The Mid-IR fiber bundle was manufactured using the stack and
draw method. The high index contrast between the glass and the cladding allows for strong field confinement
of the well guided modes within the chalcogenide glass core transparent across the Mid-IR. Higher order
modes, which could be prone to cross talk, suffered high losses thanks to the high attenuation offered by the
polymer cladding. Additionally, the FEP cladding confers the bundle mechanical flexibility. Following a
qualitative thermal imaging assessment, we also present and discuss the experimental loss measurements of
the fiber bundle and we compare them to values obtained through modelling to conclude on the potential
prospect of the manufactured bundle and its possible improvements.
1 INTRODUCTION
Over the last two decades, Mid-IR detector
technology and other Mid-IR optical components
such as lens and material have undergone significant
development and improvement in terms of
performance and reliability. Thermal imaging is now
slowly becoming a standard inspection technique in
fields such as defence, security, industrial processes,
medical and physiological activities monitoring.
Thermal imaging relies on the detection of infrared
radiation (IR) emitted by any physical body held at a
temperature above 0 K. Mid-IR detectors based either
on InSb technology or on the Microbolometer
detectors offer high sensitivity/detectivity in the Mid-
IR region (1-5.5 µm) and in the wavelength range
between 8-14 µm, respectively (Infrared Detectors,
2017). In some cases the main restriction to a
widespread use of thermal imaging is the lack of a
flexible imaging bundle for the inspection of remote
access area or purely for its practicality and
convenience. Although a boroscope approach is
achievable, a Mid-IR transmitting coherent fiber
bundle is the most adapted solution thanks to its
flexibility. “Coherent” fiber bundle consists in arrays
of optical fibers where each fiber represents a pixel,
where “coherent” implies a direct pixel matching
between the bundle ends. If compared to boroscope
approach the fiber bundle is insensitive to vibrations
due to the absence of moving optics and allows to
change the viewing angle quickly. Despite its
technological importance there are currently no
infrared high resolution fiber bundles commercially
available. In order to realise a coherent fiber bundle
that operates in the Mid-IR region, both the bundle
material and the bundle structure play an important
role. Numerous attempts were made to develop such
device (Rave, 2000; Gopal, 2004; Zhang, 2015;
Chenard, 2017; Nishii, 1991). These works involved
different Mid-IR transmitting materials and hollow
core fiber structure. Perhaps the most significant
work reported in terms of performances is that of
Nishii et al. (1991). Although, the final bundle
appears to be bulky and not fully coherent, Nishii et
al. (1991) demonstrated a high spatial resolution
bundle for temperatures low as 25 ºC. The objective
of this work is to develop a coherent fiber bundle a
few meters long with low loss, high spatial resolution
and efficient for temperatures between 20 and 200 °C.
As mentioned before, in the literature different Mid-
IR fiber bundles have been reported, but they still
have limitations such as size, resolution, high losses
and flexibility. We present the fabrication of a
coherent Mid-IR fiber bundle whereby by exploiting
a pertinent choice of materials we aimed at reducing
the pixel and the pitch dimensions without inducing a
severe crosstalk.
Ventura, A., Lousteau, J., Slimen, F., White, N. and Poletti, F.
Development of Mid-IR Fiber Bundle for Thermal Imaging.
DOI: 10.5220/0006639502590265
In Proceedings of the 6th International Conference on Photonics, Optics and Laser Technology (PHOTOPTICS 2018), pages 259-265
ISBN: 978-989-758-286-8
Copyright © 2018 by SCITEPRESS – Science and Technology Publications, Lda. All rights reserved
259
2 BUNDLE FABRICATION AND
CHARACTERIZATION
We designed and chose the materials for
manufacturing the Mid-IR transmitting bundle
according to the following general guideline. The
core material must have:
• Transparency in the Mid-IR region (2-20
µm)
• High refractive index
• Low losses
Some advantages for the bundle fabrication could be
obtained using a cladding material with features such
as:
• Low refractive index
• High optical attenuations across the Mid-IR
• Low Young modulus
The high optical attenuations of the cladding material
allow to minimize the cross talk between individual
cores while its low Young modulus provides
flexibility to the overall structure. Furthermore, the
high index contrast between the core and the cladding
allows for a strong electromagnetic field confinement
inside the low loss core. This strategy ensures
practical Mid-IR transmission of low order optical
modes for thermal imaging. The materials used in the
present work have these characteristics. In fact, the
core and the cladding materials were in chalcogenide
Vitron IG3 glass and FEP polymer respectively.
2.1 Core Material: Chalcogenide
Vitron IG3
As core material we chose the chalcogenide Vitron
IG3 glass Ge
30
As
13
Se
32
Te
25
which is a commercial IR
transmitting glass provided by Vitron (Schott). This
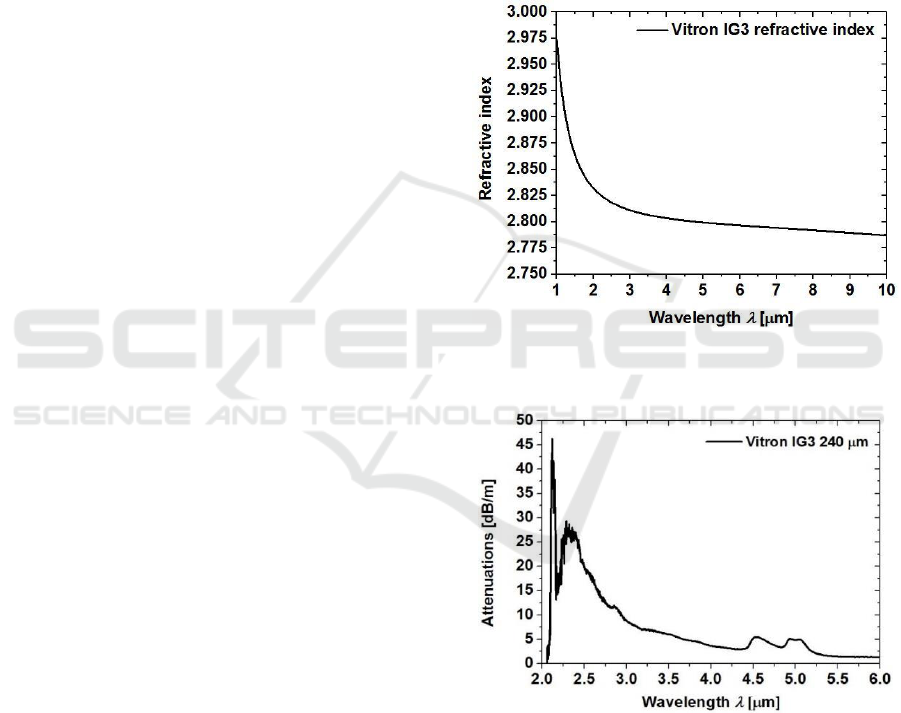
glass has large transmission spectrum (2 - 12 µm),
high refractive index (2.832 at 2 µm) and it is
thermally stable. The refractive index n of Vitron IG3
glass as a function of wavelength is shown in Figure
1 (Vitron IG3, 2014). Vitron IG3 glass exhibits a
glass transition temperature (Tg) at approximately
275 °C (Vitron IG3, 2014). In order to measure the
Vitron IG3 glass attenuations the cut-back method
was applied on an uncladded Vitron IG3 glass fiber
of 240 µm of diameter. The uncladded Vitron IG3
glass fiber was obtained by drawing a Vitron IG3
glass rod of 12 mm of diameter. 39 transmission
measurements were done and each cut was of 10 cm.
The transmission of the uncladded Vitron IG3 glass
fiber was measured by using the ARCoptix Mid-IR
FTIR spectrometer. It has a Mercury Cadmium
Tellurite (MCT) detector that covers a wavelength
range between 2 and 6 µm (ARCoptix FT-IR Rocket
data sheet, 2015). The Thorlabs SLS202L tungsten
light source (wavelength range: 450 to 5500 nm) that
emits IR light was used. Its emission is similar to a
black body radiator at 1900 K (Stabilized Tungsten
Light Sources, 2017). By using FC/PC connectors,
one of the two ends of the fiber was connected to the
Thorlabs SLS202L tungsten light source whereas the
other end of the fiber was connected to the FTIR
spectrometer. The uncladded Vitron IG3 glass fiber
attenuations in dB/m measured using FTIR
spectrometer are shown in Figure 2.
Figure 1: Refractive index of Vitron IG3 glass at different
wavelengths provided by Vitron (Vitron IG3, 2014).
Figure 2: Vitron IG3 glass attenuations measured using
FTIR spectrometer on an uncladded fiber of 240 µm of
diameter.
According to Snopatin et al. (2009), the functional
groups [OH]
-
and GeH absorb at 2.92 and 4.95 µm
respectively. The bands that appear at 2.32 and 4.52
µm are attributed to SeH bond vibration (Snopatin,
2009). As the wavelength increases, the attenuations
decrease (Figure 2); the uncladded Vitron IG3 glass
PHOTOPTICS 2018 - 6th International Conference on Photonics, Optics and Laser Technology
260
fiber displays typical loss values of 5 dB/m for
wavelength ranging from 3 to 6 µm. Between 2 and 3
µm the uncladded fiber presents loss higher than 10
dB/m.
2.2 Cladding Material: Fluorinated
Ethylene Propylene (FEP)
As cladding material, we chose the FEP polymer. It
has similar chemical and electrical properties as the
Teflon PTFE, however it is thermoplastic; the latter
property allows to draw it into a fiber, while its low
Young modulus allows to realise flexible fibers or
bundles. Moreover, FEP polymer has a low refractive
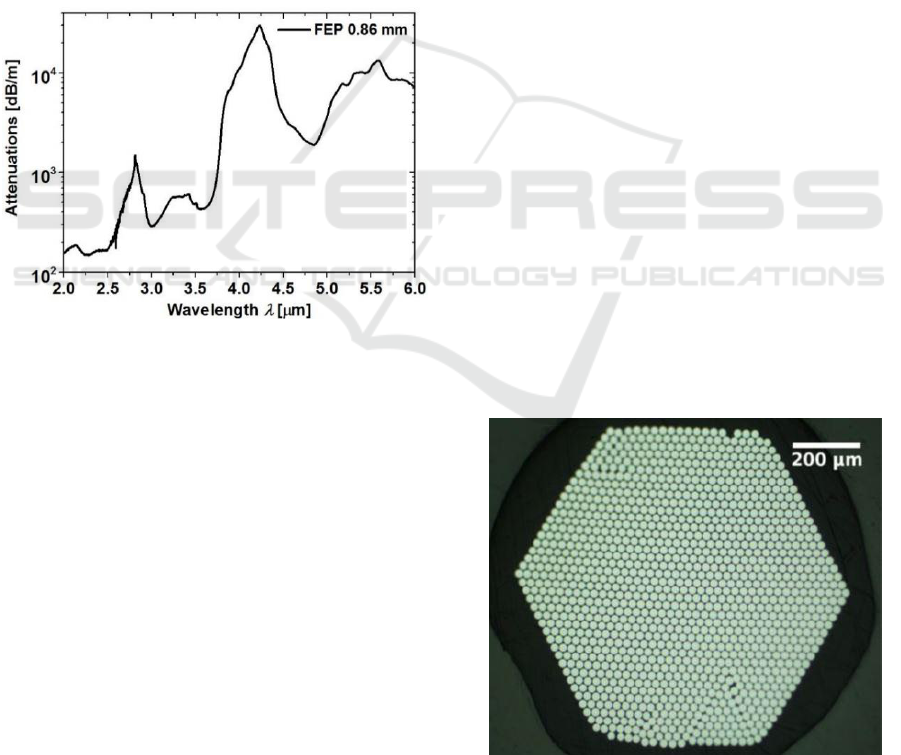
index (n=1.341) (FEP Handbook). Figure 3 shows the
FEP polymer attenuations in dB/m unit measured on
a 0.86 mm thick sample using a Varian 670 FTIR
spectrometer.
Figure 3: FEP attenuations measured using FTIR
spectrometer on a sample 0.86 mm thick.
From Figure 3 it is possible to notice that the FEP
polymer optical losses are high, tipically above 1000
dB/m in the wavelength range between 4 and 6 µm.
According to Galante et al. (2010), the absorption at
4.23 µm is due to the CF2 and the band at 5.57 µm is
due to terminal double bonds –CF=CF2 in the
polymer chain.
2.3 Bundle Fabrication
A chalcogenide bundle with 1200 fibers was
manufactured by using the stack and draw technique.
The fibers were made with Vitron glass IG3 core and
FEP polymer cladding. A Vitron IG3 glass preform
of 12 mm of diameter was inserted in FEP polymer
tube with external diameter equal to 14 mm and then
placed into the drawing tower furnace under dried Ar
atmosphere. Approximately 170 meters of fibers of
300 ± 8 µm in diameter were drawn at a speed of 2.1
m/min. This substantially high diameter variation is
attributed to bubbles in the FEP polymer cladding.
The Vitron IG3 glass appears to be crystal free and
pristine. After the fiber fabrication, a stack of 1200
fiber sections, 120 mm long each, was realised and
then it was inserted in an additional FEP tube with
external diameter equal to 14 mm. This preform was
drawn into two different fiber bundles of 1.1 and
0.675 mm of outer diameter, corresponding to
individual core diameter of 22 µm and 13 µm,
respectively. The overall yield was about 6 meters in
length. Following fabrication, the fiber bundle was
cut into sections of various lengths, ranging from 95
cm to 123.5 cm, to be characterized individually.
Thermal images of a heating element were performed
by using the fiber bundles and their attenuations were
measured.
2.4 Bundle Characterization
In order to optimize the signal transmission, the ends
of the fiber had first to be polished. This was achieved
using a special jig designed in-house. The polishing
procedure was carried out using a Logitech PM5
machine. Figures 4 and 5 show the optical
micrographs of polished bundles of 22 µm and 13 µm
in core diameter by using a Nikon Eclipse
microscope. Overall, in the bundle structure the fibers
are orderly stacked as in the original preform. A few
pixels are missing or slightly out of position but
further improvements are readily achievable by
further increasing the density of the original preform.
Qualitative thermal imaging assessments were
carried out with a 1.15 m long Vitron IG3 fiber
bundle, as follows.
Figure 4: Vitron IG3 fiber bundle 22 µm core micrography
(10X).
Development of Mid-IR Fiber Bundle for Thermal Imaging
261
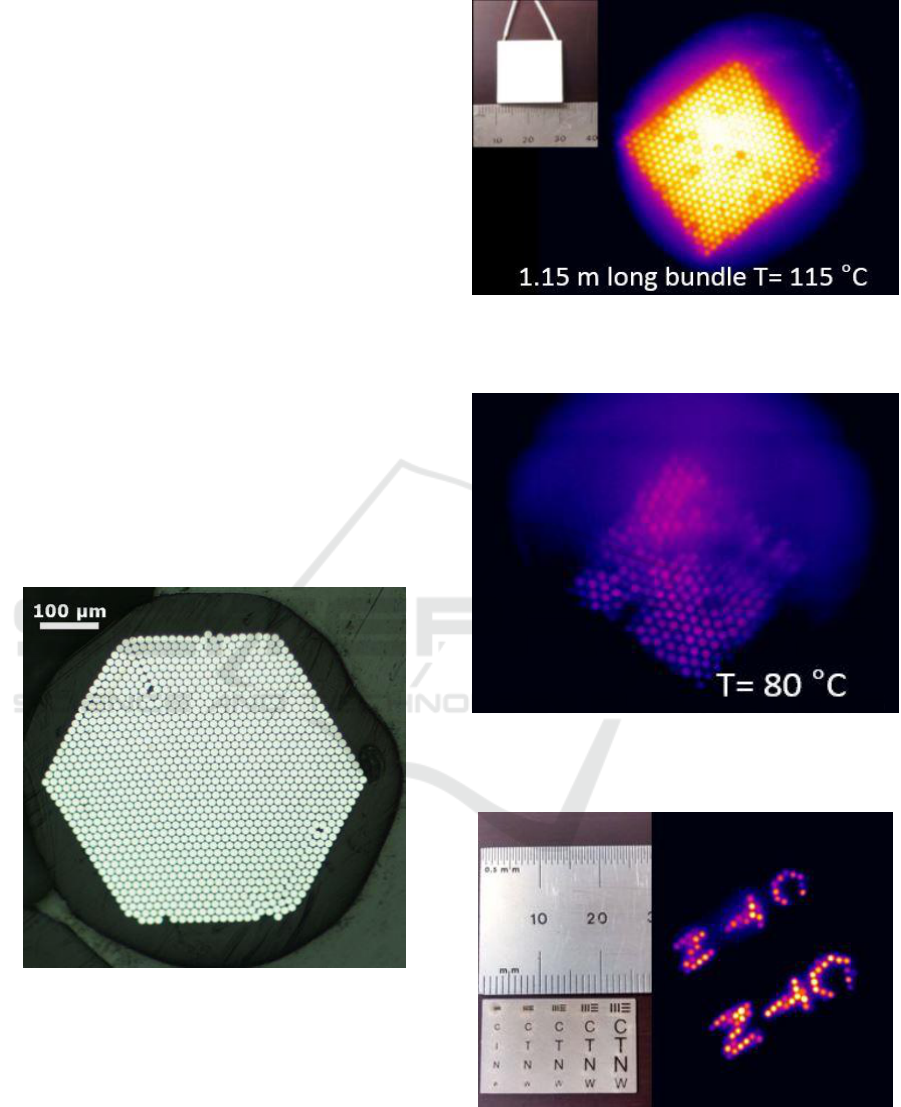
A rectangular heating element, shown in the inset of
Figure 6 was imaged on the input of the Vitron IG3
fiber bundle. Then, the output of the fiber bundle was
imaged by using a thermal camera Xenics Onca-
MWIR with InSb detector, which operates in a selected
wavelength range between 3.6 and 4.9 µm due to a
filter. The images were focused by using chalcogenide
lenses with antireflection coating. Figure 6 shows that
for a heater temperature T= 115 °C the fiber bundle
1.15 m long transmits the infrared radiation. As one
can see on the heating element image, the edges are
sharp and well defined. Figure 7 shows that the
minimum heater temperature for which we could
obtained a clear image is for T = 80 °C. In fact, in
order to transmit infrared radiation for a heater
temperature lower than 80 °C the bundle attenuations
must be decreased by purifying or by changing the
core material. A metal target with inscribed letters
was placed between the heating element and the input
of the bundle in order to investigate the bundle
resolution (Figure 8); the image shows that the
resolution of the bundle is not yet satisfactory as some
of the letters are not well transmitted and do not appear
clearly. For this reason, in a future fabrication the
resolution will be increased from 1200 to 3600 pixels.
Figure 5: Vitron IG3 fiber bundle 13 µm core micrography
(10X).
The Vitron IG3 fiber bundle attenuations were
measured using the cut-back method. 4 transmission
spectra were measured by using the ARCoptix Mid-
IR FTIR spectrometer and each cut was of 20 cm.
Two different core diameters were investigated. For
each core diameter two sets of cut-back
measurements were carried out on to two distinct
bundle lengths, respectively in order to analyse the
reproducibility of the measurements (Table 1).
Figure 6: Thermal images of the heating element shown in
the insert and held at T=115°C by using a chalcogenide
bundle of 1.1 mm of outer diameter.
Figure 7: Thermal images of the heating element held at
T=80°C by using a chalcogenide bundle of 1.1 mm of outer
diameter.
Figure 8: Thermal images of the heating element by using
the metal target with inscribed letters shown in the indent
to investigate the bundle resolution.
In the present work the 22 µm core bundles labelled
bundle 1 and bundle 2 in Table 1 and the 13 µm core
PHOTOPTICS 2018 - 6th International Conference on Photonics, Optics and Laser Technology
262

bundles labelled bundle 3 and bundle 4 in Table 1
were compared in terms of attenuations. The Vitron
IG3 fiber bundle losses calculated from the cut-back
measurements are plotted in Figures 9-10.
Table 1: The bundle label and its corresponding core
diameter.
Bundle
Core diameter
[µm]
Initial length
[cm]
1
22
123.5
2
22
100.5
3
13
101
4
13
95
Figure 9: Attenuation of bundle 1 (black curve) and
attenuation of bundle 2 (red curve).
Figure 10: Attenuation of bundle 3 (blue curve) and
attenuation of bundle 4 (green curve).
The attenuations for the Vitron IG3 fiber bundles of
equal diameter are not the same. This is due to an
error in the losses measurements induced from the
polishing quality and from the bundle coupling with
the tungsten light source and the FTIR spectrometer.
This error is ±1 dB/m. A FTIR spectrum was
calculated by averaging spectra of bundles with the
same diameters. Figure 11 reports the losses of the
Vitron IG3 uncladded fiber and the mean from a
series of two spectra at 22 µm and 13 µm core
diameter. The fiber bundle with 13 µm core diameter
presents two more pronounced peaks: at λ = 4.23 µm
due to the CF2 absorption in the FEP and at λ = 5.57
µm due to terminal double bonds CF=CF2 in the FEP
chain (Galante, 2010).
Figure 11: Bundles (orange and green curves) and Vitron
IG3 glass uncladded fiber (violet curve) losses.
It is clear that the bundle losses are higher than the
Vitron IG3 glass uncladded fiber due to the high
cladding attenuations. The bundle losses are of the
order of 10 dB/m in the wavelength range between 3
and 6 µm. This loss value is high but still compatible
with meter length applications. In the wavelength
range between 2 and 3 µm the fiber bundle presents
higher attenuations. The peak at a wavelength of λ =
2.32 µm in the IG3 uncladded fiber attenuation
spectrum is more pronounced than for the bundle
spectra; this could be related to an impurity
absorption from the uncladded fiber that is
unprotected because it has no cladding. In Figure 11
it is shown that the attenuations of the two bundles
(13 µm and 22 µm) are almost comparable. These
results gives us some information for future work; the
Vitron IG3 fiber bundle has high attenuations (10
dB/m) in fact it will be useful to use a chalcogenide
glass with lower losses for future bundle fabrication
to decrease the overall attenuations. The effect of the
fiber diameter on the fiber attenuations was also
investigated with a modelling study.
Development of Mid-IR Fiber Bundle for Thermal Imaging
263

3 MODELLING OF OPTICAL
FIBERS
The modelling study has been performed by using
Comsol Multiphysics 5.2, which is a software for
modelling and simulating Multiphysics problems
(COMSOL Multiphysics, 2017). Comsol
Multiphysics is based on the Finite Element Method
(FEM) (Rahman, 2013).
3.1 Modelling
The study of the modes propagation in an optical fiber
made of Vitron IG3 glass core and FEP polymer
cladding was performed by using the Finite Element
Method (FEM). Five different scenarios were
investigated by changing the core diameter to the
following values: 9, 13, 15, 19 and 25 µm. The
attenuation effects in dB/m across every single fiber
were calculated from the imaginary part of the
complex propagation constant. The cladding diameter
was fixed to 40 µm. A Perfectly Matched Layer
(PML) was applied to the fiber geometry to avoid any
reflection of the electric and magnetic fields
(Berenger, 1994). In Comsol, the PML diameter was
fixed at 60 µm and its parameters, i.e. the scaling
factor and the curvature parameter, were set to 4 and
2 respectively. The fiber model was studied for three
different wavelengths: 3 µm, 4 µm and 5 µm. The real
part of the complex refractive index n of the Vitron
IG3 glass was loaded from the Comsol material
library and its behaviour is shown in Figure 1. The
extinction coefficient k of the Vitron IG3 glass was
calculated from the FTIR loss measurements (Figure
2). For what concerns FEP polymer cladding
material, the real part of the refractive index (n) was
set to 1.341. The extinction coefficient k of the FEP
polymer was calculated from the FTIR loss
measurements (Figure 3). A mesh with 55028
elements was used for this model. Considering the
range of temperature of interest and the sensitivity of
the thermal camera, an arbitrary loss value of 20
dB/m was considered. As first approximation, the
overall losses of the Vitron IG3 glass core and FEP
polymer cladding fiber were calculated from the
average attenuations of the modes that have losses
less than 20 dB/m. Figure 12 shows the results
obtained, where it is clear that the fiber losses
simulated decrease when increasing the core
diameter. The modelling study show that the loss
difference between bundles of 13 and 25 µm core
diameter is of the order of 1 dB/m. This observation
suggests that it should be possible to develop a fiber
bundle with an even smaller core size, without a
substantial increase in loss. The difference in terms of
attenuations between the FEM simulations and the
experimental results are due to two approximations.
Firstly, for the modelled loss calculation we have
considered the average attenuations of the modes that
have losses less than 20 dB/m. Secondly, the bundle
coupling with the tungsten lamp and FTIR
spectrometer as well as the polishing quality
influence the experimental results, with an error of ±1
dB/m on the measurements. In order to improve the
losses calculation in the modelling study, a method
that takes into account the individual mode profile is
undergoing.
Figure 12: Average losses at different core diameters
calculated by using Comsol Multiphysics: core diameter
equal to 9 µm (black curve), core diameter equal to 13 µm
(blue curve), core diameter equal to 15 µm (red curve), core
diameter equal to 19 µm (green curve) and core diameter
equal to 25 µm (violet curve).
4 CONCLUSIONS
The stack and draw method was applied to achieve
two flexible coherent Mid-IR chalcogenide bundles
of 1.1 and 0.675 mm of diameter. The Vitron IG3
fiber bundle attenuations were measured using the
cut-back method. The results obtained from this study
have highlighted that the Vitron IG3 fiber bundle
presents high losses (10 dB/m), but its structure is
regular and the pixels are orderly stacked. The
attenuations measured for the different core diameters
(13 and 22 µm) were comparable. Thermal images
show that a 1.15 m long bundle allows thermal
imaging of objects at temperature higher than 80 °C.
In fact, for a target at temperature equal to 115 °C the
Vitron IG3 bundle (1.15 m long) transmits well the
IR radiation and the target contours are well defined
PHOTOPTICS 2018 - 6th International Conference on Photonics, Optics and Laser Technology
264

and sharp. The behaviour of a chalcogenide fiber
losses for different diameters was simulated by using
the FEM. Results obtained from the modelling study
also give an indication of the influence of the core size
in the fiber attenuations. The typical difference
between the loss of the 13 and 25 µm core diameter
fiber is only of 1 dB/m. This opens the possibility to
achieve a new chalcogenide fiber bundle with even
smaller core diameter and without substantial
increase in optical losses. It is then possible to include
a higher number of pixels (from 1200 to 3600) while
maintaining the bundle outer diameter small enough
to ensure mechanical flexibility, which will be the
focus of the future work.
REFERENCES
ARCoptix FT-IR Rocket data sheet, 2015. Available at:
http://www.arcoptix.com/pdf/Data%20Sheet%20-%20
Arcoptix%20FTIR%20Rocket.pdf (Accessed: 13
February 2017).
Berenger J.P., 1994. A Perfectly Matched Layer for the
Absorption of Electromagnetic Waves, Journal Of
Computational Physics 114, pp. 185-200.
Chenard, F., Alvarez, O., D. Gibson, D., Brandon Shaw, L.,
Sanghera, J., 2017. Mid-Infrared Imaging Fiber
Bundle, SPIE 10181, (2017).
COMSOL Multiphysics, 2017. Avilable at: https://www.
comsol.com/comsol-multiphysics (Accessed: 11 April
2017).
FEP Handbook. Available at: http://www.rjchase.com/
fep\_handbook.pdf, (Accessed: 19 Dicember 2016).
Galante, A.M.S., Galante, O.L., Campos, L.L., 2010. Study
on application of PTFE, FEP and PFA fluoropolymers
on radiation dosimetry, Nuclear Instruments and
Methods in Physics Research 619, pp. 177-180.
Gopal, V., Goren, A., Gannot, I., 2004. Coherent hollow-
core waveguide bundles for infrared imaging, Opt.
Eng. 5 (43), pp. 1195-1199.
Infrared Detectors, 2017. Available at: http://www.
hamamatsu.com/resources/pdf/ssd/infrared_kird0001e.
pdf (Accessed: 10 May 2017).
Nishii, J., Yamashita, T., Yamagishi, T., Tanaka, C., Sone,
H., 1991. Coherent infrared fiber image bundle,
Applied physics letters 59 (21), pp. 2639-2641.
Rahman, B. M., Agrawal, A., 2013. Finite Elements
Modeling Methods for Photonics, Artech house.
Rave, E., Nagli, L., Katzir, A., 2000. Ordered bundles of
infrared-transmitting AgClBr fibers: optical
characterization of individual fibers, Optics Letters 25
(17), pp. 1237-1239.
Snopatin, G.E., Shiryaev, V.S., Plotnichenko, V.G.,
Dianov, E.M., Churbanov, M.F., 2009. High-Purity
Chalcogenide Glasses for Fiber Optics, Inorganic
Materials 45 (13), pp. 1439-1460.
Thorlabs. Stabilized Tungsten Light Sources, 2017.
Available at: https://www.thorlabs.de/drawings/b291
d2ea04f972b3-2DD86186-AF3B-B06B-E3D8818282
5A3929/SLS201L_M-Manual.pdf (Accessed: 2 June
2017).
Vitron IG3, 2014. Available at: http://www.vitron.de/
datasheets/VITRON\%20IG-3\%20Datenblatt\%20Ju
ni\%202014\%20.pdf (Accessed: 19 Dicember 2016).
Zhang, B., Zhai, C., Qi, S., Guo, W., Yang, Z., Yang, A.,
Gai, X., Yu, Y., Wang, R., Tang, D., Tao, G., Luther-
Davies, B., 2015. High-resolution chalcogenide fiber
bundles for infrared imaging, Optics Letters 40 (19),
pp. 4384-4387.
Development of Mid-IR Fiber Bundle for Thermal Imaging
265
