
A Low Cost Solution for NOAA Remote Sensing
Edoardo Ardizzone, Alessandro Bruno, Francesco Gugliuzza and Roberto Pirrone
Dipartimento dell’Innovazione Industriale e Digitale (DIID), Universit
`
a degli Studi di Palermo,
Viale delle Scienze Ed. 6 - 90128 Palermo (PA), Italy
Keywords:
Remote Sensing, Satellite Communication, Signal Processing.
Abstract:
United States National Oceanic and Atmospheric Administration (NOAA) weather satellites adopt Advanced
Very High Resolution Radiometer (AVHRR) sensors to acquire remote sensing data and broadcast Automatic
Picture Transmission (APT) images. The orientation of the scan lines is perpendicular to the orbit of the
satellite. In this paper we propose a new low cost solution for NOAA remote sensing. More in detail, our
method focuses on the possibility of directly sampling the modulated signal and processing it entirely in
software enabled by recent breakthroughs on Software Defined Radios (SDR) and CPU computational speed,
while keeping the costs extremely low. We aim to achieve good results with inexpensive SDR hardware, like
the RTL-SDR (a repurposed DVB-T USB dongle). Nevertheless, we faced some problems caused by hardware
limits such as high receiver noise figure and low ADC resolution. Furthermore, we detected several inherent
drawbacks of frequent tuner saturations. For this purpose we developed a software-hardware integrated system
able to perform the following steps: satellite pass prediction, time scheduling, signal demodulation, image
cropping and filtering. Although we employed low cost components, we obtained good results in terms of
signal demodulation, synchronization and image reconstruction.
1 INTRODUCTION
Airborne and satellite sensors allow us to analyze a
huge amount of data used for many tasks such as
signal and image processing for GIS applications,
weather and storm predictive analysis, earth obser-
vation and more generally, remote sensing. Every-
day several United States National Oceanic and At-
mospheric Administration (NOAA) weather satellites
pass over us: each NOAA weather satellite broadcasts
an Automatic Picture Transmission signal, which
contains a live weather image of the area overflown
by the satellite. The satellite scanner systems in-
clude line scanning devices observing the earth per-
pendicular to the orbital plane. The signal mea-
surements are performed in different spectral bands
thanks to the Advanced Very High Resolution Ra-
diometer (AVHRR) instrument. The visible light and
the infrared images are combined in a row vector;
the combination is done using the Automatic Picture
Transmission (APT) system.
Although many scientific progresses have been
made, there are still many open scientific challenges
for NOAA satellites, such as information calibration
or the physical layer (synchronization, data detection,
channel codec). Many satellite-based platforms are
dedicated to remote sensing data analysis for weather
prediction as well as for climatological studies. In
this paper we present a new easily accessible satellite
based platform for signal processing, installed in our
lab: the platform consists of a low cost receiver sub-
system for public weather satellites and a signal pro-
cessing subsystem for different applications (image
reconstruction, image enhancement and clouds seg-
mentation). The rest of the paper is organized as it
follows: in section 2 we describe the state of the art
methods for satellite signals modulation and imagery,
in section 3 we show in greater detail our proposed
platform for the reception of NOAA signals, in sec-
tion 4 we show the experimental results for the recon-
structed images and the section 5 ends the paper with
conclusions and future works.
2 STATE OF THE ART
In this section we give a description of the state of
the art of the techniques for the demodulation of sig-
nals coming from NOAA satellites. Furthermore, a
brief overview of the image processing techniques for
clouds detection is given.
128
Ardizzone, E., Bruno, A., Gugliuzza, F. and Pirrone, R.
A Low Cost Solution for NOAA Remote Sensing.
DOI: 10.5220/0006639101280134
In Proceedings of the 7th International Conference on Sensor Networks (SENSORNETS 2018), pages 128-134
ISBN: 978-989-758-284-4
Copyright © 2018 by SCITEPRESS – Science and Technology Publications, Lda. All rights reserved

2.1 Satellite Communications and
Signals Reception
Artificial satellite development was originally fuelled
by the need for superpowers to show their ”status”
to their opponents, during the Space Race. After
a few years, however, it became clear that satel-
lites could be used to establish a reliable communi-
cation infrastructure or for remote sensing. In the
last decades many communications satellites were
launched into space: some of them are equipped with
low bandwidth communication systems (VHF/UHF),
while some others are equipped with high bandwidth
communication systems (even more recently, commu-
nications are carried out by arrays of high bandwidth
microwave transponders, designed to offer multime-
dia services (Farserotu and Prasad, 2000)). Modern
satellites receive and transmit simultaneously thou-
sands of signals: hyperspectral cameras and radiome-
ters have been widely used to analyze Earth’s visi-
ble and infrared radiation directly from the spacecraft;
Synthetic Aperture Radars (SAR) have been used to
map surface features and texture, even through cloud
cover. The result is the possibility to analyze data like
vegetation moisture (to estimate wildfire risk) (Al-
Moustafa et al., 2012) or reconstruct 3D models of
confined zones of the Earth (recently even at 1-meter
resolution). Due to sensor nonlinearities, raw sen-
sor data can be affected by noise and distortions, and
needs to be corrected with classification or regression
methods (Camps-Valls et al., 2011).
The APT format used by NOAA satellites was
first introduced in the 1960s (Barnes and Smallwood,
1982) (Winston, 1997) and has been only slightly
modified since, so it’s no surprise that many sta-
tions still use analog-radio equipment designed in the
1980s or the 1990s. The APT signal is formed by am-
plitude modulating a 2400 Hz carrier with each line of
pixel data obtained by merging two images and cali-
bration data (see subsection 3.1), and then frequency
modulating the result; it is obvious that the ease of
building a basic receiver composed of a FM demodu-
lator followed by an AM demodulator and an analog-
digital converter has sparked the interest of many sci-
entists and amateur radio operators. However, re-
ceiving and demodulating signals coming from satel-
lites not placed in geostationary orbits presents many
challenges because the radio wave itself changes fre-
quency due to Doppler effects and free space attenu-
ation is not constant but, instead, varies with distance
from the satellite. Another problem is that due to
satellites’ variable rotation relative to Earth’s axis, lin-
early polarized antennas become unsuitable and cir-
cularly polarized antenna are required to ensure reli-
able and effective demodulation and synchronization,
as well as a good quality output image.
Image synchronization and calibration, unlike de-
modulation and frequency tracking, are usually per-
formed in software instead of hardware (Benabadji
et al., 2004) because they are non-real time tasks that
require some CPU power (mainly signal down sam-
pling, synchronization pulse convolution and line-by-
line pixel value processing); it is also important to say
that it would be somewhat challenging to implement
those tasks in hardware (at least for non-experts).
Sensor data can then be further corrected to compen-
sate small sensor alignment errors, orbit uncertainty
and on-board clock offset, by comparing expected and
measured emissivity over land and sea and binning re-
sults into a high-resolution grid (Moradi et al., 2013).
2.2 Clouds Segmentation
The accurate separation of clouds from lands in satel-
lite imagery is a critical step, due to the varying
conditions of surface properties, such as reflectance
and emissivity. Furthermore, the classification of
the cloud types from satellite imagery is useful for
weather research and forecast applications (forecast-
ing of meteorological phenomena) (Feidas et al.,
2000). Heidinger et al. in (Heidinger et al., 2012)
performed a naive Bayesian approach for cloud de-
tection. This kind of methodology has been used for
cloud detection on NOAA AVHRR data. Generally,
NOAA AVHRR sensors have coarser spatial resolu-
tion than most modern satellites. Some methods face
the problem of the enhancement of NOAA AVHRR
data (such as remote sensing images). In (Alkhatib
et al., 2012) the authors used region growing method
for dust clouds segmentation. In (Karlsson et al.,
2015) the authors examined two probabilistic meth-
ods for cloud masking of images from NOAA satel-
lites, obtained with Advanced Very High Resolution
Radiometer.
Simpson and Gobat in (Simpson and Gobat, 1996)
used AVHRR Split-and-Merge Clustering (ASMC)
for cloud detection to overcome the problem of vary-
ing land surface reflectance and emissivity. Split-and-
merge clustering allows to segment the scene in its
natural groupings and label them as cloud, cloud-free
land, uncertain. In (Yhann and Simpson, 1995) the
authors performed a supervised approach based on
neural networks for cloud screening of AVHRR data
over the ocean. In our work the signals coming from
NOAA satellites are demodulated, synchronized and
enhanced by using image processing techniques (see
section 4), then clouds detection is performed by us-
ing the Otsu’s method (Zhang and Hu, 2008).
A Low Cost Solution for NOAA Remote Sensing
129

3 PROPOSED METHOD
Our method focuses on the possibility of directly
sampling and processing of the modulated signal en-
tirely in software enabled by recent breakthroughs on
Software Defined Radios (SDR) and CPU computa-
tional speed. Our objective was achieving good re-
sults with inexpensive SDR hardware like RTL-SDR
(Sruthi et al., 2013) (a repurposed DVB-T USB don-
gle), high receiver noise figure and low ADC reso-
lution. We also dealt with the inherent drawbacks
caused by frequent tuner saturations. An integrated
hardware and software system is proposed to perform
satellite pass prediction, time scheduling, signal de-
modulation, image filtering.
3.1 APT Signal
The APT was introduced in 1960s and it shows its
age in some respects: it is a mixed modulation sig-
nal (AM+FM) carrying a completely analog payload.
The standard APT format consists of around 2080
pixels row, which is divided in two sub-rows of 909
pixels each belonging to two different sub-images (A
and B) and then padded with synchronization and di-
agnostic information words. Images A and B dur-
ing daytime are acquired in the visible range and in
the infrared range of the electromagnetic spectrum re-
spectively. At night-time, image A is replaced with
one acquired at an infrared wavelength different from
that of B. Rows can be grouped logically in frames of
128 lines each: a complete frame contains image cal-
ibration data and dynamic range references (wedges)
(Winston, 1997). The payload is used to amplitude
modulate a 2400 Hz carrier according to (1)
s(t) = [1 +m(t)] A cos(2π f
c
t) (1)
Where m(t) is the modulating signal, A the carrier’s
amplitude and f
c
the carrier’s frequency. The ampli-
tude modulated signal is then frequency modulated
with a frequency deviation of about 18-20 kHz and
transmitted in the 137 MHz band at about 5 W EIRP
(36.99 dBm) and 4160 sym/s symbol rate. Right
hand circularly polarized (RHCP) antennas transmit
the signal, so particular care had to be taken when
choosing which antenna type to use in the receiving
station.
3.2 Hardware
First of all we build a circularly polarized antenna:
the ”turnstile” crossed-dipoles design was chosen be-
cause of its simplicity and the good performance pro-
vided when placed over a ground plane. Ease of con-
struction, durability and suitability of common ma-
terials compensate the drawbacks of the system: the
medium gain offered (6 dBi) and many nulls present
in such a design (Griffiths, 2014). The antenna has
been built exclusively off PVC pipes, threaded bars
as dipole elements, nuts and bolts and 75 Ω generic
coaxial cable. The antenna is directly connected to a
repurposed old TV amplifier (SIEL .269 01), modified
to behave like a wide-bandwidth amplifier. The input
variable attenuator and high-pass filter have been re-
moved, and the RF output has been separated from
DC power path, allowing power without a bias tee.
The amplifier uses two active components:
• BFR90A - 16 dB gain, 1.8 dB NF
• BFR91A - 14 dB gain, 1.6 dB NF
The results are 30 dB gain and ~1.52 dB NF (cal-
culated using Friis’ formula (Promwong and Takada,
2004)). Ignoring noise introduced by amplifier’s pas-
sive components, and considering room temperature
of 290 K and 40 kHz bandwidth, the noise output of
the amplifier can be calculated with formula (2).
N
in
+ g + NF (2)
N
in
is the input noise (-127.95 dBm) calculated using
formula (3), g the gain (30 dB) and NF the total noise
figure (1.52 dB). The result is a noise output of -96.43
dBm.
10log
10
(kT B) + 30 (3)
k is Boltzmann constant, T is absolute temperature
and B is signal bandwidth, while +30 has been added
to convert results from dBW to dBm. Considering
NOAA satellites transmit at 5 W EIRP, when they are
at receiving station’s zenith the signal power at the
receiver’s input can be calculated as follows
36.99 dBm - 133.34 dB + 6 dBi - 3 dB + 30 dB =
= -63.35 dBm
(4)
133.34 dB is free space loss and 3 dB is the estimated
loss due to cable and connectors. Output SNR in best-
case conditions is then 33.08 dB, more than enough to
ensure good image quality. The amplifier’s output is
connected to a SAW filter (Tai-Saw TA1581A) cen-
tered on 137.5 MHz to attenuate out-of-band signals
and reduce the severe distortion caused by high-power
FM broadcast stations and GSM signals. The TA1581
is a 50 Ω device, but an impedance matching circuit
has not been installed because of the low mismatch
loss (0.177 dB from antenna to filter and another
0.177 dB from filter to next RF device, which has 75
Ω impedance) compared to filter’s 3.5 dB insertion
loss. We added a standard ferrite bead near the re-
ceiver to shield common-mode interference caused by
SENSORNETS 2018 - 7th International Conference on Sensor Networks
130

high-frequency equipment (PC, lab instruments, elec-
tronic ballasted lamps, etc.). The SDR hardware is
widely available at a very low cost and is built around
two chips: a RF tuner and an ADC/COFDM demod-
ulator combo chip. The first used to be an Elonics
E4000 (zero-IF), but has been replaced on new mod-
els with two superheterodyne alternatives, the Rafael
Micro R820T and R820T2. The demodulator chip,
a Realtek RTL2832U, is commonly used to demodu-
late the QPSK or QAM DVB-T signal into a MPEG
stream and send it to a PC via an USB interface, but
has a hidden passthrough mode which allows passing
the ADC sample stream instead. The samples are in-
ternally filtered by a 32 coefficients FIR filter. For this
study a dongle containing an E4000 tuner has been
used.
3.3 Software
Managing tuner’s and RTL2832U’s hardware regis-
ters is not an easy task, and it has been hindered by
the lack of a public datasheet for the Realtek chip, but
the RTL-SDR team has coded a very efficient open
source C library which abstracts from hardware diffi-
culties (Osmocom, 2012), allowing developers to tune
the receiver and get ADC samples with few function
calls. Thanks to the Mathworks RTL-SDR library
we focused on the development of DSP algorithms
on Simulink (Sergienko, 2014), taking advantage of
its model-to-code conversion functionality. The FM
demodulation was initially delegated to Kyle Keen’s
rtl fm (Keen, 2013) software, but it was plagued by
frequent saturation problems. It was then decided to
implement a simple FM demodulation algorithm di-
rectly in the Simulink model. The software devel-
oped consists of the following parts: satellite pass pre-
dictor, digital down-converter, FM demodulator, FIR
low-pass filter, AM demodulators, synchronization
block, pixel dynamic range calibration block, model’s
parameters generator.
3.3.1 Satellite Pass Predictor
The first step in obtaining a completely automatic
system was to develop a method to automatically
schedule the appropriate start time for the receiv-
ing/demodulating software. John Magliacane’s PRE-
DICT (Magliacane, 2001) software has been used to
predict start/end times and maximum elevations of
the next satellite passes. This software supports com-
mand line parameters and text output, enabling the ex-
ecution of a script for multiple pass predictions. PRE-
DICT’s output is processed in order to make it com-
patible with Microsoft Windows schtasks.exe syntax,
but it can be easily modified to use Linux/UNIX cron
instead.
3.3.2 RTL-SDR Library for Simulink
The library used in this work includes the DLL files
for hardware-software communication, the required
precompiled code to interface them with MATLAB
and a source block that has to be added to Simulink
models.
3.3.3 Digital Down-converter
It was necessary to overcome the DC offset issue
caused by the Zero-IF tuner architecture, so we de-
signed and implemented an offset tuning mechanism.
The RTL-SDR is tuned 500 kHz lower than the target
frequency, and a Simulink block performs a circular
frequency shift to shift the desired signal back to base-
band using (5).
e
− jΩ
0
n
= e
− j2π f
0
n
f
s
(5)
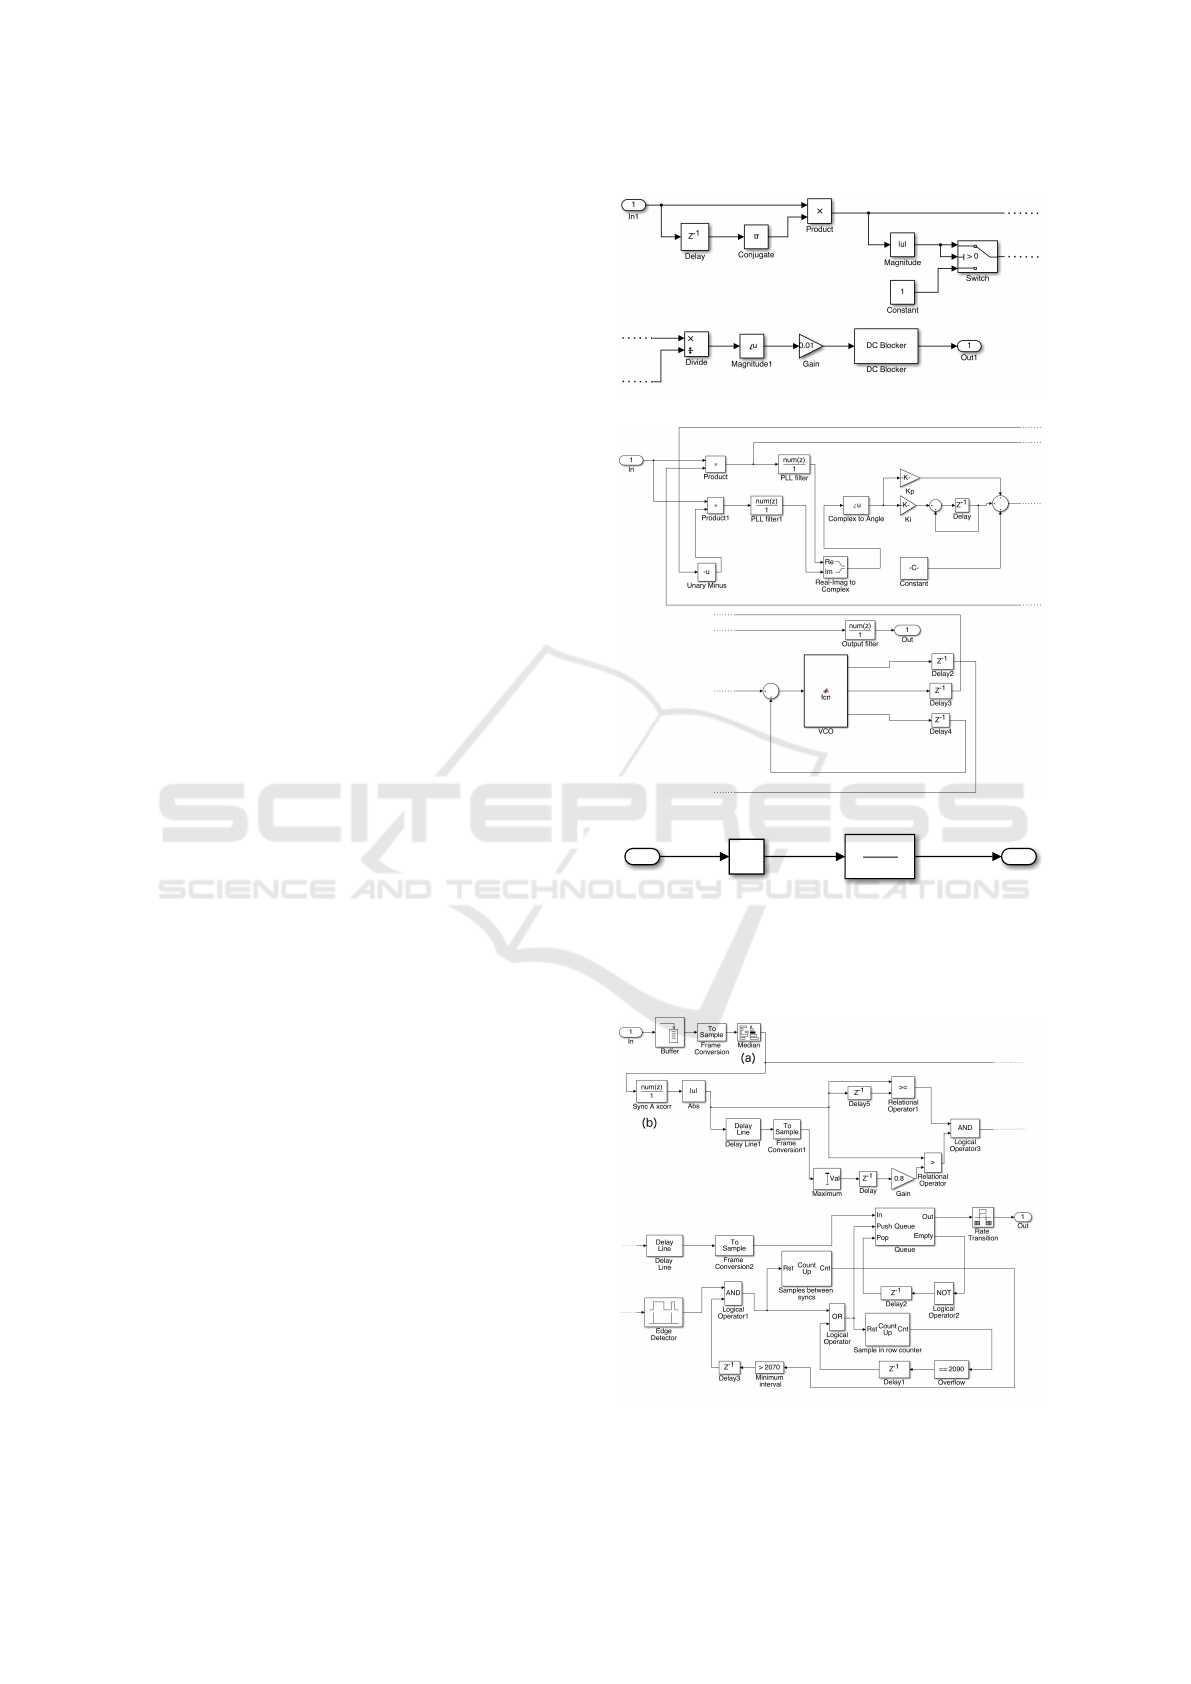
3.3.4 FM Demodulator
There are many examples of DSP FM demodulators
in literature, some of which use the computation-
ally expensive arctangent function. Experimental test
showed that the non-CPU intensive demodulator pre-
sented in (Lyons, 2004) (capable of scaling the output
signal according to input modulus amplitude) was in-
appropriate as it caused uncontrolled phase shift in the
demodulated output, preventing correct APT format
decoding. Therefore an arctangent-based demodula-
tor (Shima, 1995) was chosen (equipped with a signal
scaler), as shown in Fig. 1.
3.3.5 Low-Pass FIR Filter
A linear phase FIR filter designed using a Kaiser win-
dow has been added to the Simulink model in order to
attenuate noise present in the FM demodulator output.
Its optimal cutoff frequency (5000 Hz) has been found
experimentally and varies with hardware receiver and
FM demodulation algorithm characteristics.
3.3.6 AM Demodulators
We developed two DSP AM demodulators (Fig. 1):
the first is based on a discrete-time PLL followed by
a low-pass filter with a cutoff of 1500 Hz to attenu-
ate 2π f
c
frequency components. As with any PLL, its
performance is determined to a large extent by Ki and
Kp coefficients (a wrong choice leads to instability,
especially with low SNR signals). Initially, FIR fil-
ter delay in the feedback path was considered when
A Low Cost Solution for NOAA Remote Sensing
131
choosing coefficients’ values, as in (Wilson et al.,
2009), but unsatisfactory experimental results sug-
gested a different approach was necessary; in the end,
atpdec’s (Leconte, 2003) values ensured good demod-
ulation and image decoding results. The second de-
modulator is a simple envelope detector: the input
signal gets full-wave rectified by the absolute value
function and filtered by a linear-phase FIR filter with a
steep transition between passband and stopband. The
filter greatly attenuates the fc component while leav-
ing the modulating signal intact. Demodulation qual-
ity is satisfactory at high SNR, though PLL demod-
ulation shows better performance with low SNR sig-
nals. Furthermore, PLL demodulation has high com-
putational complexity. On the other side, the software
envelope detector solution has lower computational
complexity; its hardware implementation is not eas-
ily accessible because it would require the addition of
a low-pass filter with a large number of poles.
3.3.7 Synchronization Block
APT format is equipped with two synchronization
pulses: horizontal synchronization (sync A) is used
as a boundary between video lines and inter-channel
synchronization (sync B) is used as a boundary be-
tween the two video channels (Winston, 1997). In
our work, we only used sync A as we implemented
channel separation in the Image Processing code by
splitting every line into two parts, each consisting of
1040 pixels. Synchronization block processes signals
sampled at a multiple of the symbol rate (4160 sym-
bols/s), a requirement easily met by ADCs clocked by
modern PLL clock generators. That being said, the
signal is downsampled by selecting the median of the
N samples instead of one sample every N. The median
filter is widely known to greatly reduce impulse noise.
Part (a) of Fig. 2 down-samples the signal, while (b)
correlates previous part’s output with a pattern of sync
A; synchronization pulses are detected comparing lo-
cal correlation peaks with maximum correlation in the
last 3/4 seconds (c) (time during which one and a half
video lines get transmitted). If correlation at discrete
instant k-1 is a local peak and is greater than 80% of
maximum correlation in said interval, it is considered
as a synchronization pulse and a row formed by the
last 2080 samples is inserted as a new element at the
end of queue (e). Sometimes, synchronization pulses
are lost or are erroneously detected due to signal fad-
ing or noise, so a filtering technique was devised (d):
it filters pulses detected less than 2070 samples after
last one. If a pulse has not been detected after 2090
samples the line is inserted at the end of the queue
anyway and the 2090 samples counter is reset; the
2070 samples counter is not reset not to interfere with
a)
b)
1
Out
1
In
num(z)
1
Discrete FIR Filter
|u|
Abs
c)
Figure 1: a) FM demodulator; b) PLL-based AM demodu-
lator c) Envelope detector AM demodulator.
(c)
(d)
(e)
(f)
Figure 2: Synchronization block.
SENSORNETS 2018 - 7th International Conference on Sensor Networks
132
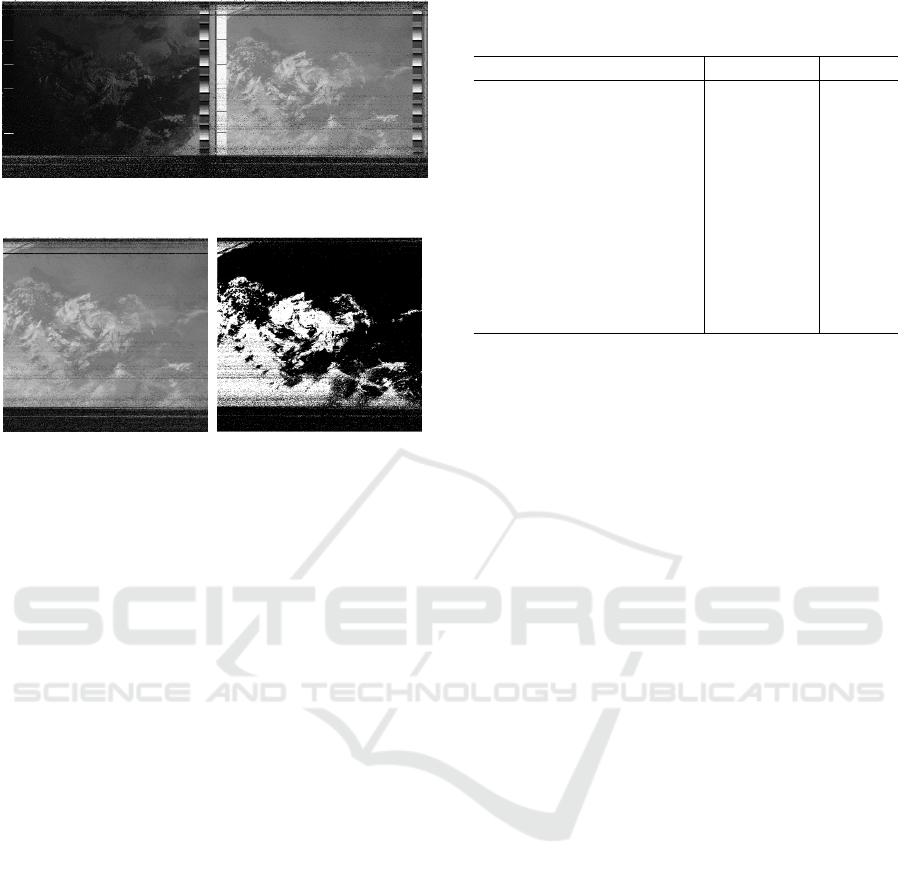
Figure 3: AVHRR image after automatic cropping.
Figure 4: Left: disk filtered remote sensing image from
NOAA. Right: clouds segmentation achieved with the Otsu
method.
subsequent synchronization pulses. Finally, the Rate
Transition block (f) outputs two lines of 2080 pixels
each per second.
3.3.8 Pixel Dynamic Range Calibration Block
Each frame, composed of 128 rows, contains 16
wedges (or patches), the first nine carry data about
the image dynamic range: wedges 1-8 represent val-
ues from 1/8 to 8/8, while 9 is the zero reference. The
calibration block detects the exact position of those 9
wedges cross-correlating a vertical band of the image
with an example pattern, then the values of wedges
8 and 9 are sampled to compute gray level offset and
dynamic range. Offset is subtracted from pixel val-
ues and the result is divided by the detected dynamic
range, in order, to normalize pixel values to the [0
1] interval: values outside this range can be treated
as noise and clipped to 0 or 1. This block outputs a
stream of pixel rows that can be further improved us-
ing Image Processing algorithms.
4 EXPERIMENTAL RESULTS
The output of our model is a 2080x2*T image, where
T is running time in seconds. The image includes
white noise or artifacts when PLL lock is not asserted,
but these are cropped out by an algorithm using pixel
variance in calibration wedges to estimate row recep-
tion quality. Only rows having an entropy below a cer-
Table 1: Objective metrics results for image enhancement
filtering.
Method PSNR [dB] RMSE
None (raw image) 17.788 0.129
3x3 arithmetic mean filter 17.981 0.126
3x3 geometric mean filter 13.655 0.208
3x3 harmonic mean filter 13.295 0.216
3x3 contraharmonic
mean filter with Q = 1 18.023 0.126
3x3 gaussian filter 18.485 0.119
3x3 disk filter 18.590 0.118
Adaptive median filter
(min: 3x3 - max: 5x5) 18.444 0.120
Adaptive filter 3x3 16.298 0.153
tain threshold remain, of which an example is shown
below (as a 2D plot). The result is a smaller im-
age which uses less storage space and can be post-
processed faster. As can be easily seen in Fig. 3, the
image is corrupted by noise due to attenuation/fading
of the satellite signal and intermodulation with strong
out-of-band emissions, mainly from FM broadcasting
transmitters and GSM base stations. Various Image
Processing filtering methods have been used to en-
hance the images and objective metrics (PSNR and
RMSE) allow us to compare the results. The results
are reported in Table 1. The disk filter is shown to be
achieving the best results of PSNR and RMSE. Once
the image is denoised (Fig. 4 left), we used a state of
the art cloud segmentation method to isolate clouds
pixels both from land pixels and the rest of the image.
Otsu method (Zhang and Hu, 2008) is a segmentation
method widely used for its simpleness and effective-
ness and its robustness against noise (usually present
in APT images). That being said, our main objec-
tive was the release of a new accessible platform to
receive NOAA signals and to enhance noisy images
and achieve better results in terms of remote sensing
imagery. We also show the results of clouds segmen-
tation achieved by Otsu method (Fig. 4 right).
5 CONCLUSIONS AND FUTURE
WORKS
In this paper we proposed a new easily accessible so-
lution for NOAA remote sensing. Although we used
low cost elements and hardware, we achieved good
results in terms of signal reception, demodulation,
synchronization and image enhancement. The sys-
tem is able to predict NOAA satellite passes, lock, de-
modulate and synchronize the signals. The output of
the demodulator is an image of the area scanned by a
A Low Cost Solution for NOAA Remote Sensing
133

line perpendicular to the flight direction of the NOAA
satellite. We detected the clouds in the image by using
Otsu method (Zhang and Hu, 2008). In future works
we want to include the following solutions:
A more performant model for the receiver, such as
FUNcube Dongle Pro+ or HackRF One; the adoption
of a numerically controlled and built QFH antenna
and an amplifier with lower noise figure and low sig-
nal loss; the development of an algorithm for thermal
maps generation based on the analysis of the infrared
images; noise profiling based on long time analysis
of radio frequency interferences located near the re-
ceiver. We aim to develop a modular solution for the
prediction of atmospheric phenomena, based on the
analysis of the images retrieved from several satellites
(each one transmitting at its own frequency and with
its own modulation scheme) at different times of the
day.
REFERENCES
Al-Moustafa, T., Armitage, R. P., and Danson, F. M. (2012).
Mapping fuel moisture content in upland vegetation
using airborne hyperspectral imagery. Remote sensing
of Environment, 127:74–83.
Alkhatib, M. Q., Cabrera, S. D., and Gill, T. E. (2012).
Automated detection of dust clouds and sources in
NOAA-AVHRR satellite imagery. In Image Analy-
sis and Interpretation (SSIAI), 2012 IEEE Southwest
Symposium on, pages 97–100. IEEE.
Barnes, J. C. and Smallwood, M. D. (1982). Tiros-N series
direct readout services users guide.
Benabadji, N., Hassini, A., and Belbachir, A. H. (2004).
Hardware and software consideration to use NOAA
images. Revue Internationale des Energies Renouve-
lables, CDER, 7(01):1–11.
Camps-Valls, G., Benediktsson, J. A., Bruzzone, L., and
Chanussot, J. (2011). Introduction to the issue
on advances in remote sensing image processing.
IEEE Journal of Selected Topics in Signal Processing,
5(3):365–369.
Farserotu, J. and Prasad, R. (2000). A survey of future
broadband multimedia satellite systems, issues and
trends. IEEE Communications Magazine, 38(6):128–
133.
Feidas, H., Cartalis, C., and Cracknell, A. (2000). Use of
Meteosat imagery to define clouds linked with floods
in Greece. International Journal of Remote Sensing,
21(5):1047–1072.
Griffiths, M. (2014). Turnstile design — DigitalHam.
http://www.digitalham.co.uk/design.
Heidinger, A. K., Evan, A. T., Foster, M. J., and Walther,
A. (2012). A naive Bayesian cloud-detection scheme
derived from CALIPSO and applied within PATMOS-
x. Journal of Applied Meteorology and Climatology,
51(6):1129–1144.
Karlsson, K.-G., Johansson, E., and Devasthale, A. (2015).
Advancing the uncertainty characterisation of cloud
masking in passive satellite imagery: Probabilistic
formulations for NOAA AVHRR data. Remote Sens-
ing of Environment, 158:126–139.
Keen, K. (2013). Rtl fm Guide: Updates for rtl fm over-
haul. http://kmkeen.com/rtl-demod-guide.
Leconte, T. (2003). ATPDEC Home Page.
http://atpdec.sourceforge.net.
Lyons, R. G. (2004). Understanding Digital Signal Pro-
cessing, 3/E. Pearson Education India.
Magliacane, J. (2001). PREDICT - A Satel-
lite Tracking/Orbital Prediction Program.
http://www.qsl.net/kd2bd/predict.html.
Moradi, I., Meng, H., Ferraro, R. R., and Bilanow,
S. (2013). Correcting geolocation errors for mi-
crowave instruments aboard NOAA satellites. IEEE
Transactions on Geoscience and Remote Sensing,
51(6):3625–3637.
Osmocom (2012). rtl-sdr - OsmoSDR.
http://sdr.osmocom.org/trac/wiki/rtl-sdr.
Promwong, S. and Takada, J.-i. (2004). Free space link bud-
get estimation scheme for ultra wideband impulse ra-
dio with imperfect antennas. IEICE Electronics Ex-
press, 1(7):188–192.
Sergienko, A. B. (2014). Software-defined radio in MAT-
LAB Simulink with RTL-SDR hardware. In Com-
puter Technologies in Physical and Engineering Ap-
plications (ICCTPEA), 2014 International Confer-
ence on, pages 160–161. IEEE.
Shima, J. M. (1995). FM demodulation using a digital radio
and digital signal processing. Master’s thesis, Univer-
sity of Florida.
Simpson, J. J. and Gobat, J. I. (1996). Improved cloud de-
tection for daytime AVHRR scenes over land. Remote
Sensing of Environment, 55(1):21–49.
Sruthi, M., Abirami, M., Manikkoth, A., Gandhiraj, R.,
and Soman, K. (2013). Low cost digital transceiver
design for Software Defined Radio using RTL-SDR.
In Automation, Computing, Communication, Control
and Compressed Sensing (iMac4s), 2013 Interna-
tional Multi-Conference on, pages 852–855. IEEE.
Wilson, J., Nelson, A., and Farhang-Boroujeny, B. (2009).
Parameter derivation of type-2 discrete-time phase-
locked loops containing feedback delays. IEEE Trans-
actions on Circuits and Systems II: Express Briefs,
56(12):886–890.
Winston, W. (1997). User’s Guide for Building and Oper-
ating Environmental Satellite Receiving Stations. Na-
tional Environmental Satellite, Data, and Information
Service, NOAA.
Yhann, S. R. and Simpson, J. J. (1995). Application
of neural networks to AVHRR cloud segmentation.
IEEE transactions on geoscience and remote sensing,
33(3):590–604.
Zhang, J. and Hu, J. (2008). Image segmentation based on
2D Otsu method with histogram analysis. In Com-
puter Science and Software Engineering, 2008 Inter-
national Conference on, volume 6, pages 105–108.
IEEE.
SENSORNETS 2018 - 7th International Conference on Sensor Networks
134
