
A New Dimension of Breast Cancer Epigenetics
Applications of Variational Autoencoders with DNA Methylation
Alexander J. Titus
1,2
, Carly A. Bobak
1,3
and Brock C. Christensen
2,4,5
1
Quantitative Biomedical Sciences, Dartmouth School of Graduate and Advanced Studies, Hanover, NH, U.S.A.
2
Department of Epidemiology, Dartmouth Geisel School of Medicine, Hanover, NH, U.S.A.
3
Thayer School of Engineering, Dartmouth School of Graduate and Advanced Studies, Hanover, NH, U.S.A.
4
Department of Molecular and Systems Biology, Dartmouth Geisel School of Medicine, Hanover, NH, U.S.A.
5
Department of Community and Family Medicine, Dartmouth Geisel School of Medicine, Hanover, NH, U.S.A.
Keywords:
Deep Learning, DNA Methylation, Breast Cancer, Epigenetics, Variational Autoencoders, TCGA.
Abstract:
In the era of precision medicine and cancer genomics, data are being generated so quickly that it is difficult
to fully appreciate the extent of what is discoverable. DNA methylation, a chemical modification to DNA,
has been shown to be a significant factor in many cancers and is a candidate data source with ample features
for model traing. However, the black-box nature of non-linear models, such as those in deep learning, and
a lack of accurately labeled ground truth data have limited the same rapid adoption in this space that other
methods have experienced. In this article, we discuss the applications of unsupervised learning through the
use of variational autoencoders using DNA methylation data and motivate further work with initial results
using breast cancer data provided by The Cancer Genome Atlas. We show that a logistic regression classifier
trained on the learned latent methylome accurately classifies disease subtype.
1 INTRODUCTION
Krizhevsky et al. took the machine learning world
by storm when they published their 2012 paper that
won the popular ImageNet competition using a deep
neural network (Krizhevsky et al., 2012). Since that
time, deep neural networks, now popularly referred
to as deep learning, have achieved state of the art per-
formance on previously challenging problems such as
image recognition and speech processing.
The molecular biology community has been
slower to adopt deep learning as a common method
of analysis. Deep learning models learn functions of
data, including non-linear relationships and it is there-
fore difficult to discern what is happening inside the
model. In a field focused on identifying mechanistic
answers to life systems, the limitation of hidden lay-
ers adds a challenge for adopting the approach. Only
recently have people begun to delve into deep learn-
ing as a powerful tool for biological analysis.
In recent work, Angermueller et al. devel-
oped a model to predict single-cell DNA methylation
(DNAm) states using deep neural networks (Anger-
mueller et al., 2017). Similarly, Wang et al. have
developed a deep network trained on genome topo-
logical features to predict individual CpG methyla-
tion states (Wang et al., 2016). Using convolutional
neural networks, Zeng et al. developed a model pre-
dicting the impact of non-coding genomic variants on
DNAm (Zeng and Gifford, 2017). To date, however,
we are not aware of any published studies that have
combined epigenetics and genome-scale DNA methy-
lation with unsupervised deep learning.
Epigenetics - literally above genetics - is itself
an often hidden layer of regulation between genet-
ics and manifested phenotypes in biological systems
and is a major contributor to the wide diversity in bi-
ological systems. It includes a set of chemical mod-
ifications on DNA, expression of noncoding RNAs,
and post-translational modifications of proteins that
modify DNA. One modification, DNA methylation
(DNAm), is the addition of a methyl group to cytosine
(C) in the context of cytosine-guanine dinucleotide
pairs (CpG). One of the most common methods
of measuring genome-scale DNAm is Illumina Inc.
microarray-based technologies. The HumanMethyla-
tion450 (450K) and MethylationEPIC (EPIC) chips
measure ∼ 450,000 and ∼ 850, 000 CpG sites, re-
spectively, and report a proportion of methylated al-
leles, bound between 0-1, for each CpG.
140
Titus, A., Bobak, C. and Christensen, B.
A New Dimension of Breast Cancer Epigenetics - Applications of Variational Autoencoders with DNA Methylation.
DOI: 10.5220/0006636401400145
In Proceedings of the 11th International Joint Conference on Biomedical Engineering Systems and Technologies (BIOSTEC 2018) - Volume 3: BIOINFORMATICS, pages 140-145
ISBN: 978-989-758-280-6
Copyright © 2018 by SCITEPRESS – Science and Technology Publications, Lda. All rights reserved

Traditional machine learning and statistical mod-
els struggle when the number of features (k) is greater
than the number of samples (n). In the case of DNA
methylation, samples measured with genome-scale
technology will each have 400,000-800,000 features
and therefore k >> n. When conducting epigenome-
wide association studies (EWAS), often the need to
correct for multiple hypothesis testing results in con-
servative estimates of significance and potentially
false negative results. Therefore, in an effort to reduce
the burden of multiple hypothesis testing, methods of
dimensionality reduction that maintain the richness of
the information in the larger feature set are needed.
Precision medicine is increasingly finding ways
to target disease subclasses for more effective treat-
ments. In breast cancer, there are five distinct molec-
ular subtypes defined by a 50 gene expression classi-
fication panel, commonly known as the PAM50 genes
(Sorlie et al., 2001). These subtypes have many dis-
tinct genomic characteristics, including DNAm pro-
files, (Sorlie et al., 2001) as well as some similari-
ties (Titus et al., 2017). Normal-like tumors resemble
the characteristics of normal tissue, the majority of
Luminal A and Luminal B tumors are ER+/HER2-,
Her2 tumors are typically HER2+, and the majority of
Basal-like tumors are triple-negative tumors, amongst
the most challenging tumors to treat (TCGA, 2012).
In this article, we explore applications of unsuper-
vised variational autoencoders in the study of DNA
methylation. We present initial results from extract-
ing a biologically relevant latent methylome using
variational autoencoders from a breast cancer data set
(BRCA) that is publicly available through The Can-
cer Genome Atlas. We demonstrate that this lower
dimensional latent space holds relevant information
about the original methylome and that it can be used
in subsequent analyses as features in models. We also
comment on potential applications in using such a la-
tent epigenetic representation for future analyses.
2 METHODS
2.1 Data
We downloaded all Illumina HumanMethylation450
(450K) DNAm level 1 sample intensity data files for
breast invasive carcinoma and normal-adjacent tissue
from the The Cancer Genome Atlas (TCGA) data
access portal (TCGA, 2012). All intrinsic molecu-
lar subtypes were included (n=862) except normal-
like due to sample size. We processed the data files
with the R package minfi using the Funnorm nor-
malization method on the full dataset (Aryee et al.,
Table 1: TCGA sample characteristics.
Tissue/subtype
n
(862)
Age
mean (SD)
Normal-adjacent 86 57.6 (12.7)
Basal-like 86 56.8 (12.8)
Her2 31 60 (12.8)
Luminal A 285 58 (13.5)
Luminal B 124 57.1 (12.6)
Undefined 250 58.8 (13.6)
2014). We then filtered CpGs with a detection P-
value> 1.0 × 10
−05
in more than 25% of samples,
CpGs with high frequency SNP(s) (> 5% minor allele
frequency) in the probe, probes previously described
to be potentially cross-hybridizing, and sex-specific
probes (Wilhelm-Benartzi et al., 2013; Chen et al.,
2013) (Table 1).
From an original set of 485,512 measured CpG
sites on the 450K array, our filtering steps re-
moved 2,932 probes exceeding the detection P-value,
and 93,801 probes that were SNP-associated, cross-
hybridizing, or sex-specific resulting in a final ana-
lytic set of 388,779 CpGs. To allow some variation
in the number of probes removed during data prepro-
cessing, only the top 300,000 most variable CpGs by
methylation value were used for model training.
2.2 Variational Autoencoder Model
Variational autoencoders (VAE) are unsupervised
models that learn latent representations of input data
(Kingma and Welling, 2013). The VAE learns such
latent representations through data compression and
nonlinear activation functions. VAE models are
stochastic and learn the distribution of explanatory
features over samples during training. At test or appli-
cation time, this learned distribution may be sampled
to reconstruct or generate data.
In this work, we extend the VAE model, Tybalt,
to learn a latent methylome from DNAm microar-
ray data. Tybalt was developed by Way et al. for
learning latent gene expression trancriptomes (Way
and Greene, 2017). The Tybalt model consists of an
Adam optimizer (Kingma and Ba, 2014), rectified lin-
ear units (Nair and Hinton, 2010) and batch normal-
ization in the encoding stage, and sigmoid activation
in the decoding stage. Tybalt is built in Keras (ver-
sion 2.0.6) (Chollet and Others, 2015) with a Tensor-
Flow backend (version 1.0.1) (Abadi et al., 2016). We
trained the model using optimal parameters identified
by Way et al., with the following values: batch size
= 50, learning rate = 0.0005, κ = 1, epochs = 50,
test/validation = 90/10 (Way and Greene, 2017).
The original model by Way et al. was designed
A New Dimension of Breast Cancer Epigenetics - Applications of Variational Autoencoders with DNA Methylation
141
for 5,000 input genes encoded to 100 latent features
and then reconstructed back to the original 5,000 di-
mensions. We adapted the model to take in and re-
construct 300,000 CpG methylation values, propor-
tion of alleles methylated at a specific site, with 100
intermediate latent dimensions. The 300,000 input
CpGs were selected based on highest variability by
median absolute deviation (MAD) of methylation in
the TCGA BRCA dataset. All samples were used for
training the variational autoencoder.
2.3 Analysis
2.3.1 Latent Activations
To begin investigating the VAE embeddings, we con-
ducted pairwise correlations between each of the 100
latent VAE dimensions and visualized the correlation
structure using unsupervised hierarchical clustering.
We then conducted unsupervised hierarchical clus-
tering on the the data samples (n = 862) with their
respective 100 dimensional VAE representations and
associated each sample with its respective molecular
subtype classification.
2.3.2 Dimensionality Reduction
In order to develop a better understanding of how
much relevant information the latent activation of
the VAE retains, we conducted dimensionality reduc-
tion analyses in three dimensional space using the t-
Distributed Stochastic Neighbor Embedding (t-SNE)
(van der Maaten and Hinton, 2008). We then con-
ducted unsupervised hierarchical clustering on the the
data (n= 862) with their respective three dimensional
t-SNE embeddings and associated each sample with
its molecular subtype classification, as well as visual-
ized the embeddings in three dimensional space.
2.3.3 Subtype Classification
In order to test the utility of the learned latent methy-
lome, we trained “1 vs. The Rest” logistic regression
classifiers on the t-SNE embeddingsof the VAE latent
activations to classify tumors into one of their molec-
ular subtypes. Univariate, bivariate, and multivariate
classifiers were developed using 1, 2, or 3 of the re-
sulting dimensions from our t-SNE analysis. We split
our 862 samples 50/ 50 for training/testing sets and
ensured that each set had ∼ 50% of the samples from
the respective molecular subtype population. Only
samples with a PAM50 assignment were used for the
classification models.
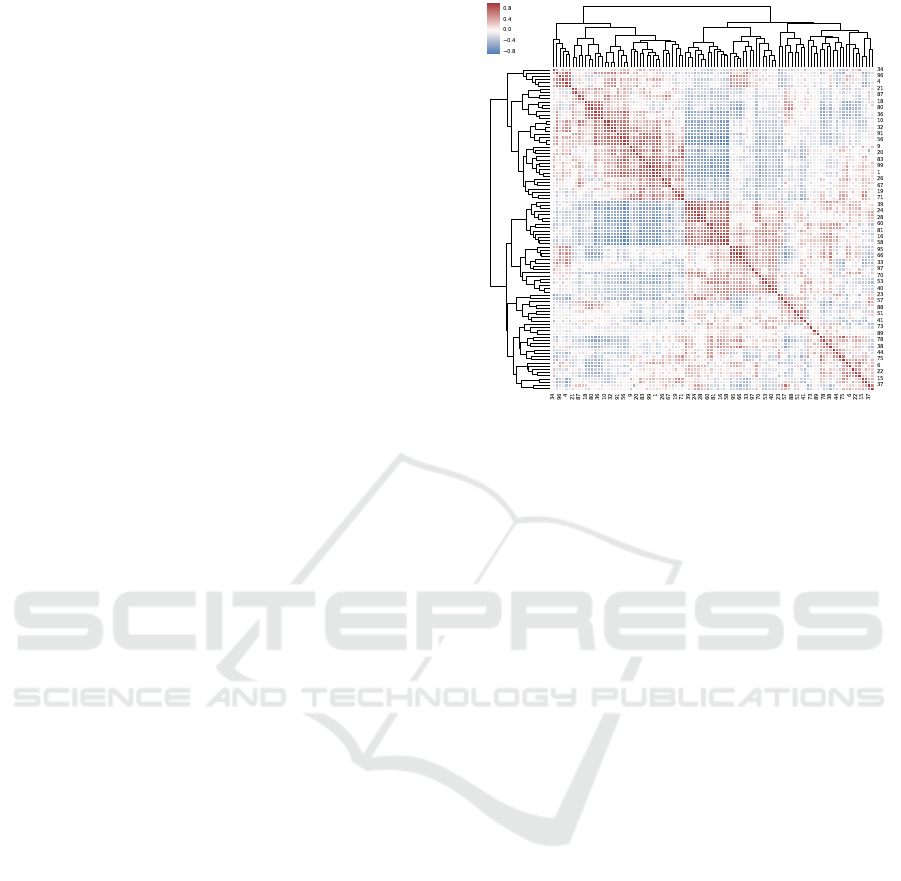
Figure 1: Pair-wise correlation of 100 latent nodes gener-
ated with the variational autoencoder model Tybalt. Red
indicates high positive correlation, blue indicates high neg-
ative correlation, and white indicates low correlation.
3 RESULTS
3.1 Latent Activations
The pairwise correlation of the 100 latent activations
from the VAE training is shown in Figure 1. After
hierarchical clustering, the VAE captured correlation
structure amongst a number of the latent nodes, both
in the positive and negativedirections. There is strong
correlation in CpG methylation, particularly in those
sites close in relative genomic location, and the VAE
training is intended to learn a biologically relevant
representation of the measured methylome.
We next performed hierarchical unsupervised
clustering, using euclidean distance, on subjects with
the respective 100 latent node activations from the
VAE model (Figure 2). We see strong evidence of
structure in the latent data both in the VAE and the
subject dimensions. The clustering reveals groups
of subjects by molecular tumor subtype, with the
strongest group being Luminal B tumors, but also
with relatively strong clusters of Luminal A, Basal-
like, and healthy (normal) samples. Three broader
clusters are also apparent, with Luminal tumors (A
& B), basal-like tumors, and normal tissue samples
clustering tightly.
3.2 Dimensionality Reduction
Traditional EWAS analyses run univariate analyses
between each CpG and the outcome of interest, of-
BIOINFORMATICS 2018 - 9th International Conference on Bioinformatics Models, Methods and Algorithms
142
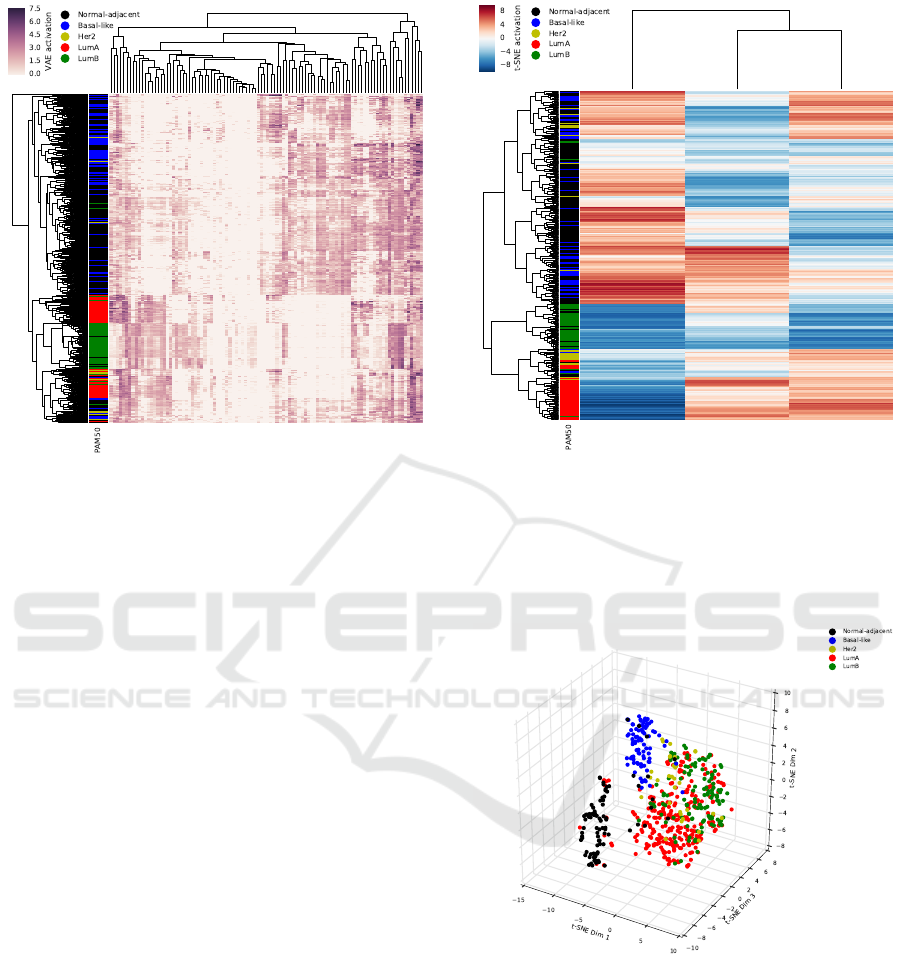
Figure 2: Unsupervised hierarchical clustering of latent
node activation by subject of 100 latent nodes generated
with the variational autoencoder model Tybalt. Rows are
annotated with PAM50 molecular subtype classifications.
Normal samples are black, Basal-like samples are blue,
Her2 samples are yellow, LumA samples are red, and LumB
samples are green.
ten leading to > 400, 000 statistical tests, and are then
corrected for multiple hypothesis testing. This of-
ten leads to conservative statistical cutoffs and false
negative results. The VAE model is a method of di-
mensionality reduction, summarizing the information
from 300,000 features into 100 features. To further
investigate the information encompassed into the la-
tent dimensions, we conducted further dimensionality
reduction on the VAE nodes using the t-SNE method
to compress the information into three dimensions.
After hierarchical clustering of subjects by the re-
spective three dimensional t-SNE representations, we
observed strong distinct clusters compared to the clus-
tering in the 100 VAE dimensional space. These clus-
ters represent a tight group of Luminal A tumors, Lu-
minal B tumors, and a cluster of Luminal A and Lu-
minal B tumors together. The Basal-like tumors and
normal-adjacent samples appeared to roughly cluster
together, but still showed separation (Figure 3).
When plotted in three dimensional t-SNE space,
we observed three distinct clusters. These clusters
correspond to normal-adjacent tissue samples (black),
Basal-like tumor samples (blue), and a combination
of Her2, Luminal A, and Luminal B tissue samples
(Figure 4). The clusters also correspond to the sep-
aration of normal-adjacent tissue and triple-negative
tumors from other breast tumors.
Figure 3: Unsupervised hierarchical clustering of three di-
mensional t-SNE latent activations trained on the 100 latent
nodes generated with the variational autoencoder model Ty-
balt. Rows are annotated with PAM50 molecular subtype
classifications. Normal-adjacent samples are black, Basal-
like samples are blue, Her2 samples are yellow, LumA sam-
ples are red, and LumB samples are green.
Figure 4: t-SNE three dimensional reduction of 100 latent
nodes generated with the variational autoencoder model Ty-
balt. Normal-adjacent samples are black, Basal-like sam-
ples are blue, Her2 samples are yellow, LumA samples are
red, and LumB samples are green.
3.3 Subtype Classification
To investigate the utility of the latent methylome, we
trained logistic regression classifiers on each molec-
ular subtype in “1 vs. The Rest” analyses. We built
initial models using all three t-SNE latent dimensions.
We observed classification accuracies of 0.961 for
A New Dimension of Breast Cancer Epigenetics - Applications of Variational Autoencoders with DNA Methylation
143

normal-adjacent tissue samples, 0.944 for Basal-like
tumors, 0.961 for Her2 tumors, 0.695 for Luminal A
tumors, and 0.843 for Luminal B tumors (Table 2).
After the initial classification tasks, we reduced
each model to the one or two t-SNE dimensions that
were statistically significant in the first model, and
reclassified each subtype. For the second classifica-
tion task, we saw classification accuracies of 0.956
for normal-adjacent tissue using dimensions 1 & 3,
0.939 for Basal-like tumors using dimensions 1 & 3,
0.961 for Her2 using dimension 3, 0.644 for Lumi-
nal A tumors using dimensions 1 & 2, and 0.944 for
Luminal B tumors using dimensions 1 & 3 (Table 2).
Table 2: Logistic regression classification performance
based on a combination of three dimensional t-SNE fea-
tures.
3D Accuracy 2D/1D Accuracy t-SNE
Normal 0.961 0.956 1 & 3
Basal 0.944 0.939 1 & 3
Her2 0.961 0.961 3
LumA 0.695 0.644 1 & 2
LumB 0.843 0.944 1 & 3
4 DISCUSSION
Overall, DNA methylation data is a prime candi-
date for unsupervised deep learning applications. De-
spite relatively low volumes of available fully anno-
tated data, the number of features per sample provide
ample opportunities for models to learn and predict.
With less than 1,000 samples, we show that varia-
tional autoencoders can learn a biologically relevant
latent methylome, and this latent representation has
the potential be used for lower dimensional epigenetic
analyses. Future work will investigate pan-cancer la-
tent methylomes and will develop learning models fo-
cused on predicting disease outcomes.
A common pre-processing step in deep learning
is to rescale input data to the range 0-1. As methy-
lation microarray data is both inherently bound be-
tween [0,1] and has a known distribution, it is prime
for feeding into a network. VAEs in particular are
promising applications because they are unsupervised
and learn the underlying distribution of data, allowing
for a more accurate generation of new data.
A common drawback of deep learning methods
is the need for vast amounts for data. While we ac-
knowledge that more data is generally better, here
we demonstrate the potential utility of deep learning
methods in < 1000 samples. From a relatively small
set of data, we successfully learned a 100 dimensional
as well as a three dimensional representation of breast
cancer that distinguished normal-adjacent tissue and
intrinsic subtypes of breast tumors. Successfully clas-
sifying disease subtype, defined with a different bio-
logical measure (gene expression), in this latent space
suggests that these representations are capturing ac-
curate and useful information about the underlying
biology. While the intrinsic breast tumor subtypes
have known differences in hormone receptor status
(TCGA, 2012), its possible the model is capturing this
information. Further investigation is needed to tease
apart the nuances of the VAE learning process.
In that regard, there are a number of promising fu-
ture directions. We plan to investigate the association
of latent nodes with clinical covariatessuch as age and
sex. There are numerous existing applications of CpG
“libraries” that can predict a subject’s age (Horvath,
2013), cancer risk (Yang et al., 2016), or those that
can quantify the distributions of individual cell types
in a sample (Houseman et al., 2012). VAEs provide
potential opportunities to train models on the latent
nodes in an attempt to predict disease severity, cancer
risk, survival, or disease re-occurrence.
In the original development of Tybalt, Way et al.
conducted a pan-cancer analysis of the latent tran-
scriptome (Way and Greene, 2017). We intend to
extend this work on breast cancer DNA methylation
to investigate what can be learned about shared DNA
methylation biology across cancer types.
Beyond investigative analyses, there are poten-
tial applications in data imputation that take advan-
tage of the learned latent methylome. For example,
there is ample legacy 450K data available, but the
field has moved to using the EPIC array. These ar-
rays have vast amounts of overlapping information,
and as such one potential application of learned latent
methylomes is to impute the missing information to
“lift-up” the 450K data to the ∼ 850K dimensions of
the EPIC array.
Similarly, there are opportunities to develop meth-
ods of data simulation. Despite an abundance of avail-
able data, analyses are often limited by the number of
study specific samples, particularly in the biological
sciences. Conditional VAEs can be trained to simu-
late data of a specific type (Kingma et al., 2014), for
example from a specific cancer, that could be used to
increase sample sizes for model training. There are a
number of methylation-based algorithms that require
expensive-to-collect training data. If we could condi-
tion on a sample to simulate additional realistic sam-
ples, then we may start to overcome some of the fi-
nancial challenges of biological data collection.
BIOINFORMATICS 2018 - 9th International Conference on Bioinformatics Models, Methods and Algorithms
144

5 CONCLUSIONS
We show that DNA methylation is a prime resource
for unsupervised learning with variational autoen-
coders. Generative models such as these learn and
underlying distribution of the data, providing promis-
ing new avenues to generate artificial data to enhance
training. The volume of publicly available DNAm
data is growing, and as precision medical research
continues to progress, scientists should be taking ad-
vantage of such opportunities.
ACKNOWLEDGEMENTS
Research reported in this publication was supported
by the Office of the U.S. Director of the National In-
stitutes of Health under award number T32LM012204
to AJT, grants R01DE022772 and R01CA216265 to
BCC, and by a Burroughs Wellcome Fund fellowship
to CAB under award number #1014106.
REFERENCES
Abadi, M., Agarwal, A., Barham, P., Brevdo, E., Chen, Z.,
Citro, C., Corrado, G., Davis, A., Dean, J., Devin, M.,
Ghemawat, S., Goodfellow, I., Harp, A., Irving, G.,
Isard, M., Jia, Y., Jozefowicz, R., Kaiser, L., Kudlur,
M., Levenberg, J., Mane, D., Monga, R., Moore, S.,
Murray, D., Olah, C., Schuster, M., Shlens, J., Steiner,
B., Sutskever, I., Talwar, K., Tucker, P., Vanhoucke,
V., Vasudevan, V., Viegas, F., Vinyals, O., Warden,
P., Wattenberg, M., Wicke, M., Yu, Y., and Zheng,
X. (2016). TensorFlow: Large-Scale Machine Learn-
ing on Heterogeneous Distributed Systems. ArXiv e-
prints.
Angermueller, C., Lee, H. J., Reik, W., and Stegle, O.
(2017). DeepCpG: accurate prediction of single-cell
DNA methylation states using deep learning. Genome
Biol., 18(1):67.
Aryee, M. J., Jaffe, A. E., Corrada-Bravo, H., Ladd-Acosta,
C., Feinberg, A. P., Hansen, K. D., and Irizarry,
R. A. (2014). Minfi: a flexible and comprehen-
sive Bioconductor package for the analysis of In-
finium DNA methylation microarrays. Bioinformat-
ics, 30(10):1363–1369.
Chen, Y.-a., Lemire, M., Choufani, S., Butcher, D. T.,
Grafodatskaya, D., Zanke, B. W., Gallinger, S., Hud-
son, T. J., and Weksberg, R. (2013). Discovery of
cross-reactive probes and polymorphic CpGs in the
Illumina Infinium HumanMethylation450 microarray.
Epigenetics, 8(2):203–209.
Chollet, F. and Others (2015). Keras.
https://github.com/fchollet/keras.
Horvath, S. (2013). DNA methylation age of human tissues
and cell types. Genome Biol., 14(10):R115.
Houseman, E. A., Accomando, W. P., Koestler, D. C.,
Christensen, B. C., Marsit, C. J., Nelson, H. H.,
Wiencke, J. K., and Kelsey, K. T. (2012). DNA methy-
lation arrays as surrogate measures of cell mixture dis-
tribution. BMC Bioinformatics, 13(1):86.
Kingma, D., Rezende, D., Mohamed, S., and Welling, M.
(2014). Semi-Supervised Learning with Deep Gener-
ative Models. ArXiv e-prints.
Kingma, D. P. and Ba, J. (2014). Adam: A Method for
Stochastic Optimization. CoRR, abs/1412.6.
Kingma, D. P. and Welling, M. (2013). Auto-Encoding
Variational Bayes. ArXiv e-prints.
Krizhevsky, A., Sutskever, I., and Hinton, G. E. (2012). Im-
ageNet Classification with Deep Convolutional Neu-
ral Networks. In Pereira, F., Burges, C. J. C., Bot-
tou, L., and Weinberger, K. Q., editors, Adv. Neural
Inf. Process. Syst. 25, pages 1097–1105. Curran As-
sociates, Inc.
Nair, V. and Hinton, G. E. (2010). Rectified linear units
improve restricted boltzmann machines. In Proc. 27th
Int. Conf. Mach. Learn., pages 807–814.
Sorlie, T., Perou, C. M., Tibshirani, R., Aas, T., Geisler,
S., Johnsen, H., Hastie, T., Eisen, M. B., van de Rijn,
M., Jeffrey, S. S., Thorsen, T., Quist, H., Matese,
J. C., Brown, P. O., Botstein, D., Lonning, P. E.,
and Borresen-Dale, A. L. (2001). Gene expression
patterns of breast carcinomas distinguish tumor sub-
classes with clinical implications. Proc. Natl. Acad.
Sci. U. S. A., 98(19):10869–10874.
TCGA (2012). Comprehensive molecular portraits of hu-
man breast tumours. Nature, 490(7418):61–70.
Titus, A. J., Way, G. P., Johnson, K. C., and Chris-
tensen, B. C. (2017). Deconvolution of DNA methy-
lation identifies differentially methylated gene regions
on 1p36 across breast cancer subtypes. Sci. Rep.,
7(11594).
van der Maaten, L. and Hinton, G. (2008). Visualizing
data using t-SNE. J. Mach. Learn. Res., 9(Nov):2579–
2605.
Wang, Y., Liu, T., Xu, D., Shi, H., Zhang, C., Mo, Y.-Y., and
Wang, Z. (2016). Predicting DNA Methylation State
of CpG Dinucleotide Using Genome Topological Fea-
tures and Deep Networks. 6:19598.
Way, G. P. and Greene, C. S. (2017). Extracting a Biolog-
ically Relevant Latent Space from Cancer Transcrip-
tomes with Variational Autoencoders. bioRxiv.
Wilhelm-Benartzi, C. S., Koestler, D. C., Karagas, M. R.,
Flanagan, J. M., Christensen, B. C., Kelsey, K. T.,
Marsit, C. J., Houseman, E. A., and Brown, R. (2013).
Review of processing and analysis methods for DNA
methylation array data. Br. J. Cancer, 109(6):1394–
1402.
Yang, Z., Wong, A., Kuh, D., Paul, D. S., Rakyan, V. K.,
Leslie, R. D., Zheng, S. C., Widschwendter, M., Beck,
S., and Teschendorff, A. E. (2016). Correlation of
an epigenetic mitotic clock with cancer risk. Genome
Biol., 17(1):205.
Zeng, H. and Gifford, D. K. (2017). Predicting the impact
of non-coding variants on DNA methylation. Nucleic
Acids Res., 45(11):e99.
A New Dimension of Breast Cancer Epigenetics - Applications of Variational Autoencoders with DNA Methylation
145
