
Investigation of a Multichannel Surface Electromyogram Analysis
Method Considering Superimposed Waveforms in a Elbow Flexion
Movement
Jun Akazawa
1
and Ryuhei Okuno
2
1
School of Health Science and Medical Care, Meiji University of Integrative Medicine, Nantan-shi, Kyoto, Japan
2
Faculty of Science and Engineering, Setsunan University, Neyagawa-shi, Osaka, Japan
Keywords: Surface EMG, Superimposed Signals.
Abstract: The purpose of this study was to develop a method of decomposing the surface motor unit acton potential
(SMUAP) of a biceps brachii short head muscle when the distance from the surface electrodes to the motor
units (MUs) changes during voluntary isovelocity elbow flexion. In the preparatory study, a subject’s elbow
flexion movement had changed the shape of the SMUAP, which was probably made by a single MU larger
than the previous study. Thus, we had to develop a SMUAP decomposition method that focused on tracking
the SMUAP waveform changes and superimposed signals. The developed SMUAP decomposition
algorithm was based on a sequentially modified template matching method, considering the superimposed
signals. This was applied to the measured SMUAPs. The MU firing rates calculated with our algorithm
were almost the same as those of previous physiological studies; our algorithm was capable of decomposing
SMUAPs when the waveform of the SMUAP was generated from a single MU and responded with each
change in firing time.
1 INTRODUCTION
In physiology and medicine, methods to investigate
the behaviors of motor units (MUs) are desired.
Studies have shown that high-density surface
electrodes are suitable for analyzing the
characteristics of MUs during isometric contraction
(Merletti and Parker, 2004).
Needle electrodes have been used to analyze the
motor unit acton potential (MUAP) behavior from
the tibialis muscle during ankle joint flexion [Kato,
Murakami, and Yasuda, 1985). However, needle
electrodes restricted the angle to a small range.
To solve this problem, we used multi-channel
surface electrodes to investigate the behavior of the
MU in the biceps brachii short head muscle. Our
results showed that the firing rates (FRs) of activated
MUs were almost the same when the degree of
elbow flexion varied from 0 to 120 degree;
additionally, surface MUAPs (SMUAPs) were
identified by visual observation (Okuno, Maekawa,
Akazawa, Yhoshida, and K. Akazawa, 2005). The
measured SMUAP waveforms changed gradually;
thus, it was difficult to perform SMUAP
decomposition quantitatively.
In this study, we developed an algorithm to
decompose the SMUAPs quantitatively during
voluntary isovelocity elbow flexion. This algorithm
was based on the similar shape of SMUAP
waveforms of a single MU extracted for a short
period during isovelocity movements (Akazawa and
Okuno, 2013).
Notably, in some subjects whose fat tissue was
thin, the shape of the SMUAP was most likely
generated by a single MU; in this case, the
waveform shapes changed, making it difficult to
decompose the SMUAPs. Thus, further adjustments
to the algorithm were required to address this issue.
Akazawa, J. and Okuno, R.
Investigation of a Multichannel Surface Electromyogram Analysis Method Considering Superimposed Waveforms in a Elbow Flexion Movement.
DOI: 10.5220/0006634901950200
In Proceedings of the 11th International Joint Conference on Biomedical Engineering Systems and Technologies (BIOSTEC 2018) - Volume 4: BIOSIGNALS, pages 195-200
ISBN: 978-989-758-279-0
Copyright © 2018 by SCITEPRESS – Science and Technology Publications, Lda. All rights reserved
195
2 METHODS
2.1 Experimental Setup
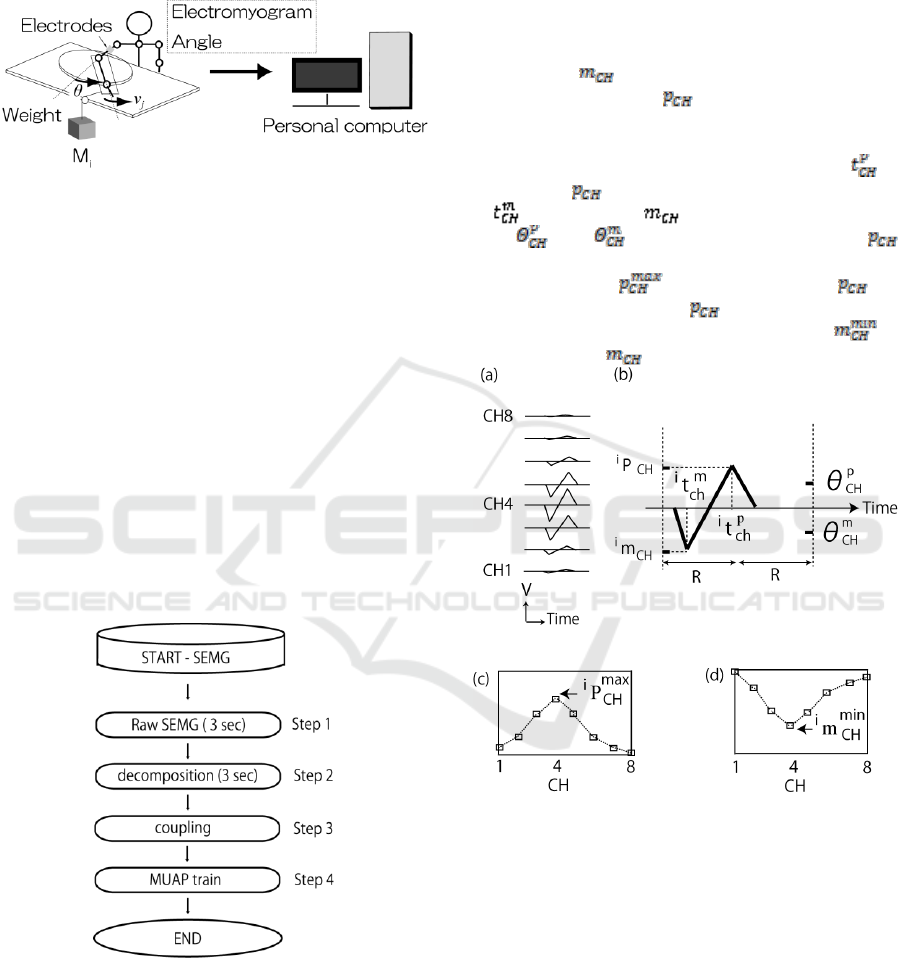
Figure 1: Schematic overview of the experimental setup.
A schematic diagram of the experimental setup is
shown in Fig. 1. The subject was instructed to flex
the elbow joint smoothly to approximately a 110°
angle at constant angular velocity (5°/s) against 10%
of the maximum voluntary contraction (MVC). The
experiments were performed with one healthy
subject, who gave informed consent. The
investigation was approved by the local Ethics
Committee of Meiji University of Integrative
Medicine.
An eight-channel surface electrode was used.
The surface electromyogram (SEMG) signals were
amplified with a gain of 80 dB. The band pass filter
was set at 43 Hz–2.8k Hz.
2.2 Algorithm
Figure 2: Algorithm to monitor motor unit (MU) activity
continuously over a sufficiently large range of motion.
The algorithm shown in Fig. 2 was developed
based on our previous method [Akazawa J., Okuno
R., 2013], with several modifications. The algorithm
steps are described below.
When identifying the action potential of a single
motor unit, we use the SMUAP Profile to extract the
characteristics of each SMUAP.
Fig. 3 shows the method for making the SMUAP
profile [Akazawa, Sato, Minato, and Yoshida, 2005].
The SMUAP profile consists of both plus and minus
amplitude components, because the minimum
potential (
i
) was sometimes larger than
maximum potential (
i
) from the preliminary
experiment. The eight-channel SEMG is shown in
Fig. 3(a). Fig. 3(b) shows the parameter for detecting
the SMUAP. The maximum potential at t =
i
is
denoted by
i
, and the minimum potential at t = t
=
i
is denoted by
i
. The threshold parameters
were and . In Fig. 3(c), the values of
i
were plotted against each channel to create a
SMUAP profile.
i
is the maximum of
i
. In
Fig. 3(d), the values of
i
were plotted against
each channel to create a SMUAP profile.
i
is
the minimum of .
Figure 3: Method for creating an SMUAP profile from
measured surface electromyogram (SEMG) signals.
Step 1:
In Step 1, the SEMG is measured for 30.0 s. The
SEMG is used to retain the MUAPs that belong to
the target MUAP and remove both the noise and
low-amplitude MUAPs that do not reach the given
thresholds.
Step 2:
We calculate the coincidence between SMUAP
profiles to decompose the SMUAPs. The
performance index (PI) characterizing the fitness
between two SMUAPs is given by Eq. (1):
BIOSIGNALS 2018 - 11th International Conference on Bio-inspired Systems and Signal Processing
196
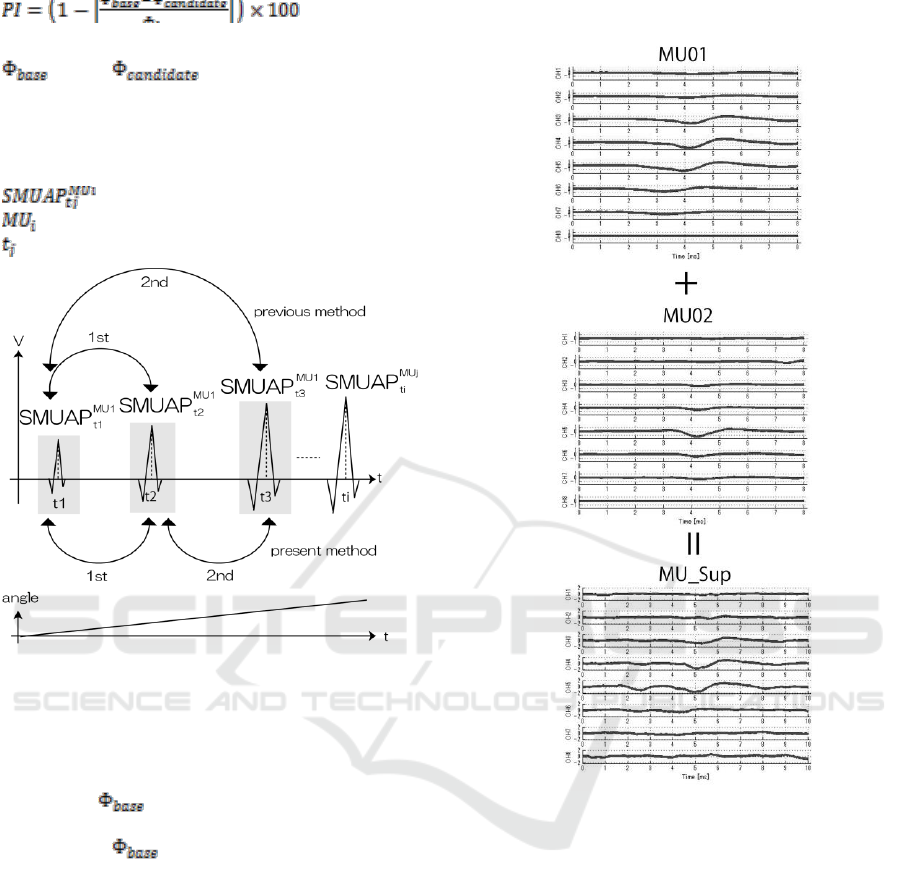
… (1)
If the PI is larger than the threshold value, then both
and are defined as generated by
a single MU. Both previous (Akazawa J., Okuno R.,
2013) and present decomposition methods are
shown at Fig. 4. The parameters are described as
follows.
: Potential distribution of the SMUAP.
: Number of the MU.
: firing time of the MU.
Figure 4: Surface motor unit action potential (SMUAP)
decomposition method: previous method versus present
method.
When the SMUAPs of a single MU were
decomposed in a previous study (Akazawa J., Okuno
R., 2013), did not change. In the present
study, we used a sequential method to account for
changes in . As such, our sequentially
modified template matching method was expected to
be more robust than our previous method (Akazawa
J., Okuno R., 2013)when the amplitude of the
SMUAP increases or decreases upon firing.
In Step 2, synthetic waveforms are created using
templates based on the single motor unit detected at
Step 2.
The difference between the waveforms of this
synthesized waveform and the measured
superimposed waveform are calculated and then
decomposed. As shown at Fig. 5, a superimposed
waveform is created by adding SMUAP of Motor
Unit 01 (MU01) and MU 02 which are single motor
units. Identification processing is performed by
calculating the difference between the waveforms of
the superimposed waveform and the measured
superimposed waveform.
Figure 5: Creation of superimposed waveform.
Step 3:
\In Step 3, coupling is used to connect the MUAP
trains (MUAPTs). As shown in Fig. 6, since the
muscle length changes, the time period of 30.0 s was
too long to decompose all of the SMUAPs at once.
Thus, short-period (3.0 s) signals were used. The
coupling period to connect the MUAPTs was set to
1.5 s.
To decompose the SEMG for 30.0 s, it was
necessary to merge each 3.0-s MUAPT. Fig. 6
shows a schematic diagram of this process. Each bar
represents one firing. Firings of the same MU were
aligned horizontally. Notably, at some points in Fig.
6, the firing time of MUAPT 1 was the same as in
MUAPT 2.
Investigation of a Multichannel Surface Electromyogram Analysis Method Considering Superimposed Waveforms in a Elbow Flexion
Movement
197
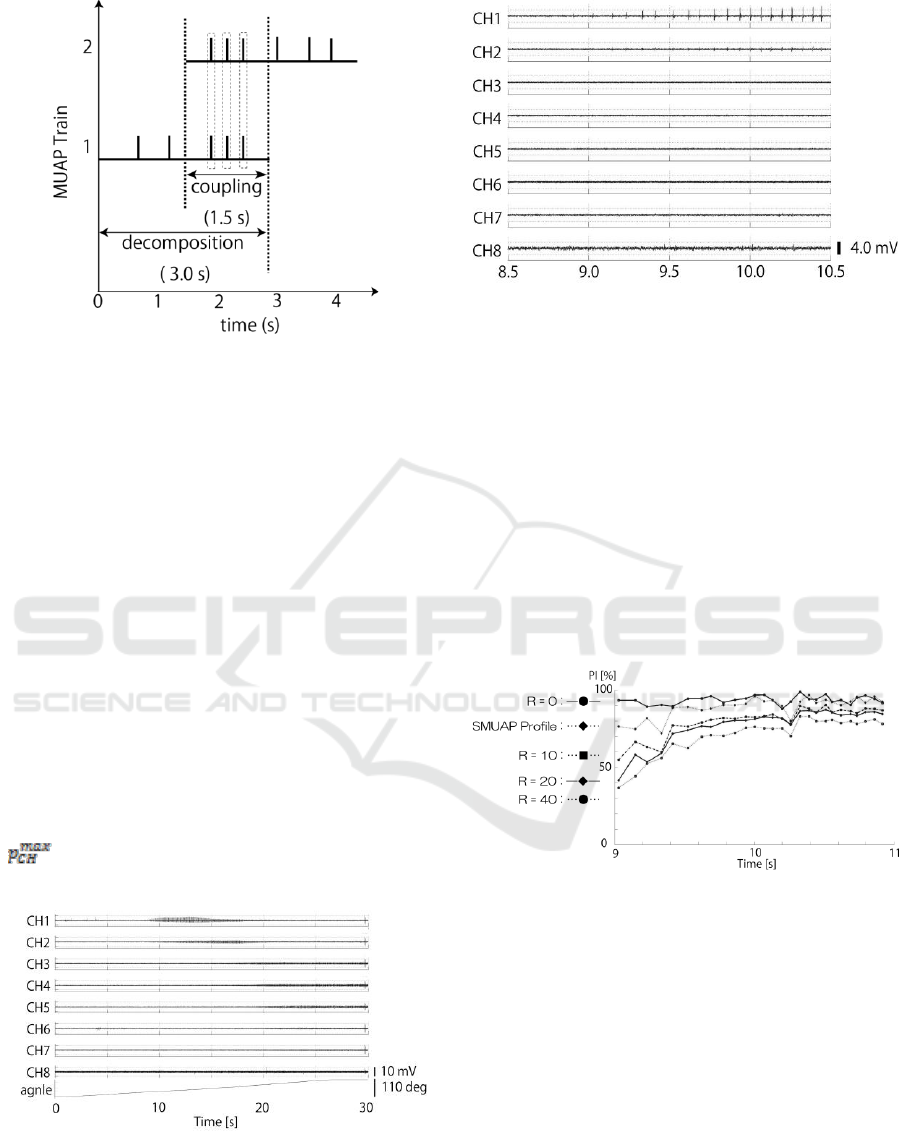
Figure 6: Schematic diagram for the coupling.
Step 4:
In Step 4, the firing patterns of all identified MUs
are plotted as MUAPTs to resolve the activity
patterns of the MU.
3 RESULTS
In this study, we instructed a normal subject to flex
the elbow joint from 0 to 110° against a constant
load torque of 10% MVC with an isovelocity of
5.0°/s. The SEMG signal was detected with an
electrode array from the biceps brachii short head
muscle. When the elbow joint angle reached 40° at 9
s, the active MU was observed.
As a subject flexed the elbow smoothly, the
SMUAPs that had a large amplitude at CH1 at 10 s
changed smoothly from a low channel number to a
high channel number. As the elbow angle increased,
i
moved from a small channel number to a
large channel number.
Figure 7: SEMG signals obtained from the biceps brachii
short head muscle during voluntary isovelocity elbow
flexion.
Figure 8: Extracting the SMUAP signals. The active MU
was observed from roughly 9 s.
Fig. 8 shows the extracted SMUAPs. Our algorithm
revealed that these SMUAPs were generated by a
single MU. On the left side of the figure, the
amplitude becomes larger over time; whereas on the
right side of the figure, the SMUAP retains the same
shape. Using our previously developed algorithm
(Akazawa J., Okuno R., 2013), we calculated the
rate of fitness between the two SMUAPs. The rate of
fitness decreased as a function of elbow flexion
angle because the SMUAP of a single MU changed
rapidly. Thus, it was necessary to improve the
previous decomposition method (Akazawa J., Okuno
R., 2013).
Figure 9: Relationship between the range and performance
index PI [%].
Fig. 9 shows the relationship between the range R
and the SMUAP profile used to extract the SMUAP
characteristics and the PI [%] calculated from the
difference of the two SMUAPs. When the range
changed from 10 to 40, the ratio increased from 9 to
10 s. On the other hand, when the range was set at 0,
PI held a nearly constant value.
BIOSIGNALS 2018 - 11th International Conference on Bio-inspired Systems and Signal Processing
198
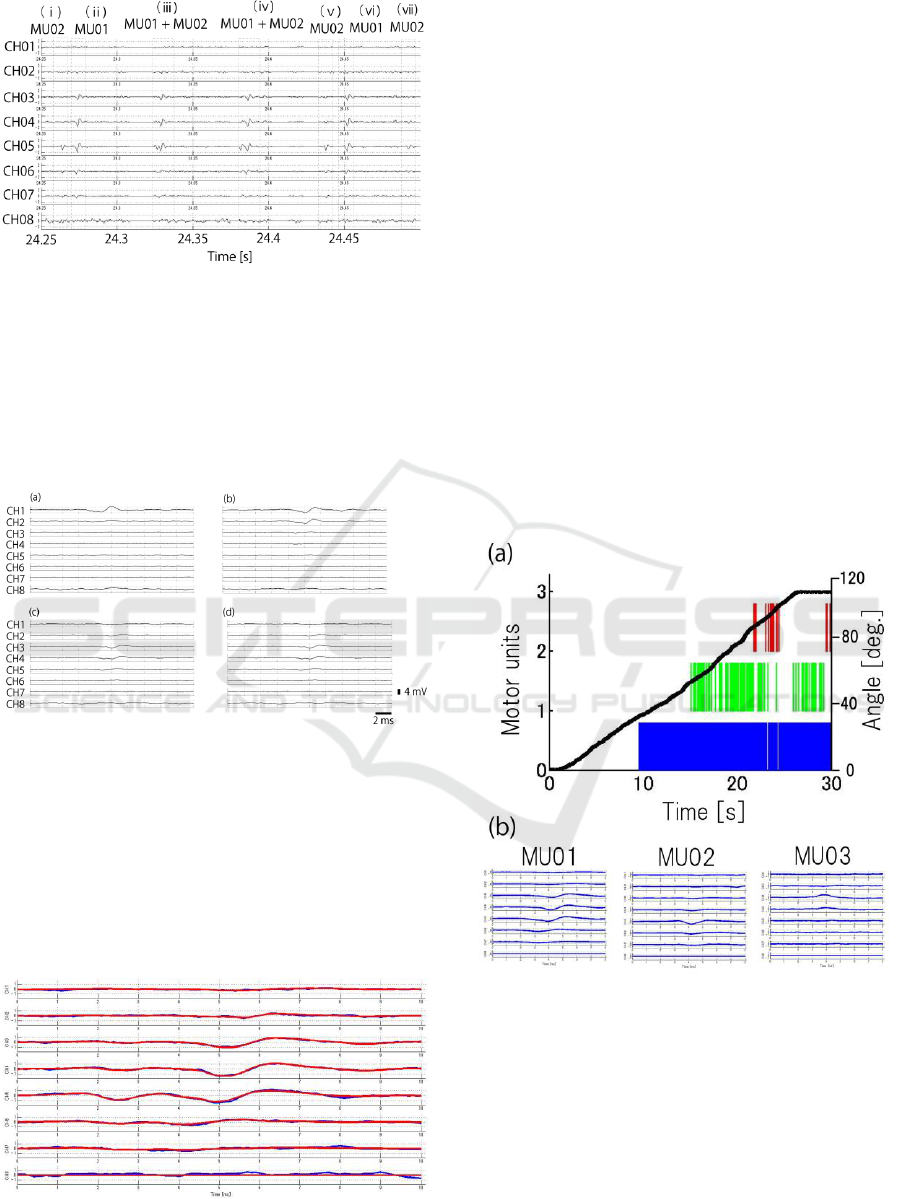
Figure 10: Our developed algorithm decomposed the MU
action potentials.
A typical SEMG record of biceps brachii muscle
(BIC) is shown in Fig. 10. To determine whether
SMUAPs were from the same MU, individual
SMUAP shapes (channels 1–8) shapes were
compared by the algorithm. We detected nine
SMUAPs from two MUs.
Figure 11: SMUAP wave shape of the MU01 observed at
four points.
Fig. 11 shows that the SMUAP waveform of MU01
changed during elbow flexion movement. The
SMUAP of the MU01 was observed at (a) 10, (b)
15, (c) 20, and (d) 25 s. These results confirmed that
our developed method continuously tracked the
SMUAP waveform changes during elbow flexion
movement.
Figure 12: Decomposition process of the superimposed
waveform.
Fig. 12 shows the result of the decomposition
process for the superimposed waveform using the
proposed method. The target was the signal of (iii)
in Fig. 8. The blue line waveform is a measured
SEMG, and the red line waveform is created by
synthesizing the template of MU 01 and MU 02. The
degree of coincidence of the waveforms was 73.93
%.
Fig. 13 shows the MUAPT in which the solid
lines correspond to the elbow joint angle (the
average velocity was approximately 5°/s); identified
firings of the nine MUs are shown. Each bar
represents one firing and firings of the same MUs
are aligned horizontally. The average frequency of
Motor Unit 01 (MU01) was 22.14 Hz and the
standard deviation was 18.46 Hz. The average
frequency of MU02 was 10.87 Hz, and the standard
deviation was 6.20 Hz, and the average frequency of
MU03 was 21.82 Hz, and the standard deviation was
7.18 Hz. MU01 and MU02 continued to fire for a
relatively long period of time. The results of
calculated MU’s FRs agree with the generally
accepted behavior of MU FRs.
Figure 13: MUAP Train.
4 CONCLUSIONS
In physiology and medicine, methods to investigate
the behavior of MUs are desired. We have
developed an algorithm to decompose SMUAPs
quantitatively during voluntary isovelocity elbow
flexion. However, in some subjects whose fat tissue
was thin, the shape of the SMUAP was most likely
Investigation of a Multichannel Surface Electromyogram Analysis Method Considering Superimposed Waveforms in a Elbow Flexion
Movement
199

generated by a single MU and, as such, did not
retain the same shape. For this reason, we modified
our original SMUAP decomposition method to focus
on tracking changes in the SMUAP waveform. The
newly developed algorithm used a sequentially
modified template matching method, based on
superimposed SMUAPs, to calculate the FRs of
MUs. Our results showed that the FRs were nearly
the same as those cited in previous physiological
studies. Thus, the algorithm proposed is expected to
be useful for decomposing SMUAPs when the shape
of SMUAPs are generated from a single MU and
change with each firing.
ACKNOWLEDGEMENTS
This work was supported by JSPS KAKENHI Grant
Numbers 26350678.
REFERENCES
Merletti, R. and Parker P., Eds., 2004, Electromyography
Physiology, Engineering, and Noninvasive
Applications. Piscataway, NJ: IEEE Press.
Kato M., Murakami S., Yasuda K., 1985. Behavior of
single motor units of human tibialis anterior muscle
during voluntary shortening contraction under constant
load torque. Exp Neurol., vol. 90(1), pp. 238-53.
Okuno R., Maekawa K., Akazawa J., Yhoshida M., and
Akazawa K., 2005. Motor Unit Activity in Biceps
Brachii Muscle during Voluntary Isovelocity Elbow
Flexion. IEICE transactions on information and
systems, E88-D(6), pp. 1265-1272.
Akazawa J., Okuno R., 2013. A Method for Quantitative
SEMG Decomposition and MUAP Classification
during Voluntary Isovelocity Elbow Flexion, IEEE
EMBS, 35th Annual International Conference of the,
pp.6776-6779, Osaka, Japan
Akazawa J., Sato T., Minato K., and Yoshida M., 2005.
Method of estimating location and territory of motor
units in human first dorsal interosseous muscle with
multi-channel surface electromyograms,” JSMBE, vol.
43(4), pp. 595-604., Dec., 2005. (in Japanese)
BIOSIGNALS 2018 - 11th International Conference on Bio-inspired Systems and Signal Processing
200
