
Statistical and Combinatorial Analysis of the TOR Routing Protocol
Structural Weaknesses Identified in the TOR Network
Eric Filiol
1
, Nicolas J.
1,2
and Maxence Delong
1
1
Laboratoire de Virologie et de Cryptologie Op
´
erationnelles, ESIEA, Laval, France
2
Department of Defense, Paris, France
Keywords:
TOR Network, Routing Protocol, Power Law, Anonymity Network.
Abstract:
In this paper, we present the results of a deep analysis of TOR routing protocol from a statistical and combi-
natorial point of view. We have modeled all possible routes of this famous anonymity network exhaustively
while taking different parameters into account with the data provided by the TOR foundation only. We have
then confronted our theoretical model with the reality on the ground. To do this, we have generated thousands
of roads on the TOR network and compared the results obtained with those predicted by the theory. A last step
of combinatorial analysis has enabled us to identify critical subsets of Onion routers (ORs) which 33%, 50%,
66% and 75% of the TOR trafic respectively depends on. We have also managed to extract most of the TOR
relay bridges which are non public nodes managed by the TOR foundation. The same results as for the ORs
have been observed.
1 INTRODUCTION
The various computer networks such as the Internet
today allow everyone to have many means of com-
munication. However, this access is only possible if
the user has an IP address. This condition therefore
allows entities that have access to the network flows,
to analyze it and thus to retrieve information about
particular users.
When communicating in a secure and anonymous
manner, it is necessary to protect not only the con-
fidentiality of information (NATO’s COMSEC) but
also to protect the communication channel (NATO’s
TRANSEC) in order to reduce the risk of a targeted
attack (Defense Science Board, 2015).
Communities have been formed to defend the ano-
nymity of each other and have developed networks
whose purported purpose is to enable people to na-
vigate without anyone being able to identify the ori-
gin and destination of the communication. These net-
works therefore seem to be an ideal tool for criminals
and terrorists of all kinds, as they can carry out their
actions with little trace.
The purpose of this article is therefore to study a
particular network of anonymization, both for clients
and services: The Onion Router (TOR for short). Its
purpose is to protect the confidentiality, integrity and
availability of exchanges within its organization. This
network relies on a community that uses a particular
network protocol. The open source code is documen-
ted, but many aspects such as route construction are
only briefly documented. This is contrary to the prin-
ciples of security, since TOR’s security of this net-
work is based on a considerable amount of obscurity
and secrecy. Therefore, would it be possible for an at-
tacker who controls a limited number of routers to be
able to control and impact a significant part of the traf-
fic and hence more or less would be able to damage
TOR’s security?
Our study of the architecture and functioning of
this network has focused on TOR’s routing protocol.
We have established a theoretical statistical model of
this network, based solely on information provided
by the Tor Foundation (TOR Foundation, 2014b) and
the deep analysis of the TOR source code. We have
shown that the statistical law governing the route ge-
neration is a power law and not a normal or uniform
law, the latter laws being more compatible with the le-
vel of security claimed for such a network. The analy-
sis of a large number of routes via the Tor network has
confirmed the validity of our model. In a second part,
the analysis of this problem from the point of view of
graph theory and sub-problems of optimal paths and
vertex cover has made it possible to identify particular
reduced subsets of nodes on which a large proportion
of the TOR traffic depends. Taking control of these
Filiol E., J. N. and Delong M.
Statistical and Combinatorial Analysis of the TOR Routing Protocol - Structural Weaknesses Identified in the TOR Network.
DOI: 10.5220/0006634705070516
In Proceedings of the 4th International Conference on Information Systems Security and Privacy (ICISSP 2018), pages 507-516
ISBN: 978-989-758-282-0
Copyright
c
2018 by SCITEPRESS – Science and Technology Publications, Lda. All rights reserved

nodes by an attacker could significantly damage the
security of the TOR network.
The paper is organized of follows. Section 2
shortly presents what the TOR network is and how it
works. Then Section 3 presents our statistical analy-
sis of the TOR routing protocol. Section 4 refines our
results through a combinatorial analysis. Before con-
cluding in Section 6, we discuss in Section 5 how our
results may impact the TOR general security. All data
related to this study are publicly available on (Filiol
et al., 2017).
2 DESCRIPTION OF THE TOR
PROTOCOL
The TOR project is a complex architecture and due
to lack of space we will only give a brief des-
cription of its structure and how it works, for the
paper to be self-contained. The interested reader
will find detailed information in (TOR Foundation,
2014b; TOR Foundation, 2014d; TOR Foundation,
2014a).
The Tor Project Inc. is a non-profit foundation loca-
ted in Massachusetts. It was founded in December
2006 by seven computer scientists, including Roger
Dingledine and Nick Mathewson. It is primarily re-
sponsible for software maintenance — including the
Tor Browser and Tail — for the Tor anonymous net-
work.
The Tor protocol is directly derived from a pro-
ject developed within the United States Naval Rese-
arch Laboratory in which Paul Syverson participated
(Goldschlag et al., 1996; Syverson et al., 1997). Its
purpose was to provide the armed forces with a net-
work that provided TRANSEC and COMSEC. The
Tor project was born in 2004 thanks to this labora-
tory which opened the source code and provided the
necessary funding. Today the organization is funded
by donors and government agencies, including the US
Department of State Bureau of Democracy and the
German Federal Foreign Office (see (Delong et al.,
2018) for a deep OSINT analysis of the Tor project
and foundation).
2.1 TOR Architecture
The Tor network consists of about 12,000 routers di-
vided into two families, relays and bridges. The Tor
Foundation publishes almost all the information in the
first category, and quite nothing for the second cate-
gory in order to prevent a state from denying access to
the network because it does not have the IP addresses
of these hidden nodes.
The Tor network is organized into several levels
where routers have multiple roles. These depend on
the trust placed in them by the network, which is par-
ticularly dependent on the time of activity. The diffe-
rent roles by level are:
• Four Authority levels are identified:
– Nine Directory authorities and Bridge authori-
ties. They list all the routers — relays or brid-
ges — in the network, analyze the bandwidth,
assign them a particular weight — depending
on age, bandwidth and stability. They also as-
sign specific roles to routers and establish, sign
and publish a document called consensus file.
The IP addresses of these servers are listed di-
rectly in the source code of TOR.
– Directory caches that download authorities’
data to cache them for distribution to customers
who request them.
– Fallback directory mirrors which are cache ser-
vers whose IP addresses are also written in the
code. They allow clients to download the con-
sensus file during initialization connection.
– HSDir which are servers equivalent to the Inter-
net DNS servers. They hold the information to
contact a hidden service such as the addresses
of the introduction points, defined below.
• For the TOR routers:
– the Exit node is the third router of a circuit in-
tended to transmit the network stream to the In-
ternet.
– the Non exit node is a router that only processes
incoming or internal flows in Tor.
– the Entry node is the first router to which a
client addresses itself to go through Tor.
– the Guard node is an input router to the Tor net-
work. It also has the role of non exit router and
can therefore process internal network flows.
– the Bridge node (TOR Foundation, 2014d) is a
router whose information is only partially pu-
blished and whose purpose is to allow custo-
mers to bypass censorship. Currently, they are
acting as entry routers. As for this particu-
lar class, we have developed an automatic ex-
traction procedure which is non public. At the
present time, a first list of more than 2,500 brid-
ges (on a total number of 3,000-3,500) have
been extracted (Filiol et al., 2017) as well as
many information about the way bridges are
managed behind the scene. Recently the Tor
foundation has increased the number of bridges
but this does not change anything with respect
to our extraction procedure.

• To provide services within the network:
– The hidden service is a server that will only
accept incoming connections through a parti-
cular protocol. The initiators of the connection
will not be able to learn the IP address of the
service in order to preserve its anonymity.
– The introduction point is a router (relay type)
connected to a service hidden by a particu-
lar circuit and which allows a client to submit
an appointment request for establishing a con-
nection.
– The rendezvous Point is a router (relay type)
that connects two independently built circuits,
one by a client and the other by a hidden ser-
vice to allow end-to-end exchanges.
2.2 TOR Protocol Description
The Tor protocol manages two types of communica-
tions, either to the Internet network (external circuits,
three routers) or to its internal network (internal cir-
cuits, six routers) through which an end-to-end flow
will be exchanged between a client and a server.
To build TOR routes (or circuits), clients and servers
of the Tor network build routes consisting of three
second level routers. A route consists of an entry rou-
ter, a relay non-exit router and a relay specific router
depending on the type of communication.
From the client, the connection to the third server is
either to an exit relay (connection to the Internet) or
any relay (connection with a hidden service). In this
latter case, a special protocol is used to establish the
junction between two independently constructed cir-
cuits that meet at a point called rendezvous point (or
RP).
3 STATISTICAL ANALYSIS OF
THE TOR ROUTING
PROTOCOL
We essentially focuses on the public routers in the rest
of the papers (external circuits). As far as bridges are
concerned, it is sufficient to say that we have obtained
similar results (6-node circuits) as for public routers.
Other information are not public.
3.1 Consensus and Details Files
The Tor routing protocol relies on the consensus file
which contains all the available TOR routers
1
. It is
1
The file can be downloaded on https://metrics.
torproject.org/collector.html
renewed every hour. It is downloaded by the Tor pro-
tocol during each first communication and then every
two hours. This file is created, signed and published
by the authority routers. It is also possible to retrieve
enriched information, including probabilities by rou-
ter type, by downloading the details file
2
. Essential
information we need is:
• the router name and its fingerprint (in fact the
SHA-1 value of its public key).
• IP address with useful ports.
• Router role and type.
• A weight called consensus weight which is voted
by the authority servers and depends in particular
on the bandwidth.
• Probabilities of choosing this type of router
(guard, middle, exit) when establishing a route.
• An exit policy when the router belongs to the exit
type as well as the ownership family, i. e. all
the routers that belong to the same owner. This
is provided by the latter if he wishes.
• A published bandwidth.
A very first analysis (see Figure 1) clearly shows that
the distribution of routers is far from being uniform
and exhibits a wide dispersion. In the minds of the
Figure 1: middle router probability distribution.
general public, the choice of each router is made rand-
omly. This popular belief is false insofar as it implies
that each node has the same probability of being cho-
sen.
It remains to determine how the Tor protocol uses the
weight assigned to a router when selecting a node of
a circuit (TOR Foundation, 2014c). First, it will use
a random value (use of the OpenSSL library) and is
considered to be of quality.
Building a circuit requires the choice of three sepa-
rate routers. In the case of an external route, the pro-
tocol will have to choose a guard, a middle and a exit
node. To make this choice, the protocol groups rou-
ters by type. If necessary, it eliminates routers that
2
https://metrics.torproject.org/onionoo.html

are not specification-compliant. Then, it computes the
different sums of the weights and chooses a random
value r between 0 and this sum. Finally, it scrolls
through the list of the type considered by summing
weights up to i-th rank such as
∑
j=i−1
j=0
weight
j
< r
and
j=i
∑
j=0
weight
j
> r.
This choice is not a priori questionable since it
weighs certain routers according to their stability, du-
ration of network activity and available bandwidth.
However, this weighting is already partly undermi-
ning the supposed equiprobability. After this first ob-
servation, it is important to study the extent to which
this particular weight influences possible choices. In-
deed, if it is possible to favor certain routers, it is the-
refore possible for the Tor foundation to restrict the
choice of routers to particular subsets.
3.2 Theoretical Statistical Model
Since the open source code of Tor is very large and
complex, we first implement the automatic extraction
of all relevant data the writing of routers given by
the details file and to analyze them. It has then been
possible to find the links between probabilities and
weights. Indeed, if we sort the routers by type guard,
middle, exit, it appears that we have a constant ratio:
consensus weight
router
probability
router
= C
router type
The constant value C
router type
depends on the router
type as follows:
• guard nodes:
C
guard
=
∑
i∈guards
consensus weight
i
;
• middle nodes with guard flag set:
C
middle guard
=
C
guard
×C
middle guard
C
guard
−C
middle guard
• middle nodes without any flag set:
C
middle seul
=
1
2
∑
i∈middles
consensus weight
i
;
• exit nodes:
C
exit
=
∑
i∈exits
consensus weight
i
;
Moreover, we established other relationships between
those values:
C
guard
≈
C
middle guard
+C
middle seul
2
C
middle guard
≈C
middle seul
×(1 +
√
2)
All these relationships have been used to calculate the
probability of choosing the next router knowing the
choice of the precedent ones. Indeed, the specifica-
tions of the Tor network require that two routers on
the same circuit do not belong to the same x.y.z.w/16
subnetwork (class B) as well as to the same (Johnson
et al., 2013) family. Finally, the Tor network seeks to
optimize its own workload. This is why the consen-
sus files are established every hour in order to change
these weights by router. This has the effect of influen-
cing client choices. Let us precise that a highly multi-
threaded implementation enables to process any new
version of the consensus file in less than 5 minutes
(around 10 billions of possible routes).
In order to synthetize all these information and build
our model, we used the following procedure:
1. Get the details file.
2. Count the router numbers (relay and bridges).
3. For the relay family, sort routers according to their
type (guard, middle, exit) with respect to their
weight.
4. For bridge routers as well as for nodes in the third
position of an internal circuit, calculate an empiri-
cal probability and then sort all the routers in each
category with respect to it.
5. Calculate the sum of weights or probabilities on
parts of each type.
The results obtained show that the impact of weight is
not negligible. Indeed, in the case of middle and exit
routers, the probability of choice follows a power law
that favors a minority since about 80% of the total
weight is given to 20% of the nodes. The detailed
mathematical results are given in Appendix.
It is therefore possible, with a good probability, to
restrict the study of Tor routes to a part of them by
considering only sub-sets of each type (Table 1).
After having determined the predominant para-
meter in the choice of routers and knowing the con-
straints imposed in the construction of a circuit, it is
possible to generate all the routes and to accumulate
for each router the conditional probabilities of being
chosen given the circuit. By noting K the routers of
a type which is compatible with the previous nodes,
W
k
the weight of router k and C
K
the constant of the
type considered, the probability P
i
of the router i ∈ K
is computed as follows:
P
i
=
W
i
C
K
The cumulation of these probabilities gives an occur-
rence for each of the roles for each router. The results
of these occurrences for approximately 1 billion and
10 billion generated external circuits are presented in

Table 1: Fraction of ORs involved in different percentage of the Tor routes/traffic.
Proba Guard fraction Middle fraction Exit fraction Number of routes
50% 1/2 81,6% 1/4 78,1% 1/4 78% 308 millions
66% 1/2 81,6% 1/3 85,5% 1/2 95,5% 823 millions
75% 2/3 91,0% 1/3 85,5% 1/2 95,5% 1,1 billion
100% All 100% All 100% All 100% 9,9 billions
Appendix. A second important parameter is the num-
ber of routes to which a router may belong. Indeed,
some routers may belong to fewer circuits than ot-
hers but this difference is compensated by the weight.
Conversely, some nodes may belong to all roads but
are downgraded because of their low weight.
3.3 Testing of the Statistical Model
Our theoretical model must now be compared with
what is observed within the Tor network in order to
validate it or not. In order to have a representative
sample with a margin of error of 1% and a confi-
dence level of 99%, we must consider at least 16,500
TOR routes. We wrote a python script, using the Stem
library developed by the Tor foundation. We have
then extracted more than 60,000 routes considering
a change of the router of entry or not
3
.
The comparison between the results obtained from the
data extracted and processed by the algorithm and all
generated routes validates our model. Figure 2 repre-
sents the occurrences obtained for the different types
of routers when generating routes and shows that, ac-
cording to the established model, they follow a power
law. Therefore, the weight assigned to each router is
the parameter that influences the choice made by the
protocol (see Table 2). It is also important to look at
the case of internal circuits (used to access to hidden
services). In this case, the probability of the third rou-
ter on the circuit cannot be established directly from
the data provided by the Tor foundation. It was the-
refore necessary to identify the proportions of each
type of router (guard, middle, exit) positioned in third
position. Thus, it became possible to determine the
constants necessary for calculating probabilities simi-
larly to what was found for an external circuit since
the probabilities of the third routers verify the equa-
tion:
∑
i∈guard
poids
i
C
guard
+
∑
i∈middle
poids
i
C
middle
+
∑
i∈exit
poids
i
C
exit
= 1
The statistical analysis of the 60,000 routes revealed
the following fractions for router types: about
4
7
are
3
By default, the configuration freezes the entry router
during connection initialization for a period of two to nine
months
of Guard type, about
5
28
are Middle routers and about
1
4
are Exit nodes. These results are empirical but they
identify the significant proportions of relay routers to
be considered in the calculation of routes in the case
of a study of internal circuits. Similar to external ci-
rcuits, the study of routes can be restricted to subsets
of nodes (see Table 3). It is important to note the ratio
— in the order of 30 — that exists between the total
number of routes and the number that we can study
while considering 50% of the traffic. Finally, we have
compared the observed and theoretical rankings of
each router type according to the number of occur-
rences. The theoretical and observed results are not
exactly identical but are very close. In other words,
each ranking shows the same list for the most used
routers in a slightly different order. This may be due
to the fact that theoretical computation are made from
the details file while the route generation took about
two days. As a result, the weighting of each router
may have slightly evolved during the votes in order
to homogenize flows within the network. In addition,
the study was conducted on a small but representative
sample size but it is acceptable that on a large num-
ber of simulations, the results would converge to the
theory.
4 COMBINATORIAL ANALYSIS
OF THE TOR ROUTING
PROTOCOL
The statistical approach has enabled the development
of a model that has highlighted subsets of important
routers within the Tor network through which a sig-
nificant portion of traffic transits. However, it is pos-
sible to refine these subset if the network is modeled
differently. Indeed, the previous study of routes has
focused only on routers and not on the links between
nodes. The purpose of this section is therefore to ana-
lyze how these links can favor some routes over ot-
hers. This will also reveal that significant fractions of
the flow are managed by a particular subset of nodes.
Without loss of generality, this new model deals with
at external circuits only and when the input router is
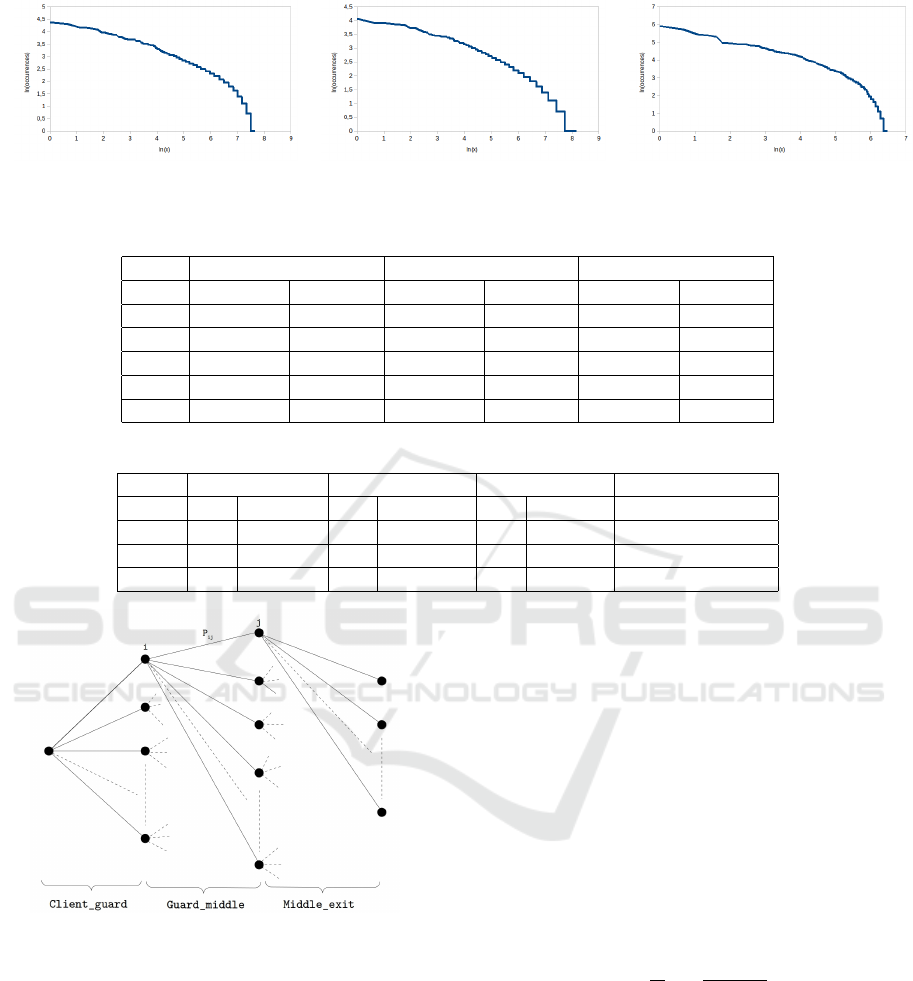
Figure 2: Observed frequencies of router types (guard on the left, middle in the center and exit on the right) with a log-log
scale.
Table 2: Comparison of the theoretical model and the TOR reality.
Guard Middle Exit
Ratio Theorical Virtually Theorical Virtually Theorical Virtually
1/4 58,16% 56,44% 78,1% 78,36% 78,01% 77,82%
1/3 67,40% 68,82% 85,49% 85,24% 86,22% 87,09%
1/2 81,59% 81,68% 94,05% 94,47% 95,53% 96,14%
2/3 91,02% 90,51% 98,44% 98,90% 98,98% 99,13%
3/4 94,29% 93,70% 99,35% 99,64% 99,66% 99,64%
Table 3: Fraction of ORs involved in different percentage of the Tor routes/traffic for internal circuits.
Proba Guard fraction Middle fraction Relay fraction Number of routes
50% 1/2 81,6% 1/4 78,1% 1/4 81,1% 2,7 billion
66% 1/2 81,6% 1/3 85,5% 1/2 95,5% 7,2 billion
75% 2/3 91,0% 1/3 85,5% 1/2 95,5% 9,6 billion
100% All 100% All 100% All 100% 86,6 billion
Figure 3: Graph model for the Tor routing protocol.
a guard. Additional results can be obtained by con-
tacted the first author.
We modeled the network as a graph (Figure 3) to ana-
lyze the problem from a combinatorial perspective.
Initially, the vision in vertex cover seemed to be the
right solution, but given the weightings that cannot be
taken into account effectively in this type of problems,
we opted for an optimal path search. The purpose
of graph modeling is to try to determine a relations-
hip between the links guard-middle and middle-exit.
Thus, routers are represented by vertices and the links
by edges, the latter being characterized by a weight.
The calculation of these weights was a real difficulty,
since it had to reflect the previous results obtained
while being sufficiently discriminating to extract a
particular relationship between the guard-middle and
middle-exit links. The weight considered here is the-
refore a function of the number of routes that use this
link as well as the weight of the destination routers.
Indeed, previous calculations have shown that these
two factors are predominant.
Let us note N the number of routes using edge i → j
(Figure 3), K the set of all destination routers which
are compatible with the source router i and p
k
the
weight of the router k. The the weight P
i j
of the edge
i → j is computed as follows:
P
i j
=
1
N
n=N
∑
n=1
p
j
∑
k∈K
p
k
Since each i → j edge has its own weight of P
i j
, we
calculate the ratio between the total sum of the weig-
hts of the links guard-middle and the total sum of the
links middle-exit. This ratio is taken as a reference to
calculate the proportions of each type of routers. In
this case, the ratio is about three.
Therefore, in order to determine a subset of exit rou-
ters, it will be necessary to determine a subset of
middle routers and then calculate the total weight of
the links guard-middle considered (the determination

Figure 4: Algorithm description for router links analysis.
of the middle nodes leads to the determination of the
guard nodes). In our case, we consider the stron-
gest links. Then, to determine the totality of the exit
routers, the total weight of middle-exit links is de-
ducted from the one obtained above and, considering
the most favorable links, the weights of the latter are
summed until they obtain a value approaching that
calculated (Figure 4).
This modeling has enabled to refine the number
and identity of routers of each type that manage a sig-
nificant proportion of the Tor traffic (Table 4) These
Table 4: Number of top-significant routers per percentage
Tor traffic.
Fraction Guard Middle Exit Total
33% 755 899 166 1065
50% 1030 1217 246 1463
66% 1326 1617 342 1959
75% 1507 1882 425 2307
results thus refine the ratios between the guard-middle
and exit types. Tables 1, 2 and 3 did not take into ac-
count the ratio calculated here. Finally, the route ana-
lysis confirms the ratio found between the number of
routers in the middle node and the number found in
the exit node subsets. Indeed, for three samples of
about 5,000 routes in which the input router is fixed
— according to the default configuration — as well
as for a sample of the same size in which there is an
input node rotation, the number of routers per type is
given in Table 5.
Table 5: Number of top-significant routers for basic confi-
guration.
Guard Middle Exit
Sample 1 (4920) 1 2123 475
Sample 2 (4915) 1 2085 488
Sample 3 (4865) 1490 1976 478
5 DISCUSSION ABOUT THE TOR
SECURITY
Results presented in Section 4 (especially Tables 4
and 5) prove that it is enough to target a reduced
subset of nodes (only 1,463 nodes (1,217 middle, of
which 1,030 guards and 246 exits) to control 50% of
the traffic in Table 4) . The interest for an attacker to
identify these routers lies in the fact that it can take
control of them and then analyze the traffic to corre-
late the flows (Johnson et al., 2013). Thus, it would
be able to remove the anonymity of users — clients
and hidden services — by tracking packets end-to-end
through special patterns identified or set up in the pac-
kets. It seems that the FBI operated in this way when
it dismantled the silk road in 2014 (TOR Foundation,
2015). The list of subsets we have identified is avai-
lable in (Filiol et al., 2017). Similarly, in the case of
internal circuits as well as in the case where the in-
put router is a bridge, it is possible to identify similar
subsets.
These node subsets of higher interest are then privi-
leged targets for DDoS (mandatorily from outside the
Tor network) or coordinated targeted malware attacks.
Therefore, it is interesting to carry out a security ana-
lysis of the ports and services which are opened for
each of them, since they can constitute potential en-
try points (a vulnerability scan to look for 0-day vul-
nerabilities is also a required step). We have used a
massive scan tool designed in our lab to analyze top
significant routers involved in 50% of the Tor traf-
fic, as well as the first thousand ports and a few ot-
her frequently used ones. Table 6 summarizes the re-
sults. The results show that two thirds of routers have
Table 6: Open ports for top significant routers controlling
50% of Tor traffic.
Port 21 22 23 25 53
Number 70 631 17 573 121
Fraction (%) 4.7 42.1 1.1 38.2 8.1
Port 80 109 110 135 139
Number 843 3 64 561 561
Fraction (%) 56.2 0.2 4.3 37.4 37.4
Port 443 445 1133 1134
Number 811 577 10 7
Fraction (%) 54.1 38.5 0.7 0.5
open ports because they also serve as SSH, SMTP,
DNS, HTTP, POP, HTTPS servers. In addition, many
routers have open ports that expose them particularly
well. Ports 135,139 and 445 are of high interest for
attackers. In addition, these ports are possible targets
that can be overwhelmed by syn flooding attacks. This
will cause a significant evolution of the consensus file,
which may then favor some potentially trapped rou-

ters. Indeed, during the vote, the authorities will me-
asure a low bandwidth.
As far as bridge routers are concerned, a corrupted
machine in middle position could count the number
of network frames it is relaying when constructing a
circuit. It could then determine its own position and
hence compare the IP address of the machine right be-
fore its own position with those listed by the founda-
tion. It would enable to determine whether the input
router is a bridge or not. In order to prevent such an
attack, it is envisaged to always insert a guard router
between the bridge and the middle router. Thus, hid-
den nodes would be drowned within network users.
6 CONCLUSION
Our study tends to prove that the security of the Tor
network is not optimal. Indeed, since overall security
is based on the individual good practices of the router
owners, the maximum level that will be reached will
not exceed that of the weakest link. The latter can also
be set up voluntarily to identify particular users.
It is also important to note that local security (of no-
des and servers, protocol strength...) is not sufficient
as soon as we deal with a worldwide infrastructure.
Having a more global and higher point of view is also
important. In this respect, our study has showed the
Tor infrastructure too much relies actually on a redu-
ced number of nodes.
Our future work will mostly focus on two aspects.
First, we intend to optimize our multi threaded con-
sensus file processing algorithm. The aim is to be
able to process any new version of such file and ex-
tract top significant node subsets within less than one
minute. Second to go on working on the bridge mana-
gement and its evolution and to refine our extraction
algorithm.
REFERENCES
Alstott, J., Bullmore, E., and Plenz, D. (2014). Powerlaw:
A Python Package for Analysis of Heavy-Tailed Dis-
tributions. PLoS ONE, 9:e85777.
Clauset, A., Shalizi, C. R., and Newman, M. E. J. (2009).
Power-law distributions in empirical data. SIAM Rev.,
51(4):661–703.
Defense Science Board (2015). Study on 21st century
military operations in a complex electromagnetic en-
vironment. Office of the Under Secretary of Defense
for Acquisition, Technology, and Logistics. http://
www.acq.osd.mil/dsb/eports/2010s/DSB SS13–
EW Study.pdf.
Delong, M., Fatou, O., Filiol, E., Coddet, C., and Suhard, C.
(2018). Technical and osint analysis of the tor project.
In ICCWS’2018.
Filiol, E., Delong, M., and J., N. (2017). Results of the
tor routing protocol statistical and combinatorial ana-
lyses. http://cvo-lab.blogspot.fr/2017/09/preliminary-
results-on-tor-routing.html. Accessed: 2017-09-12.
Goldschlag, D. M., Reed, M. G., and Syverson, P. F. (1996).
Hiding Routing Information. In Anderson, R., edi-
tor, Proceedings of Information Hiding: First Inter-
national Workshop, pages 137–150. Springer-Verlag,
LNCS 1174.
Johnson, A., Wacek, C., Jansen, R., Sherr, M., and Syver-
son, P. (2013). Users get routed: Traffic correlation
on tor by realistic adversaries. In Proceedings of the
2013 ACM SIGSAC Conference on Computer &
Communications Security, CCS ’13, pages 337–348,
New York, NY, USA. ACM.
Syverson, P. F., Goldschlag, D. M., and Reed, M. G. (1997).
Anonymous connections and onion routing. In Pro-
ceedings of the 1997 IEEE Symposium on Security
and Privacy, SP ’97, pages 44–, Washington, DC,
USA. IEEE Computer Society.
TOR Foundation (2014a). Tor documentation. https://
www.torproject.org/docs/tor-manual.html.en. Acces-
sed: 2017-09-12.
TOR
Foundation (2014b). Tor project. https://gitweb.
torproject.org. Accessed: 2017-09-12.
TOR Foundation (2014c). The tor project. https://
www.torproject.org/docs/tor.git. Accessed: 2017-09-
12.
TOR Foundation (2014d). Tor specifications. https://
gitweb.torproject.org/torspec.git. Accessed: 2017-09-
12.
TOR Foundation (2015). Did the fbi pay a university
to attack tor users? https://blog.torproject.org/
did-fbi-pay-university-attack-tor-users. Accessed:
2017-09-12.
APPENDIX
Statistical Model for the TOR Routing
Protocol
The results obtained seem to indicate that the distri-
bution of TOR routes follows a power law distribu-
tion (general case including Pareto, Zipf, Mandelbrot
laws). We will limit ourselves to the discrete case
(however, when the number of data is large enough
—which is our case — it is possible to work with the
continuous version of this law (Clauset et al., 2009).
For more detailed information of these laws the reader
can refer to (Clauset et al., 2009; Alstott et al., 2014)
we also used for statistical analysis.

A discrete variable X follows a Power law if its
probability density is given by
p(x) = P[X = x] = C.x
−α
where α is a constant parameter called power para-
meter of the law and C is the proportionality factor.
In practice, most of the phenomena obey a power law
for some x ≥ x
min
. The constant C is given by the
value x
min
using the fact that
Z
∞
x
min
p(x)dx = 1
This results in C =
α−1
x
−α+1
min
On a graph with logarithmic scales (log-log repre-
sentation), the graph of a power law is a line since
when noting y = P[X = x] we can write
log(y) = α. log(x) + log(C)
Another useful representation is the inverse of the
so-called cumulative cumulative distribution function
(P[X[X > x] = 1 − F(x)). This is the one we will
use here to compare the theoretical law obtained
with the empirical law of data. In the following
we will limit ourselves to the estimation of the pa-
rameters α (maximum likelihood method, validation
by the Kolmogorov-Smirnov adequacy test) and x
min
(exhaustive estimation on all the values minimizing
the D value of the Kolmogorov-Smirnov test).
It should be noted that in few cases, the theory
suggests that empirical data can be described by two
laws, without any clear distinction between the two.
In our case. In three cases, the log-normal law has
been identified as a possible alternative, but relatively
close to the power law. Let us recall that a random
variable X follows a log-normal law if Y = ln(X ) fol-
lows a normal law of average µ and standard deviation
σ (denoted LOG −N (µ, σ)).
For all possible routes (around 10 billions) we
have results given in Table 7 and in Figure 5. For
Table 7: Results for all possible TOR routes (D represents
the Kolmogorov-Smirnov distance between data and mo-
del).
Data α x
min
D
Total nodes occurrences 1.89 1850 0.03
Guard nodes occurences 3.16 5239 0.04
Middle nodes occurences 3.09 1223 0.03
Exit nodes occurrences 2.45 21361 0.05
Guard nodes occurences, let us mention the fact that
the LOG −N (7.38, 0.956) law is a possible alterna-
tive law.
Table 8 and Figure 6 provides the results for the
top one billion routes. For the Guard nodes occu-
rences, we have LOG − N (5.99, 0.661) as possible
alternative law while for the Exit nodes occurrences,
LOG −N (8.47, 0.827) can be also an alternative law.
Table 8: Results for 1-billion top TOR routes (D represents
the Kolmogorov-Smirnov distance between data and mo-
del).
Data α x
min
D
Total nodes occurrences 1.87 404 0.03
Guard nodes occurences 3.09 519 0.04
Middle nodes occurences 2.89 285 0.03
Exit nodes occurrences 2.99 11083 0.04

All OR OR guard
OR middle OR exit
Figure 5: Inverse cumulative density functions of data compared to the fitted law. The red dotted line (resp. green and blue)
describes the power law (resp. log-normal and exponential law).
All OR OR guard
OR middle OR exit
Figure 6: Inverse cumulative density functions of data compared to the fitted law (1-billion top TOR routes). The red dotted
line (resp. green and blue) describes the power law (resp. log-normal and exponential law).
