
Impact of Service Interruptions and the Variability of Service Time in
Queueing Systems: Numerical Investigations
Yang Woo Shin
1
and Dug Hee Moon
2
1
Department of Statistics, Changwon National University, Changwon, Gyeongnam 51140, Korea
2
School of Industrial Engineering and Naval Architecture,
Changwon National University, Changwon, Gyeongnam 51140, Korea
Keywords:
Service Interruptions, Variance Rate, Departure Process, Finite Buffers.
Abstract:
In this paper, we consider the queueing systems with finite buffer and service interruptions. The effects of
service interruptions and the variability of service time to measure of departure process such as the asymptotic
mean and variance of the number of departures are investigated numerically. We find numerically so called
interruption paradox or failure paradox that the departure rate of the system with service interruptions under
preemptive-repeat-different policy can be greater than that of the system with reliable server and it increases
as the interruption rate increases for the case of large variability of service time. The results give an insight for
the effects of the system and may be helpful to design and control the more complex systems.
1 INTRODUCTION
Queueing networks that consist of nodes with finite
buffer and service interrup tions have been widely
used for modeling and analysis of the system ari-
sing from many practical situations such as computer
systems, telecommu nications and manufacturing sy-
stems. The network topology and th e characteristics
of each node such as buffer size, service time a nd the
interactions b etween interruptions and service affect
not only the performances of each node but also the
the performance of whole network.
The m ean number of customers, blocking proba-
bility of arriving customers and the idle pr obability
of the server are important performance me asures of
each node. Besides on the intern al measures of each
node, the measures related with departure process of
each node are also important to understand and ana-
lyze the whole network performance . In particula r,
the amount of pr oduction in the manufacturing sy-
stem is presented by the num ber of depar tures from
a terminal node of a network. T he long run average
of departure s, called departure rate or throu ghput is
an important measure of performa nce in manu factu-
ring system. The first order measures can be used to
get information about the ca pabilities of a system in
the long run. However, there may be treme ndous va-
riability of the departures from a time period to pe-
riod even in a simple queueing network (Gershwin,
Section 3.2, 1994). Thus the second order measures
such as the variance of the number of depa rtures in a
given time per iod, called variance rate are also very
useful to design and control the systems in a more
effective way. For a review of recent studies on the
variance of the departures for production systems, re-
fer to the paper Tan (2013) and Lagershausen and Tan
(2015). Recently, Shin and Moon (2016,2 017) pre-
sent an algorithmic method for asymptotic variance
rate of departure process of the system with two-node-
one buffer system using the Markovian a rrival pro-
cess.
Interru ptions in queueing systems are the ele-
ments that prevent th e c ontinuous service of custo-
mers. Queueing models with service interruptions
have been used to model the situation s where a ser-
vice facility is shared by multiple queues, or where
the facility is subject to failure. Such in te rruption s
may be caused by breakdowns of the servers, arrival
of customers of a higher-priority class or scheduled
off-periods by extra jobs. Queueing models with ser-
vice interruptions and their connection with priority
models or machine brea kdowns have been studied ex-
tensively in the literature, e.g. see White and Chris-
tie (1958), Gaver (1962), Nicola (1986), Fiems etc.
(2008), Sahba et al. (2015) and refer to the survey
paper Krishnamoorthy et al. (2014) fo r mo re details.
The M/G/1 queue with a single type of Poisson inter-
ruption s was dealt with extensively by Gaver (1962)
Shin, Y. and Moon, D.
Impact of Service Interruptions and the Variability of Service Time in Queueing Systems: Numerical Investigations.
DOI: 10.5220/0006633202790286
In Proceedings of the 7th International Conference on Operations Research and Enterprise Systems (ICORES 2018), pages 279-286
ISBN: 978-989-758-285-1
Copyright © 2018 by SCITEPRESS – Science and Technology Publications, Lda. All rights reserved
279

for a variety of serv ice-interruption interactions. The
analysis was based on the definition of the comple-
tion time. He derived the Laplace Stieltjes transfo rm
(LST) of the completion time that is the time interval
between the instant at which the customer’s service
begins and the instants at which the service of the next
customer (if any exists) may begin and used the met-
hod of imbedded Markov chain to obtain the genera-
ting function of the distribution of the number of cus-
tomers in the system. Nicola (1986) derives the LST
of completion time for the case with the simultaneous
presence of d ifferent type s of interruptions. The lite-
rature cited above deal with the infinite buffer queue
and focus on analyzing the stationary distribution of
the number of customers in the system, waiting time
distribution and related performance measures such
as the mean number of customers in the system and
blocking probability.
However, the articles reviewed above do not inves-
tigate the effects of intera c tions betwe en interruptions
and variability of service time to the system perfor-
mances. In this paper, we consider the queueing sy-
stems with finite buffer and serv ic e interr uptions and
investigate numerically the effects of service interrup-
tions and the variability of service time to measure of
departure process such as the asymptotic mean and
variance of the number o f departures. Numerical re-
sults give an insight for the effects of the system and
play an important role to pre pare the analysis of the
extended system of that considered in this present.
This paper is organized as follows. In Section 2,
types of interruptions and preliminary results for com-
pletion time given by Gaver (1962) are presented. Th e
effects of interruptions and variability of service time
to the departure rate and variance rate in the saturated
system and M/PH/1/K queue are investigated nume-
rically in In Sections 3 and 4 . Concluding remarks are
given in Section 5.
2 ASSUMPTIONS AND
PRELIMINARY RESULTS
Consider the single server system with service inter-
ruption s. In this section, some assumptions and preli-
minary results to be used later are described.
Service time. Service times of successive cu-
stomers are indepen dently and identically distribu-
ted with arbitrary distribution. Denote the generic
random variable of service time by B and B(x) =
P(B ≤ x) a nd B
∗
(s) = E[e
−sB
], s ≥ 0. Let E[B
k
] = b
k
,
k = 1,2 and denote the squared coefficient of variation
(SCV) of B by c
2
b
= Var[B]/b
2
1
.
Interruption. Interruptions appear ac cording to a
Poisson process with rate ν a nd e a ch interruption re-
quires ran dom time to clear the effects of this particu-
lar interru ption to th e server. Successive durations are
indepen dent r andom variables, identically distributed
with arbitrar y d istribution function and denote the ge-
neric random variable of the duration of interruptio n
by R. Let R(x) = P(R ≤ x) a nd R
∗
(s) = E[e
−sR
], s ≥ 0
and E[R
k
] = r
k
, r = 1, 2. We assume that the in ter-
ruption process is independent of the arrival process
of customers and the number of customers waiting in
line, and the elapsed time since the initial instant.
The interruption occurs only when the server is
actually working and it does not occurs during the pe-
riod while the server is id le or it is in state of inter-
rupted (durations of interruption). This type of inter-
ruption is called active interruptio n (AI) or opera tion
dependent interruption (ODI). The AI can b e classi-
fied into two categories, say postponable interrupti-
ons ( PI) and preemptive interruption (PR). When a PI
appears during a service time, it does not take effect
until the end of the service time. All of the interrup-
tions ac cumulated during that service time must then
be cleared before service of next customer maybegin.
Under the PR policy, customer’s service is preempted
immediately upon the arrival of interruption. In this
presentation, we consider only the PR.
Completion Time. A completion time is the time
period between the instant at which the customer ’s
service begins a nd th e instants at which the service of
the next customer (if any exists) may begin. This pe-
riod is the sum of the customer’s service time and th e
durations of the interruptions occurring in that time.
Let C be the completio n time, and denote by C(x) and
C
∗
(s) the distribution function of C and its LST, re-
spectively.
The completion time may depend on the ways
of occurrence and clearance of interruptio ns. Gaver
(1962) proposed various types o f interruptions and
derive the LST’s, the first and second mom e nts of
completion time in each case. Here, some of the re-
sults are summarized in the following for later use.
Let
E =
1/ν
1/ν + E[R]
=
1
1 + νr
1
.
The quantity E is sometimes called an efficiency of
the server in a m anufacturing system, e.g. see Gers-
hawin (1994).
(i) Preemptive-resume (PRS) Interruptions. In a
PRS policy, when an interruption is cleared, service is
continued from the poin t at which it was interrupted.
The LST and the mean and variance of completion
ICORES 2018 - 7th International Conference on Operations Research and Enterprise Systems
280

time are given by
C
∗
(s) = B
∗
(s + ν− νR
∗
(s)),
E[C] =
b
1
E
,
Va r[C] =
Va r[B]
E
2
+ νb
1
r
2
.
(ii) Preemptive-repeat-different (PRT-D) Interrup-
tions. In this case, when an interru ption is cleared,
service begins again from scratch , but each time anot-
her inter ruption is cleared a new independent (poten-
tial) service time whose distribution function is B(x)
begins. Service is completed when, for the first time,
such a service time elapses without interruption.
C
∗
(s) =
B
∗
(s + ν)
1 − R
∗
(s)
ν
s+ν
(1 − B
∗
(s + ν))
,
E[C] =
1
νE
1 − B
∗
(ν)
B
∗
(ν)
,
Va r[C] = (E[C])
2
+
νEr
2
+
2
ν
E[C]
−
2
νE
E[Be
−νB
]
(B
∗
(ν))
2
.
(iii) Preemptive-repeat-identical (PRT-I) Inter-
ruptions. In this case, when the interruption is cle-
ared, a service period of the same duration as the one
interrup te d begins again from scratch. Service is com-
pleted (completion time terminates) when, for the first
time, a (repeated) serv ic e period elapses without in-
terruption. The L ST and the mean and variance of
completion time are given by
C
∗
(s) =
Z
∞
0
e
−(s+ν)x
1 − R
∗
(s)
ν
s+ν
(1 − e
−(s+ν)x
)
dB(x),
E[C] =
1
νE
(E[e
νB
] − 1),
Va r[C] =
1
ν
2
E
2
Va r
e
νB
− 1
+ E
(e
νB
− 1)
2
+
νEr
2
+
2
ν
E[C] −
2
νE
E[Be
νB
],
where the expectations may not exist.
3 ASYMPTOTIC RATE FOR THE
NUMBER OF DEPARTURES IN
A SATURATED SYSTEM
Consider a single server system that is saturated a nd
never blocked. Th at is, the server always work s unless
it is down state and the customer leaves the sy stem
immediately after the service without blocking.
Let N(t) be the number of service completions du-
ring an interval (0 , t]. Th en N
N
N = {N(t), t ≥ 0} is a re-
newal pr ocess whose inter-renewal distribution is the
same as the comp letion time C. It follows from the
well known results of the re newal theory ( e.g. see
Cox (page 58, 1962)) that the lo ng run average num-
ber of departures and the variance rate of N
N
N are given
by
µ = lim
t→∞
E[N(t)]
t
=
1
E[C]
,
V = lim
t→∞
Va r[N(t)]
t
=
Va r[C]
(E[C])
3
.
Indeed , the distribution of N(t) is asymptotically nor-
mal with mean µt and variance Vt, i = 1,2.
Now, we investigate the effects of the interactions
between interruptions and service time, interruption
rate ν and the variability of service time to the depar-
ture rate µ and variance rate V . The PH-distributiion
(PH) and lognormal distribution (LN) of service ti-
mes and exponential distribution of duration R of an
interrup tion with rate η are considered. The mea n ser-
vice time and the efficiency of the server is fixed by
b
1
= 1.0 and E = 0.85 and the repair rate is deter-
mined by η =
νE
1−E
=
17
3
ν for interruption rate ν > 0.
For PH-distribution, we use the Erlang distribution of
order k (E
k
) for C
2
b
=
1
k
< 1, exponential distribution
(Exp) for C
2
b
= 1 and hyperexponential distribution
of order 2 with b a la nced mean for C
2
b
> 1 denoted by
H
2
(p
1
,λ
1
,λ
2
) whose probab ility density fun c tion is
f (t) = p
1
λ
1
e
−λ
1
t
+ p
2
λ
2
e
−λ
2
t
, t ≥ 0,
with λ
1
= 2p
1
µ, λ
2
= 2p
2
µ and
p
1
=
1
2
1 +
s
c
2
b
− 1
c
2
b
+ 1
!
, p
2
= 1 − p
1
.
Preemptive-resume versus preemptive-repeat-
different. The departu re rate µ as a f unction of c
2
b
for
the various interruption ra te ν ar e depicted in Figure
1. The figures show that the departure rates of the
systems with reliable server (ν = 0.0) and the server
with PRS policy ( denoted by Type 1) do not depend
on the SCV of service time. However, the departure
rate µ
2
of the system with PRT-D policy increases
as c
2
b
increases for each ν and it can be greater than
the service rate µ = 1 .0 of reliable server (ν = 0.0).
Furthermore, the departure rate increases as th e
interrup tion r ate increases for large c
2
b
. These seems
surprising and we shall phrase it the interruption
paradox or failure paradox. We have found that these
results holds for Weibul distribution and gamma
distribution of service time although the results are
not presented in this paper.
Impact of Service Interruptions and the Variability of Service Time in Queueing Systems: Numerical Investigations
281
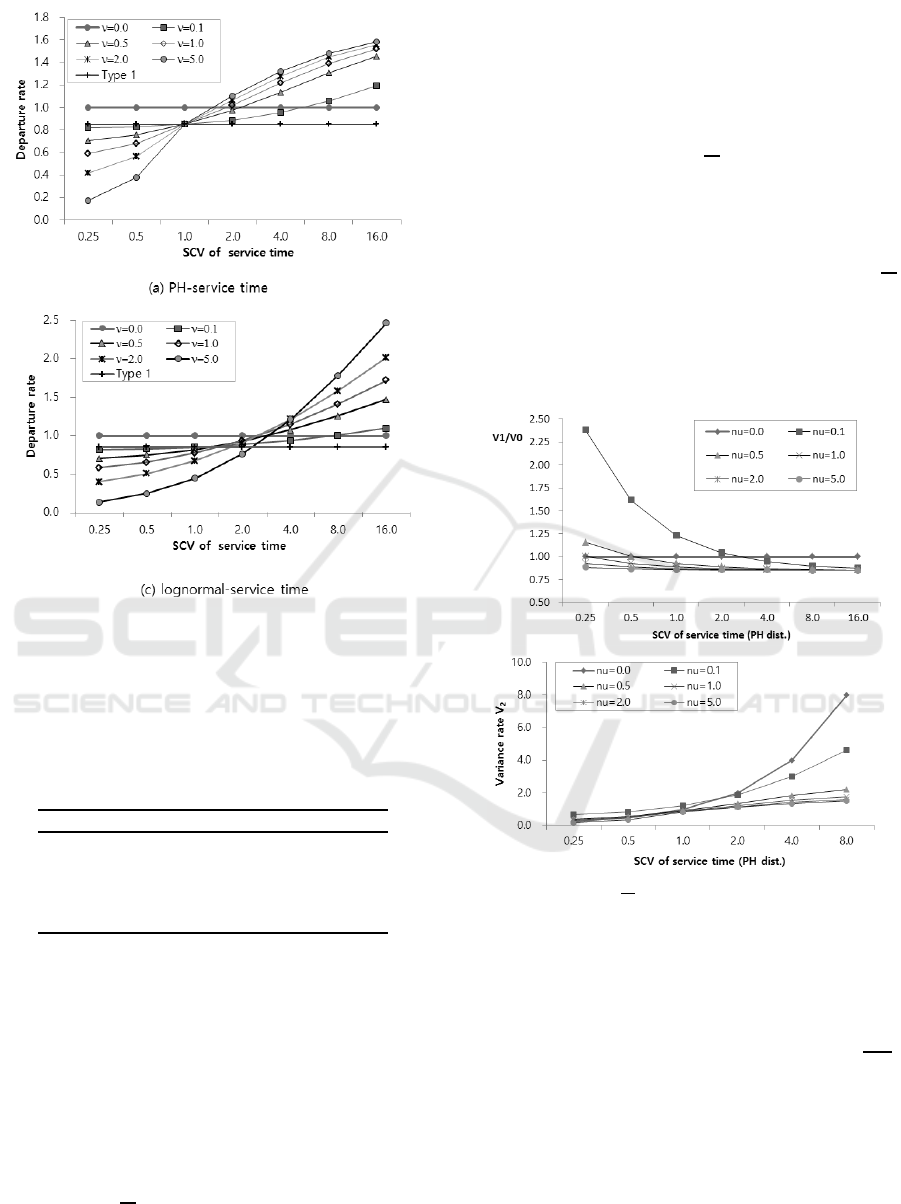
Figure 1: Departure rate as a function of SCV C
2
s
.
The reason of failure par adox can b e exp lained
as follows. The parameters of hyperexponential dis-
tribution H
2
(p
1
,λ
1
,λ
2
) with mean 1.0 are listed in
Table 1.
Table 1: Parameters for H
2
(p
1
,λ
1
,λ
2
)
C
2
s
p
1
p
2
λ
1
λ
2
1.0 0.5000 0.5000 1.0000 1.0000
2.0 0.7887 0.2113 1.5774 0.4227
4.0 0.8873 0.1127 1.7746 0.2254
8.0 0.9410 0.0590 1.8819 0.1181
16.0 0.9697 0.0303 1.9393 0.0607
It can be seen from Table 1 that p
1
approa c h to
1.0, and λ
1
increases and is greater than the service
rate 1.0 and λ
2
decreases as SCV increases. When a
service time of a customer is assigne d to long service
time corresponding to the rate λ
2
, the service time can
be interr upted by a failure and the server starts a new
service with short service time corresp onding to λ
1
with high probability p
1
. Thus a failure can make the
service time be shorter than that of the system with
reliable server.
The ratios
V
1
V
0
between the variance rate V
0
of the
noninterrupted system and V
1
of the system with PRS
policy and the variance rate V
2
of the system with
PRT-D policy for the system with PH-service time
are depicted in Figure 2. The ratios V
1
/V
0
tends to
E = 0.85 as C
2
b
increases which can be expected from
the formula V
1
/V
0
. The variance rate V
2
of the sy -
stem with PRT-D policy increases as SCV c
2
b
of ser-
vice time increases, but V
2
is less than V of the reliable
system for C
2
b
> 1. The ratio
V
2
V
1
are depicted in Figure
3. It can be seen from the figures 3 that the variance
rate V
2
depends severely on the distribution of service
time. We have seen from extensive numerical expe-
riments that the variance rate V
2
depends severely on
the distribution of service time. The variance ratio
V
2
V
1
decreases and becomes less than 1.0 for the system
with H
2
and Weibul distribution of service time, ho-
wever, it increases and becomes greater than 1.0 for
the system with g amma distribution of service time
as CSV of the service time increases.
Figure 2: The ratios
V
1
V
0
for the system with PH service time.
Preemptive-repeat-identical versus preemptive-
repeat-different. In case of preemp tive-repeat-
identical policy, the expectation E[e
νB
] for E[C] exists
if 1 − B(x) = o(e
−cx
) with t → ∞ for 0 < ν < c. For
example, if the distribution o f service time is gamma
distribution, then the expectations exist for ν <
1
b
1
c
2
b
.
If the distribution of B is Weibul, the the expec ta tion
exists only for c
2
b
< 1. If B has lognormal distribution,
then the expectation does not exist. Let E[C
I
] and
E[C
D
] denote the expectations of C f or the ca ses of
PRT-I and PRT-D, respectively. It can be easily seen
from the formulae E[C
I
] and E[C
D
] that E[C
I
] > E[C
D
]
is equivalent to
B
∗
(ν)B
∗
(−ν) > 1. (1)
ICORES 2018 - 7th International Conference on Operations Research and Enterprise Systems
282
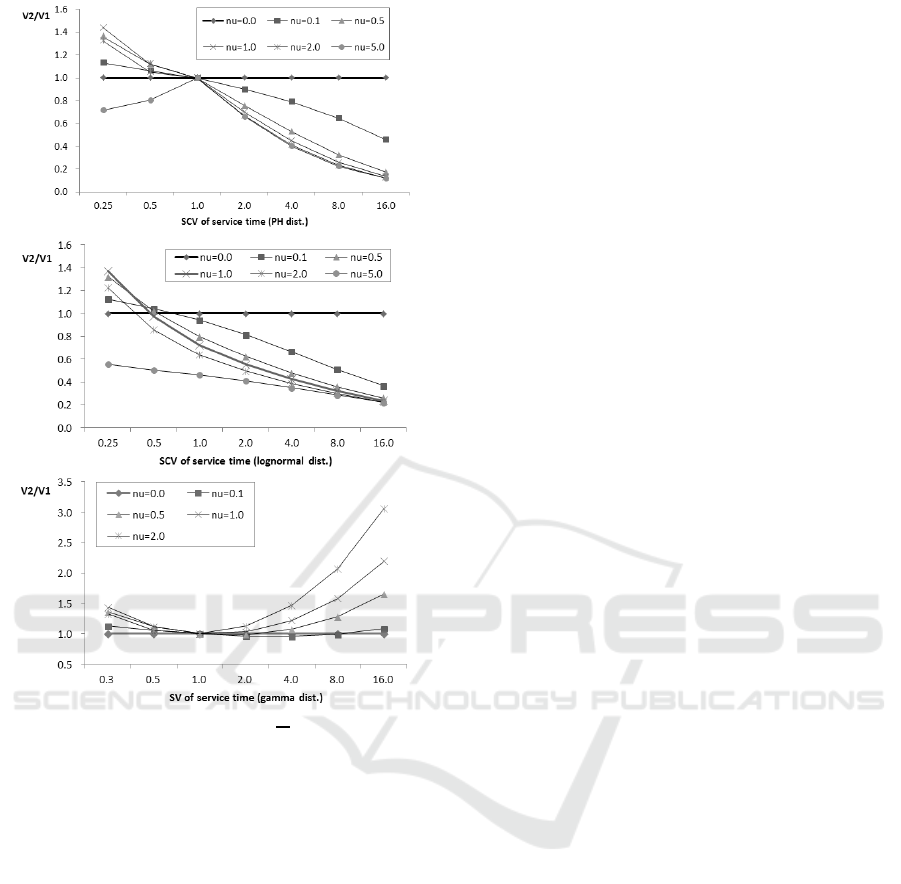
Figure 3: The ratio
V
2
V
1
.
It can be seen from th e formula B
∗
(s) = (1 −
b
1
c
2
b
s)
−1/c
2
b
of L ST that gamma distribution and the
condition of existence of E[C
I
] < ∞ that gamma dis-
tribution satisfies (1). We showed numerically that
the Weibul distribution with c
2
b
< 1 satisfies (1) for
any ν > 0, but we omit the details here.
4 M/PH/1/K QUEUE WITH
SERVICE INTERRUPTIONS
4.1 Model
We conside r a M/ PH/1/K queue with service inter-
ruption an d a buffer of finite capacity K in which cu-
stomers arrive according to a Poisson process with
rate λ. Interru ptions occurs only while the server is
working. The inter occurr e nce time of interruption
is a ssumed to be exponential distribution with rate ν.
The service time and duratio n of interruption are as-
sumed to be of phase type distributions PH(α
α
α,S) and
PH(γ
γ
γ,G), respectively. Let s
0
= −Se and g
0
= −Ge.
Let w and r be the number of phases of the distri-
butions of servic e time and duration of interruption,
respectively.
Let X (t) be the number of customers in the system
at time t. The state space of X(t) is {0, 1,·· · ,K}. By
J
w
(t) and J
r
(t)) deno te the phases of PH(α
α
α,S) and
PH(γ
γ
γ,G), respectively at time t. The state M(t) of the
server M at time t is
M(t) =
J
w
(t), the server is up at time t
(J
w
(t),J
r
(t)), the server is down at time t
Let [D
0
]
i j
([D
∗
0
]
i j
) be the rate that a transition of M(t)
occurs from i to j and no service is completed given
X(t) ≥ 1 (X(t) = 0,respectively) and [D
1
]
i j
([D
∗
1
]
i j
)
be the rate that a transition of M(t) occurs from i to
j and a service is completed given X (t) ≥ 2 (X(t) =
1,respec tively). Let M (M
∗
) be the state space of
M(t) for X(t) ≥ 1 (X(t) = 0, respectively) a nd m and
m
∗
be the number of elements of M and M
∗
, re-
spectively. Let P
1
be the m
∗
× m matrix whose (i, j)-
component [P
1
]
i j
is the probability that the p hase of
M is j immediately after an arrival occur s given that
X(t) = 0 and M(t) = i. The matrices D
0
and D
1
de-
pends on the service initiation policies after clearance
of interruption .
We consider the following three policies of initia-
tion of service when an interruption is cleared.
S
1
policy. Whe n an in te rruption is cleared, service
resume at the last phase in which a failure occurs. In
this case, m = w(r + 1) and m
∗
= 1 and
D
0
=
−νI
w
+ S νI
w
⊗γ
γ
γ
I
w
⊗ g
0
I
w
⊗ G
,
D
1
=
s
0
α
α
α O
O O
wr×wr
, D
∗
1
=
s
0
O
wr×1
and D
∗
0
= 0, P
1
= (α
α
α O
1×wr
), where O
k×n
is the ze ro
matrix of size k × n an d I
n
is the identity matrix of
size n.
S
2
policy. When an interruption is cleared, new
service starts anew according to a PH-distribution
PH(α
α
α,S). In this case, m = w + r and m
∗
1
= 1 and
D
0
=
−νI
w
+ S νe
w
γ
γ
γ
g
0
α
α
α G
,
D
1
=
s
0
α
α
α O
O O
r×r
, D
∗
1
=
s
0
O
r×1
,
and D
∗
0
= 0, P
1
= (α
α
α O
1×r
).
S
3
policy. When an interruption occ urs, the cu-
stomer being served is scrapped, and the server be-
gins new service of length whose distribution is of
Impact of Service Interruptions and the Variability of Service Time in Queueing Systems: Numerical Investigations
283

PH(α
α
α,S) after clearance of interruption. In this case,
m = w + r and m
∗
1
= r + 1 and
D
0
=
−νI
w
+ S O
w×r
g
0
α
α
α G
, D
∗
0
=
0 O
g
0
G
,
D
1
=
s
0
α
α
α νe
w
γ
γ
γ
O O
r×r
, D
∗
1
=
s
0
νe
w
γ
γ
γ
O O
r×r
,
P
1
=
α
α
α O
O I
r
.
Let Z(t) = (X(t),M(t)). The stochastic process
Z
Z
Z = {Z(t), t ≥ 0} forms a Markov chain with genera-
tor of the form
Q =
B
0
A
0
C
1
B
1
A
1
.
.
.
.
.
.
.
.
.
C
K−1
B
K−1
A
K−1
C
K
B
K
,
Then the block matrix components are as follows:
B
0
= −λI
m
∗
+ D
∗
0
, B
K
= D
0
, A
0
= λP
1
, C
1
= D
∗
1
,
B
n
= −λI
m
+ D
0
, A
n
= λI
m
, 1 ≤ n ≤ K − 1,
C
n
= D
1
, 2 ≤ n ≤ K.
4.2 Departure Process
Let N(t) be the number of service completions in
the system. Then N
N
N = {N(t), t ≥ 0} is a Mar-
kovian arrival process (MAP) with representation
MAP(D
0
,D
1
), where the matrices D
0
and D
1
are as
follows:
(1) S
1
and S
2
policies.
D
0
=
B
0
A
0
B
1
A
1
.
.
.
.
.
.
B
K−1
A
K−1
B
K
,
D
1
=
O
C
1
O
C
2
O
.
.
.
.
.
.
C
K
O
and O is the zero matrix of appropriate size.
(2) S
3
policy. For the system with scrapping ,
D
0
=
B
0
A
0
C
1,0
B
1
A
1
.
.
.
.
.
.
.
.
.
C
K−1,0
B
K−1
A
K−1
C
K,0
B
K
,
D
1
=
O
C
1,1
O
C
2,1
O
.
.
.
.
.
.
C
K,1
O
where
C
1, j
= D
∗
1, j
, C
n, j
= D
1, j
, 2 ≤ n ≤ K, j = 0,1,
and
D
1,0
=
O
w×w
νe
w
γ
γ
γ
O O
r×r
,
D
1,1
=
s
0
α
α
α O
O O
r×r
D
∗
1,0
=
O
w×1
νe
w
γ
γ
γ
O O
r×r
,
D
∗
1,1
=
s
0
O
O O
r×r
.
A Markovian arrival process (MAP) with repre -
sentation MAP(D
0
,D
1
) is a countin g process whose
inter even t time distribution is of the form
F(t) =
Z
t
0
exp(D
0
u)duD
1
, t ≥ 0.
For details of MAP, see Lucantoni (1991) or Artalejo
et al. (2010).
Let π
π
π = (π(x),x ∈ S ) be the stationary distribution
of D = D
0
+ D
1
and
c = π
π
πD
1
(eπ
π
π− D)
−1
, d = (eπ
π
π− D)
−1
D
1
e.
It is known that (e.g. Neuts,Theorem 5.4.1, 5.4.2,
1989; Artalejo et al., 20 10) in stationary state, the
mean and th e variance of N(t) are given as follows:
E[N(t)] = µt,
Va r[N(t)] = Vt + 2 (µ
2
− cd) + o(1).
where µ = π
π
πD
1
e and
V = µ − 2µ
2
+ 2cD
1
e.
One can refer to Shin and Moon (2016, 2017) for an
algorithm for computing µ and V , the mean and vari-
ance of inter departure time, and the covariance bet-
ween inter departure times.
ICORES 2018 - 7th International Conference on Operations Research and Enterprise Systems
284
4.3 Numerical Results
In this subsection , we investigate the effects of the in-
teractions between the interruptio ns and service time
and the variability of ser vice time to the departure rate
and variance rate of departure process in M/PH/1/5
queue with arrival rate λ = 1.0, mean service time
b
1
= 1.0 and E
1
= 0.85. We use the Erlan g distri-
bution of order k (E
k
) for c
2
b
=
1
k
< 1, exponential
distribution (Exp) for c
2
b
= 1 and hype rexponential
distribution of order 2 with balanced mean for c
2
b
> 1.
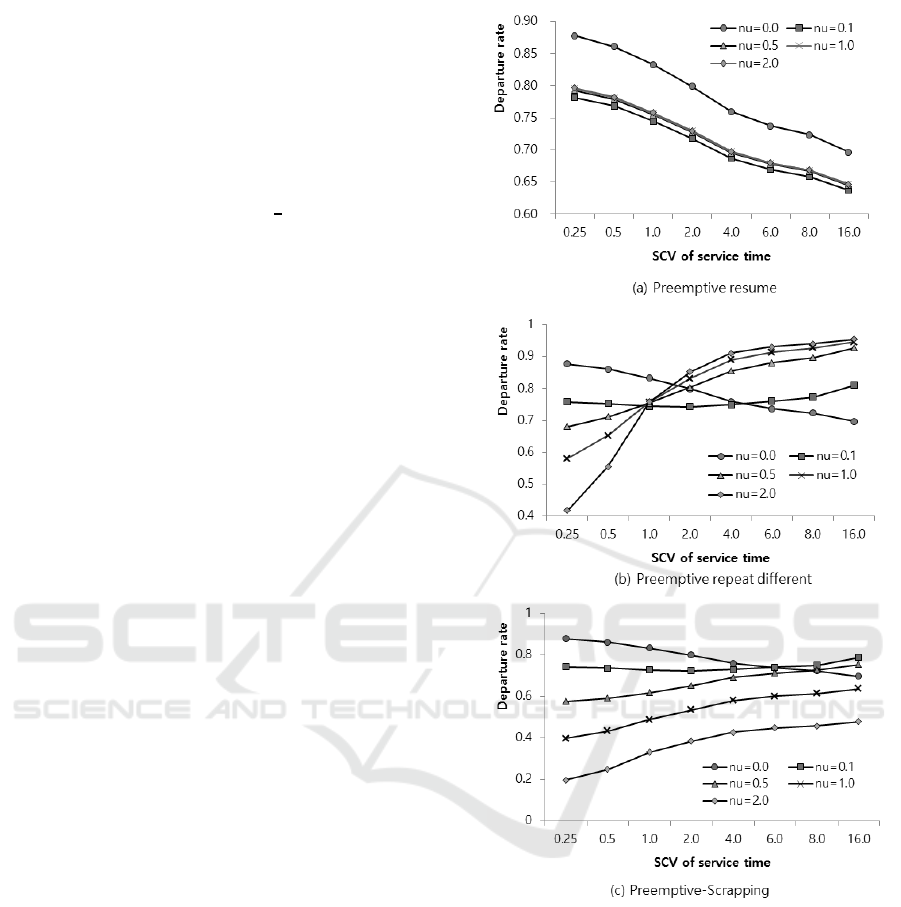
The comparisons of departure rates for the ser-
vice policies S
1
, S
2
, S
3
and interruption free system
(ν = 0.0 ) are presented in Figure 4. It can be seen
from the figure that the departu re rate f or the system
with S
2
policy increases and can be greater than the
isolated efficiency while the departure ra te decreases
in the system with S
1
policy and reliable system as
SCV c
2
b
of service time increases. It can be a lso seen
from the figure that the departure rate of the system
with scrap can be greater than tha t of reliable system
as SCV of service time increases.
Denote the variance rates for S
i
by V
i
, i = 1,2,3
and let V
0
be the variance rate for interruption free
system (ν = 0). Here, the variance rates V
1
and V
2
are depicted in Figure 5. We can see from the figure
that the variance rates increase in both types of service
initiation policies as c
2
b
increases. It also can be seen
that V
1
> V
0
> V
2
for c
2
b
sufficiently greater than 1.
Furthermore, V
2
decreases as ν increases for c
2
b
> 1.
We also can see from the figure that the behaviors V
3
are similar to those of V
2
.
5 CONCLUSIONS
In this study, the effects of struc tural parameters such
as the variabilities of service and the interactions bet-
ween interruptions and service time to th e departure
rates and variance rates have been investigated nu-
merically. We have observed from numerical experi-
ments th at the variance rate of departures increases as
the SCV of the service time increases. However, the
departure rate in the system with interruptions can be
greater than that of the interruption free system and it
can increase as the interruption rate increase for large
SCV of service time. This result is different fr om the
case of the system with reliable servers in which the
departure rate decreases as SCV’s of ser vice times in-
crease. We have coined this surprising results the in-
terruption paradox or failure paradox. The effects of
interrup tion rate to the departure rate and variance rate
are dependent of the SCV’s of service time.
Figure 4: Departure rate as a function of SCV c
2
b
.
It rema ins to analyze the more complicated sy-
stem su ch as the queueing system with more g e ne-
ral arrival and/or service time a nd queueing networks
with interruptions as furth er research area. Nume ri-
cal results give some insights for the more co mplica-
ted systems. So, our experiments may be helpful to
design and c ontrol the system with interrup tions an d
may play a usef ul role to prepar e the analysis of the
extended systems.
Impact of Service Interruptions and the Variability of Service Time in Queueing Systems: Numerical Investigations
285
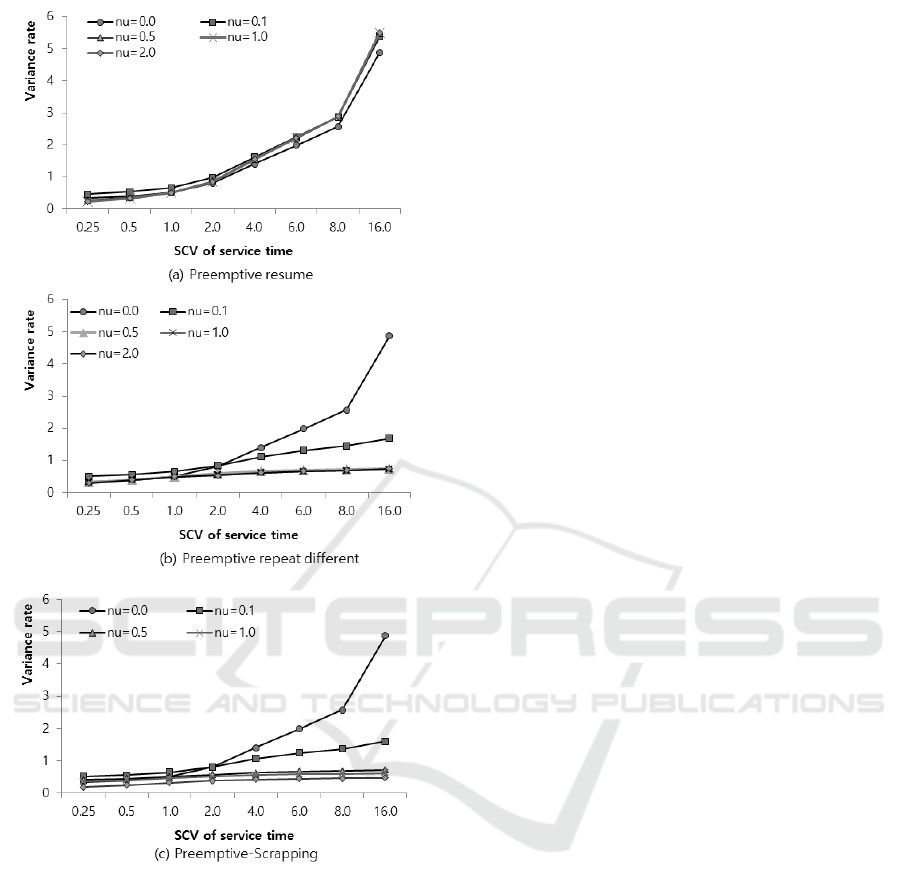
Figure 5: Variance rate as a function of c
2
b
.
REFERENCES
Artalejo, J. R., G´omez-Corral, A., He, Q. M. (2010). Mar-
kovian arrivals in stochastic modelling: a survey and
some new results, SORT 34 (2), 101-144.
Gaver, D. Jr. (1962). A waiting line with interrupted ser-
vice, including priorities, Journal of the Royal Statis-
tical Society, Series B24, 73-90.
Gershwin, S. B. (1994). Manufacturing systems engineer-
ing. Prentice-Hall, Englewood C liffs.
Krishnamoorthy, A., Pramod, P. K., Chakravarthy, S. R.
(2014) Queues with interruptions: a survey, TOP
22(1), 290-320.
Lagershausena, S., Tan, B. (2015). On the exact inter-
departure and inter-start time distribution of closed
queueing networks subject to blocking, IIE Transacti-
ons 47, 673-692
Lucantoni, D. M., Meier-Hellstern, K. S., Neuts, M. F.
(1990). A single server queue with server vacations
and a cl ass of non-renewal arrival processes, Advan-
ces in Applied Probability 22, 676-705.
Narayana, S., Neuts, M. F. (1992). The first two moment
matrices of the counts for the Markovian arrival pro-
cess, Stochastic Models 8(3), 459-477.
Neuts, M. F. (1989). Structured Stochastic Matrices of
M/G/1 Type and Their Applications. Marcel Dekker,
New York.
Nicola, V. F. (1986). A single server queue with mixed types
of interruptions, Acta Informatica 23, 465-486.
Sahba, P., Balco˜glu, B. Banjevic, D. (2015). The im-
pact of disruption characteristics on the perfor-
mance of a server, Annals of Operations Research,
https://doi.org/10.1007/s10479-015-2075-2, pp1-14.
Shin, Y. W., Moon, D. H. (2016). Variability of output
in two-node t andem production line. Proceedings of
QTNA 2016, December 2016, Wellington, New Zea-
land, pp. 13-15.
Shin, Y. W., Moon, D. H. (2017). Variance of departure pro-
cess in two-node tandem queue with unreliable server
and blcking. Proceedings of ICORES 2017, February
2017, Porto, Portugal, pp. 258-264.
Tan, B. (2013). Modeling and analysis of output variabi-
lity in discrete material flow production systems. In
Handbook of Stochastic Models and Analysis of Ma-
nufacturing System Operations. Tan,B. and Smith, J.
M. (eds), Springer, New York, pp. 287-311.
White, H., Christie, L. (1958). Queuing with preemp-
tive priorities or with breakdown, Operation Research
6(1), 79-95.
ICORES 2018 - 7th International Conference on Operations Research and Enterprise Systems
286
