
Flash and Storm: Fast and Highly Practical Tone Mapping based on
Naka-Rushton Equation
Nikola Bani
´
c and Sven Lon
ˇ
cari
´
c
Image Processing Group, Department of Electronic Systems and Information Processing,
Faculty of Electrical Engineering and Computing, University of Zagreb, 10000 Zagreb, Croatia
Keywords:
HDR, Image Compression, Image Enhancement, LDR, Naka-Rushton Equation, Retinex, Tone Mapping
Operator.
Abstract:
Tone mapping operators (TMOs) are used to convert high dynamic range (HDR) images to their low dynamic
range (LDR) versions mostly to display them on standard display devices. The problem with many TMOs
that produce high-quality results is that they are too slow to be used in real-time applications. In this paper, a
new TMO is proposed whose steps are primarily designed to achieve high speed and to be practically imple-
mentable. Under this constraint the secondary goal is to produce low dynamic range images of high quality.
The proposed TMO is based on Naka-Rushton equation used in combination with additional improvements
and it has O(1) per-pixel complexity. The presented and discussed results show that, beside being faster and
more practical, the proposed TMO outperforms many state-of-the-art TMOs in terms of resulting LDR image
quality. To further demonstrate its practicality, the source code written in C++, Matlab, Python, Java, and
HTML+JavaScript is available at http://www.fer.unizg.hr/ipg/resources/color constancy/.
1 INTRODUCTION
The dynamic range of an image is the ratio between its
largest and smallest non-zero intensity. Even though
high dynamic range (HDR) images are used ever
more frequently (Reinhard et al., 2010), most display
devices are currently limited to show only low dyna-
mic range (LDR) images. To display an HDR image
on such devices, its dynamic range has to be com-
pressed in the process called tone mapping by means
of methods called tone mapping operators (TMOs).
Tone mapping usually processes the image luminance
channel, often calculated as the Y channel of the YUV
colorspace. For a pixel with a given RGB representa-
tion p = (R, G,B)
T
the value of Y is (Koschan and
Abidi, 2008):
Y = 0.299R + 0.587G +0.114B. (1)
Alternative luminance channels are found in HSV ,
HSL, and Lab colorspaces or custom definiti-
ons (Bani
´
c and Lon
ˇ
cari
´
c, 2014b; Nguyen and Brown,
2017). If the luminance value L of p is tone mapped
to L
0
, then p is changed to
p
0
=
L
0
L
p =
L
0
L
R,
L
0
L
G,
L
0
L
B
T
. (2)
If a TMO processes intensities based only on
their value and regardless of their location, then it
is a global TMO, otherwise it is a local one. Ex-
amples of global TMOs include application of Ste-
ven’s law (Tumblin and Rushmeier, 1993; Chiu et al.,
1993; Ward, 1994), imitation of human response to
light (Schlick, 1995; Pattanaik et al., 2000; Drago
et al., 2003; Reinhard and Devlin, 2005), histogram
adjustment (Larson et al., 1997), and sigmoidal con-
trast enhancement (Braun and Fairchild, 1999). For
local TMOs examples include application of aniso-
tropic diffusion (Tumblin and Turk, 1999), bilateral
filtering of the image base layer (Durand and Dorsey,
2002), photographic practice (Reinhard et al., 2002),
luminance gradient field manipulation (Fattal et al.,
2002; Mantiuk et al., 2006), Retinex theory (Mey-
lan and Susstrunk, 2006; Bani
´
c and Lon
ˇ
cari
´
c, 2014a;
Bani
´
c and Lon
ˇ
cari
´
c, 2016). Global TMOs are fas-
ter and usually simpler, but local TMOs tend to give
results of higher quality (Kuang et al., 2004; Kuang
et al., 2007; Urbano et al., 2010). The problem with
many TMOs that produce high-quality results is that
they are too slow to be used in real-time applications.
In this paper a new TMO is proposed whose steps
are primarily designed to achieve high speed and to
be practically implementable. Under this constraint
Bani
´
c, N. and Lon
ˇ
cari
´
c, S.
Flash and Storm: Fast and Highly Practical Tone Mapping based on Naka-Rushton Equation.
DOI: 10.5220/0006621600470053
In Proceedings of the 13th International Joint Conference on Computer Vision, Imaging and Computer Graphics Theory and Applications (VISIGRAPP 2018) - Volume 4: VISAPP, pages
47-53
ISBN: 978-989-758-290-5
Copyright © 2018 by SCITEPRESS – Science and Technology Publications, Lda. All rights reserved
47

the secondary goal is to produce low dynamic range
(LDR) images of high quality. The proposed TMO
is based on Naka-Rushton equation used in combi-
nation with additional improvements and it has O(1)
per-pixel complexity. The presented and discussed re-
sults show that, beside being faster and more practi-
cal, the proposed TMO outperforms many state-of-
the-art TMOs in terms of resulting LDR image qua-
lity. To further demonstrate its practicality and sim-
plify its usage by interested parties, the publicly avai-
lable source code of the proposed TMO is written in
several programming languages including JavaScript
with an HTML interface so that it can be used even
with only a browser.
The paper is structured as follows: in Section 2
the foundations for the new TMO are laid, in Secti-
ons 3 the TMO is extended to a local one, in Section 4
experimental results are presented and discussed, and
Section 5 concludes the paper.
2 FLASH - STARTING
GLOBALLY
2.1 Initial Tone Compression
Recently a high quality two-phase TMO called Puma
with O(1) per-pixel complexity has been propo-
sed (Bani
´
c and Lon
ˇ
cari
´
c, 2016). During its first phase
the actual tone compression is performed globally by
means of a method called Flash. It is fast and ef-
ficient since it uses a simple to calculate curve, but
the resulting LDR image is crude and of low quality.
The second phase consists of enhancing this image by
applying Smart Light Random Memory Sprays Re-
tinex (SLRMSR) (Bani
´
c and Lon
ˇ
cari
´
c, 2015; Bani
´
c
and Lon
ˇ
cari
´
c, 2017), a brightness adjustment method,
whose parameters are set to specifically chosen values
for this purpose. SLRMSR produces the final high
quality LDR image and it has O(1) per-pixel com-
plexity. Despite good overall theoretical complexity,
Puma is not especially fast due to a large constant
number of steps per pixel used in SLRMSR. Additio-
nally, SLRMSR has several parameters that need to be
tuned for various tone mapping effects. Hence, Puma
does not fully abide by the constraints laid out in the
introduction. Nevertheless, if SLRMSR is left out,
Flash can still be used as a good foundation for a de-
sired new TMO because of its effectiveness, while for
the enhancement of its results a more efficient met-
hod has to be found. The core of Flash is the Naka-
Rushton equation (Shapley and Enroth-Cugell, 1984)
given in the form
L
0
=
L
L
w
L
L
w
+ a
=
L
L + aL
w
(3)
where L is the initial luminance, a is a scaling pa-
rameter, and L
w
is the image key, which is usually
approximated by calculating the geometric luminance
mean (Ward, 1994; Reinhard et al., 2002)
L
w
= exp
1
N
∑
i
ln(L(i) + ε)
!
(4)
where N is the number of pixels, L(i) is the i-th pixel
luminance, and ε is a small value to avoid logarithm of
zero. By being a special case of the perceptually ba-
sed Michaelis-Menten equation (Dowling, 1987), the
Naka-Rushton equation is to some degree inherently
also perceptually based, which makes Flash theoreti-
cally sound and even more attractive. To obtain high
quality results, Flash uses the V channel of the HSV
colorspace as the luminance channel where V is cal-
culated as V = max{R, G, B}. Flash
a
denotes the ap-
plication of Flash for a given value of a.
2.2 Leap - Simple Image Enhancement
The next step is to enhance the crude results of Flash
in a way that abides by the constraints laid out in
the introduction. A good starting point in designing
such an enhancement procedure partially motivated
by (Huang and Mumford, 1999) is to look for simple
properties common to many tone mapped LDR ima-
ges of high quality. Once some of these properties
are found, their incorporation into the results of Flash
should hopefully increase their quality.
The set of high quality tone mapped LDR ima-
ges needed to look for such properties was created
by turning the HDR images available at (NTUST,
2015) and (Fairchild, 2015) into LDR images by
using the procedure described in (Ma et al., 2015).
This procedure takes an initial LDR version of a gi-
ven HDR image and changes it iteratively in order to
increase the value of TMQI-II (Ma et al., 2015), an
adapted version of Tone Mapped image Quality In-
dex (TMQI) (Yeganeh and Zhou, 2013) that evaluates
structural fidelity and statistical naturalness of a tone
mapped image by using the initial HDR image as a
reference. Although the procedure is far too slow to
be used in practical real-time systems, its final results
are by definition of high quality. The procedure was
iteratively applied to HDR images until the TMQI-II
value of an image was very close to the maximum of
1 or the number of iterations reached 500.
The analysis of different properties across all of
the obtained high quality LDR images has shown that
the arithmetic mean of the grayscale image values is
VISAPP 2018 - International Conference on Computer Vision Theory and Applications
48

a stable property with a low standard deviation over
the images. For the first dataset (NTUST, 2015) the
mean of the images’ grayscale means was 100.57 with
a standard deviation 3.85 and for the second data-
set (Fairchild, 2015) these values were 100.04 and
5.12, respectively. This suggests that an appropriate
mean grayscale value could also assure a higher qua-
lity. One of the simplest ways to achieve this is to
multiply a given image by a scalar in order to obtain
a desired mean grayscale value i.e. to jump from the
initial mean grayscale to a given one. In Section 4.2
it is shown that such a procedure may indeed signi-
ficantly increase the image quality of a given LDR
image. For easier notation this procedure is named
Leap
g
with g being the target mean grayscale. For
some low key images their high intensity pixels may
appear ”burned” after increasing their brightness even
further by applying Leap, but as explained in (Rein-
hard et al., 2002), this can actually be desirable. As a
matter of fact, in (Reinhard et al., 2002) an extension
of Eq. (3) has been proposed for exactly that purpose.
The pseudocode for Leap is given in Algorithm 1. In
the Section 4.2 it is shown that Flash combined with
Leap is a fast and high quality global TMO.
After carrying out subjective assessment of a large
number of LDR images obtained by applying Flash
and Leap, it was concluded that round default values
for a and g that already produce visually appealing
results are 10 and 110, respectively.
Algorithm 1: Leap.
Input: image I, target mean grayscale g, upper
bound U
1: m = CalculateMeanGrayscale(I)
2: for all pixel i in I do
3: p = I(i)
4: p
0
R
= max
g
m
p
R
,U
5: p
0
G
= max
g
m
p
G
,U
6: p
0
B
= max
g
m
p
B
,U
7: R(i) = p
0
8: end for
Output: image R
3 STORM - CONTINUING
LOCALLY
3.1 Extension to a Local TMO
Global TMOs are fast, but for results of the highest
quality local TMOs are used (Kuang et al., 2004; Ku-
ang et al., 2007). Hence a natural direction of further
Flash improvement is to extend it to a local version.
One of the common approaches for such an extension
is to perform tone mapping with pixel-based parame-
ters, which are determined by looking only at the local
area surrounding a given pixel instead of at the whole
image (Reinhard et al., 2010). There is evidence that
early stages of visual processing can be modelled by
filtering of retinal image using filters of different sca-
les (Wilson, 1991) and similar approaches have been
used in various tone mapping and image enhancement
methods (Peli, 1990; Jobson et al., 1997; Pattanaik
et al., 1998). Thus the local extension of Flash propo-
sed here does the same thing. If R and C are the num-
ber of image rows and columns, respectively, then let
d be the smaller of these two i.e. d = min{R,C}. For
a pixel i Flash is applied to M squares of size s
j
d ×s
j
d
with pixel i in their center where s
j
is the scaling fac-
tor for the j-th square. If k
j
is the j-th square and
F
(
k
j
)
a
(i) the value of luminance of pixel i after ap-
plying Flash
a
to k
j
with i in its center, then the final
luminance value for i is obtained as
S(i) =
1
M
M
∑
j=1
F
(
k
j
)
a
(i). (5)
The main computation cost of Eq. (5) is in calcula-
ting Eq. (4) for each i and k
j
, which is effectively
done by means of convolution over the luminance lo-
garithms. Such an approach was motivated by the
multiscale Retinex (MSR) algorithm (Jobson et al.,
1997), but there are two differences. First, while
MSR uses Gaussian kernels, having square kernels in
Eq. (5) allows faster filtering by using a single inte-
gral image (Crow, 1984), which also brings the per-
pixel complexity of Eq. (5) to O(M). Second, unlike
in MSR, there are no weights in Eq. (5) for individual
kernels because using them has shown no significant
benefit in terms of quality. The contribution of vari-
ous kernels is shown in Fig 1. Like with Flash, higher
values of a for Storm give better contrast in the final
image as it is shown in Fig. 2. Since the proposed
local TMO applies Flash multiple times and multiple
flashes often occur during storms, it is named Storm
for easier notation, while its application with n speci-
fied scaling factors and value of a for the underlying
Flash is denoted Storm
(s
1
,...,s
n
)
a
. The pseudocode for
Storm is given in Algorithm 2.
3.2 Properties
Fig. 1 shows how more kernels make more details vi-
sible. With well chosen kernels Storm outperforms
Flash in terms of quality, but at the cost of the additi-
onal memory that is needed for the integral image.
In terms of complexity, Storm is also more com-
plex than Flash. Firstly, Storm calculates the integral
Flash and Storm: Fast and Highly Practical Tone Mapping based on Naka-Rushton Equation
49
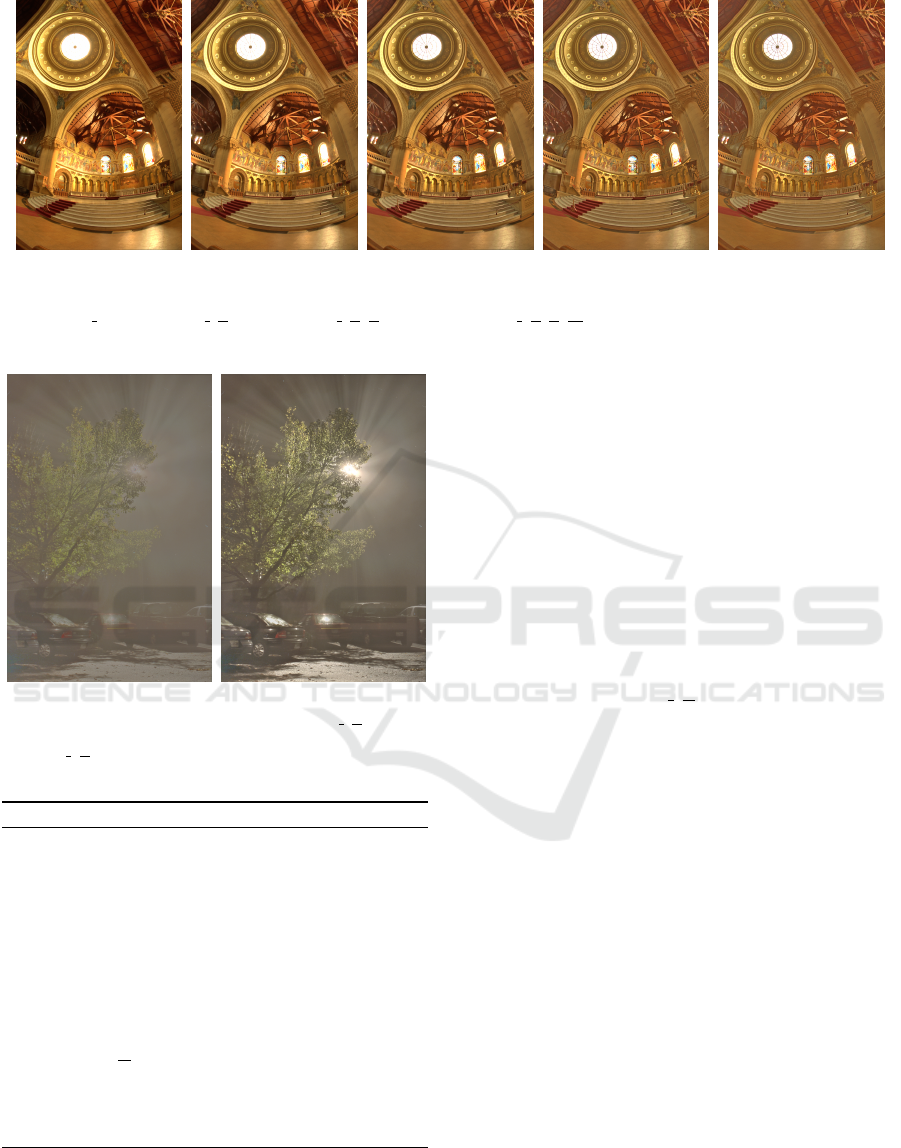
(a) (b) (c) (d) (e)
Figure 1: Applications of Storm with different kernels followed by and Leap
110
and gamma correction: (a) Storm
(1)
20
,
(b) Storm
(
1,
1
4
)
20
, (c) Storm
(
1,
1
4
,
1
16
)
20
, (d) Storm
(
1,
1
4
,
1
16
,
1
64
)
20
, and (e) Storm
(
1,
1
4
,
1
16
,
1
64
,
1
256
)
20
.
(a) (b)
Figure 2: Results of application of (a) Storm
(
1,
1
4
,
1
16
)
1
and (b)
Storm
(
1,
1
4
,
1
16
)
20
to the same image.
Algorithm 2: Storm.
Input: image I, brightening parameter a, M kernel
sizes s
j
, upper bound U
1: for all pixel i in I do
2: p = I(i)
3: L = max{p
R
, p
G
, p
B
}
4: L
0
= 0
5: for j = 1 to M do
6: L
0
= L
0
+ F
(
k
j
)
a
(i)
7: end for
8: R(i) =
L
0
L
p
9: end for
10: R = U · R/max(R(:))
Output: image R
image in O(1) per-pixel complexity. Next, to each
pixel Eq. (3) is applied M times and each time in O(1)
per-pixel complexity by using the integral image. To-
gether this gives O(M) per-pixel complexity, which
seemingly violates the constraint set up in the intro-
duction. However, M is supposed to be very small
because already for M ∈ {2,3,4} the results are of
high quality. Additionally, since M can be considered
a hyperparameter, once its value is chosen, it does not
change that often so it is effectively a constant. Thus,
taking all this into account, Storm can also be regar-
ded as having O(1) per-pixel complexity. Speed tests
in Section 4.2 also corroborate such reasoning.
After carrying out subjective assessment of a large
number of LDR images obtained by applying Storm
and Leap, it was concluded that the combination with
round default values that already produce visually
appealing results without showing unrealistically too
much details is Storm
(
1,
1
4
,
1
16
)
20
+Leap
110
.
4 EXPERIMENTAL RESULTS
4.1 Image Quality Metrics
The best way to the assess the quality of tone map-
ped images would be to carry out subjective percep-
tual studies. However, such studies were omitted here
because they are time-consuming, they require spe-
cial environment and carefully calibrated equipment,
and they are not easy to reproduce. Instead, two
objective measures are used: Feature Similarity In-
dex For Tone-Mapped images (FSITM) (Ziaei Naf-
chi et al., 2015) and the already mentioned TMQI.
TMQI-II was not used here because while images
with a high TMQI-II are usually of high quality, a
lot of images with a low TMQI-II are actually of
high quality as well. This is because TMQI-II is
too susceptible to mean grayscale value as shown
in (Bani
´
c and Lon
ˇ
cari
´
c, 2016). FSITM is based on
local phase information of images and it was shown
VISAPP 2018 - International Conference on Computer Vision Theory and Applications
50

(a) (b) (c)
Figure 3: Pairwise comparison between the results of Reinhard’s local TMO (Reinhard et al., 2002) on the left and
Storm+Leap on the right; for Reinhard’s TMO its Luminance HDR implementation with default parameter values was used.
Table 1: Mean TMQI and FSITM
G
TMQI obtained on images from (Ward, 2015) with cumulative execution time.
TMO TMQI FSITM
G
TMQI t(s)
Ashikhmin (Ashikhmin, 2002) 0.6620 0.7338 225.23
Drago (Drago et al., 2003) 0.7719 0.8158 30.69
Durand (Durand and Dorsey, 2002) 0.8354 0.8405 225.14
Fattal (Fattal et al., 2002) 0.7198 0.7810 64.78
Mantiuk (Mantiuk et al., 2006) 0.8225 0.8266 88.03
Mantiuk (Mantiuk et al., 2008) 0.8443 0.8494 36.20
Pattanaik (Pattanaik et al., 2000) 0.6813 0.7635 46.91
Reinhard (Reinhard et al., 2002) 0.8695 0.8581 33.41
Reinhard (Reinhard and Devlin, 2005) 0.6968 0.7679 30.01
Flash
10
0.8072 0.8315 21.19
Flash
10
+Leap
110
0.8755 0.8625 21.26
Storm
(
1,
1
4
,
1
16
)
20
0.7675 0.8004 24.35
Storm
(
1,
1
4
,
1
16
)
20
+Leap
110
0.8782 0.8551 24.59
to give better results than TMQI. If combined with
TMQI, it performs a better assessment than both
TMQI and TMQI-II and this combination is deno-
ted as FSITM
C
TMQI where C is a color channel. In
this paper the green (G) color channel is used since it
was shown to give good results (Ziaei Nafchi et al.,
2015). All these measures are in range [0,1] with a
higher number meaning higher quality. These metrics
are well established, easily reproducible, they have a
sound theoretical background, their values can be cal-
culated fast and automatically, and, all of them were
shown to be well correlated with subjective measures.
4.2 Tone Mapping Quality and Speed
The quality of the results of the proposed TMO was
evaluated by applying them to images in the HDR da-
taset given at (Ward, 2015). For TMOs with fixed
parameters this dataset is challenging since it con-
tains HDR images from different sources including
artificially generated ones. Table 1 shows the obtai-
ned values of objective quality measures for the pro-
posed and existing TMOs with default parameter va-
lues. For results of other TMOs the open source Lu-
minance HDR software was used like in (Ma et al.,
2015). This was also an opportunity to compare the
proposed TMOs to easily available implementations
of other well-known TMOs. The results for Flash dif-
fer from the ones given in (Bani
´
c and Lon
ˇ
cari
´
c, 2016)
because here the gamma correction was carried out
after tone mapping as it is supposed to be done. The
values of objective metrics are higher for Flash and
Storm than for all other tested TMOs and although
the differences are small, they still demonstrate the
quality of the proposed TMOs. Since Reinhard’s lo-
cal TMO (Reinhard et al., 2002) is considered to be
among the best, in Fig. 3 its results are compared to
the results of Storm.
Table 1 also shows that Flash and Storm are faster
than other TMOs, which makes them good candidates
for real-time applications.
5 CONCLUSIONS
A new TMO has been proposed in a global and local
variant under the constraints of O(1) per-pixel com-
plexity and a practical design. Both variants were
Flash and Storm: Fast and Highly Practical Tone Mapping based on Naka-Rushton Equation
51

shown to outperform state-of-the-art TMOs in terms
of resulting LDR image quality even though obtaining
high quality was only their secondary goal. Another
important fact is that the proposed TMO was shown
to be significantly faster than other TMOs. Its success
demonstrates how having implementation constraints
during the design phase of a TMO can nevertheless
lead to fast and practical TMOs that also produce re-
sults of the highest quality. Additionally, the steps
of the proposed TMO have their roots in the results
of perceptual experiments. Future work will consider
solutions that are less dependant on structures such as
integral images in order to decrease TMO’s memory
consumption and to make it more hardware-friendly.
REFERENCES
Ashikhmin, M. (2002). A tone mapping algorithm for high
contrast images. In Proceedings of the 13th Euro-
graphics workshop on Rendering, pages 145–156. Eu-
rographics Association.
Bani
´
c, N. and Lon
ˇ
cari
´
c, S. (2014a). Color Badger: A No-
vel Retinex-Based Local Tone Mapping Operator. In
Image and Signal Processing, pages 400–408. Sprin-
ger.
Bani
´
c, N. and Lon
ˇ
cari
´
c, S. (2014b). Improving the Tone
Mapping Operators by Using a Redefined Version of
the Luminance Channel. In Image and Signal Proces-
sing, pages 392–399. Springer.
Bani
´
c, N. and Lon
ˇ
cari
´
c, S. (2015). Smart Light Random
Memory Sprays Retinex: a fast Retinex implementa-
tion for high-quality brightness adjustment and color
correction. JOSA A, 32(11):2136–2147.
Bani
´
c, N. and Lon
ˇ
cari
´
c, S. (2016). Puma: A High-Quality
Retinex-Based Tone Mapping Operator. In Signal
Processing Conference (EUSIPCO), 2016 24rd Euro-
pean, pages 943–947. IEEE.
Bani
´
c, N. and Lon
ˇ
cari
´
c, S. (2017). Towards hardware-
friendly Retinex algorithms. In Image and Signal Pro-
cessing and Analysis (ISPA), 2017 10th International
Symposium on, pages 104–108. IEEE.
Bani
´
c, N. and Lon
ˇ
cari
´
c, S. (2016). Sensitivity of Tone Map-
ped Image Quality Metrics to Perceptually Hardly No-
ticeable Differences. In Proceedings of The Fifth Cro-
atian Computer Vision Workshop (CCVW 2013), num-
ber 1, pages 15–18. University of Zagreb Faculty of
Electrical Engineering and Computing.
Braun, G. J. and Fairchild, M. D. (1999). Image light-
ness rescaling using sigmoidal contrast enhancement
functions. Journal of Electronic Imaging, 8(4):380–
393.
Chiu, K., Herf, M., Shirley, P., Swamy, S., Wang, C., Zim-
merman, K., et al. (1993). Spatially nonuniform sca-
ling functions for high contrast images. In Graphics
Interface, pages 245–245. CANADIAN INFORMA-
TION PROCESSING SOCIETY.
Crow, F. C. (1984). Summed-area tables for texture
mapping. ACM SIGGRAPH computer graphics,
18(3):207–212.
Dowling, J. E. (1987). The retina: an approachable part of
the brain. Harvard University Press.
Drago, F., Myszkowski, K., Annen, T., and Chiba, N.
(2003). Adaptive logarithmic mapping for displaying
high contrast scenes. In Computer Graphics Forum,
volume 22, pages 419–426. Wiley Online Library.
Durand, F. and Dorsey, J. (2002). Fast bilateral filtering
for the display of high-dynamic-range images. ACM
transactions on graphics (TOG), 21(3):257–266.
Fairchild, M. D. (2015). http://rit-
mcsl.org/fairchild/hdrps/hdrthumbs.html.
Fattal, R., Lischinski, D., and Werman, M. (2002). Gradient
domain high dynamic range compression. In ACM
Transactions on Graphics (TOG), volume 21, pages
249–256. ACM.
Huang, J. and Mumford, D. (1999). Statistics of natural
images and models. In Computer Vision and Pat-
tern Recognition, 1999. IEEE Computer Society Con-
ference on., volume 1. IEEE.
Jobson, D. J., Rahman, Z.-u., Woodell, G., et al. (1997). A
multiscale retinex for bridging the gap between color
images and the human observation of scenes. Image
Processing, IEEE Transactions on, 6(7):965–976.
Koschan, A. and Abidi, M. (2008). Digital Color Image
Processing. Wiley.
Kuang, J., Yamaguchi, H., Johnson, G. M., and Fairchild,
M. D. (2004). Testing HDR image rendering algo-
rithms. In Color and Imaging Conference, volume
2004, pages 315–320. Society for Imaging Science
and Technology.
Kuang, J., Yamaguchi, H., Liu, C., Johnson, G. M., and
Fairchild, M. D. (2007). Evaluating HDR rendering
algorithms. ACM Transactions on Applied Perception
(TAP), 4(2):9.
Larson, G. W., Rushmeier, H., and Piatko, C. (1997). A vi-
sibility matching tone reproduction operator for high
dynamic range scenes. Visualization and Computer
Graphics, IEEE Transactions on, 3(4):291–306.
Ma, K., Yeganeh, H., Zeng, K., and Wang, Z. (2015). High
dynamic range image compression by optimizing tone
mapped image quality index. Image Processing, IEEE
Transactions on, 24(10):3086–3097.
Mantiuk, R., Daly, S., and Kerofsky, L. (2008). Display
adaptive tone mapping. In ACM Transactions on
Graphics (TOG), volume 27, page 68. ACM.
Mantiuk, R., Myszkowski, K., and Seidel, H.-P. (2006). A
perceptual framework for contrast processing of high
dynamic range images. ACM Transactions on Applied
Perception (TAP), 3(3):286–308.
Meylan, L. and Susstrunk, S. (2006). High dynamic
range image rendering with a retinex-based adap-
tive filter. Image Processing, IEEE Transactions on,
15(9):2820–2830.
Nguyen, R. M. and Brown, M. S. (2017). Why You
Should Forget Luminance Conversion and Do So-
mething Better. In Proceedings of the IEEE Confe-
VISAPP 2018 - International Conference on Computer Vision Theory and Applications
52

rence on Computer Vision and Pattern Recognition,
pages 6750–6758.
NTUST, C. G. G. (2015).
http://graphics.csie.ntust.edu.tw/pub/hdr/.
Pattanaik, S. N., Ferwerda, J. A., Fairchild, M. D., and
Greenberg, D. P. (1998). A multiscale model of adap-
tation and spatial vision for realistic image display. In
Proceedings of the 25th annual conference on Com-
puter graphics and interactive techniques, pages 287–
298. ACM.
Pattanaik, S. N., Tumblin, J., Yee, H., and Green-
berg, D. P. (2000). Time-dependent visual adap-
tation for fast realistic image display. In Procee-
dings of the 27th annual conference on Computer
graphics and interactive techniques, pages 47–54.
ACM Press/Addison-Wesley Publishing Co.
Peli, E. (1990). Contrast in complex images. JOSA A,
7(10):2032–2040.
Reinhard, E. and Devlin, K. (2005). Dynamic range re-
duction inspired by photoreceptor physiology. Visua-
lization and Computer Graphics, IEEE Transactions
on, 11(1):13–24.
Reinhard, E., Heidrich, W., Debevec, P., Pattanaik, S.,
Ward, G., and Myszkowski, K. (2010). High dynamic
range imaging: acquisition, display, and image-based
lighting. Morgan Kaufmann.
Reinhard, E., Stark, M., Shirley, P., and Ferwerda, J. (2002).
Photographic tone reproduction for digital images. In
ACM Transactions on Graphics (TOG), volume 21,
pages 267–276. ACM.
Schlick, C. (1995). Quantization techniques for visualiza-
tion of high dynamic range pictures. In Photorealistic
Rendering Techniques, pages 7–20. Springer.
Shapley, R. and Enroth-Cugell, C. (1984). Visual adaptation
and retinal gain controls. Progress in retinal research,
3:263–346.
Tumblin, J. and Rushmeier, H. (1993). Tone reproduction
for realistic images. Computer Graphics and Applica-
tions, IEEE, 13(6):42–48.
Tumblin, J. and Turk, G. (1999). LCIS: A boundary hierar-
chy for detail-preserving contrast reduction. In Pro-
ceedings of the 26th annual conference on Compu-
ter graphics and interactive techniques, pages 83–90.
ACM Press/Addison-Wesley Publishing Co.
Urbano, C., Magalh
˜
aes, L., Moura, J., Bessa, M., Marcos,
A., and Chalmers, A. (2010). Tone mapping operators
on small screen devices: an evaluation study. In Com-
puter Graphics Forum, volume 29, pages 2469–2478.
Wiley Online Library.
Ward, G. (1994). A contrast-based scalefactor for lumi-
nance display. Graphics gems IV, pages 415–421.
Ward, G. (2015). http://www.anyhere.com/gward/hdrenc/
pages/originals.html.
Wilson, H. R. (1991). Psychophysical models of spatial
vision and hyperacuity. Spatial vision, 10:64–81.
Yeganeh, H. and Zhou, W. (2013). Objective Quality As-
sessment of Tone Mapped Images. Image Processing,
IEEE Transactions on, 22(2):657–667.
Ziaei Nafchi, H., Shahkolaei, A., Farrahi Moghaddam, R.,
and Cheriet, M. (2015). FSITM: A Feature Similarity
Index For Tone-Mapped Images. Signal Processing
Letters, IEEE, 22(8):1026–1029.
Flash and Storm: Fast and Highly Practical Tone Mapping based on Naka-Rushton Equation
53
