EvoCells - A Treemap Layout Algorithm for Evolving Tree Data
Willy Scheibel, Christopher Weyand and J
¨
urgen D
¨
ollner
Hasso Plattner Institute | Faculty of Digital Engineering, University of Potsdam, Potsdam, Germany
Keywords:
Treemap Layout Algorithm, Time-varying Tree-structured Data, Treemap Layout Metrics.
Abstract:
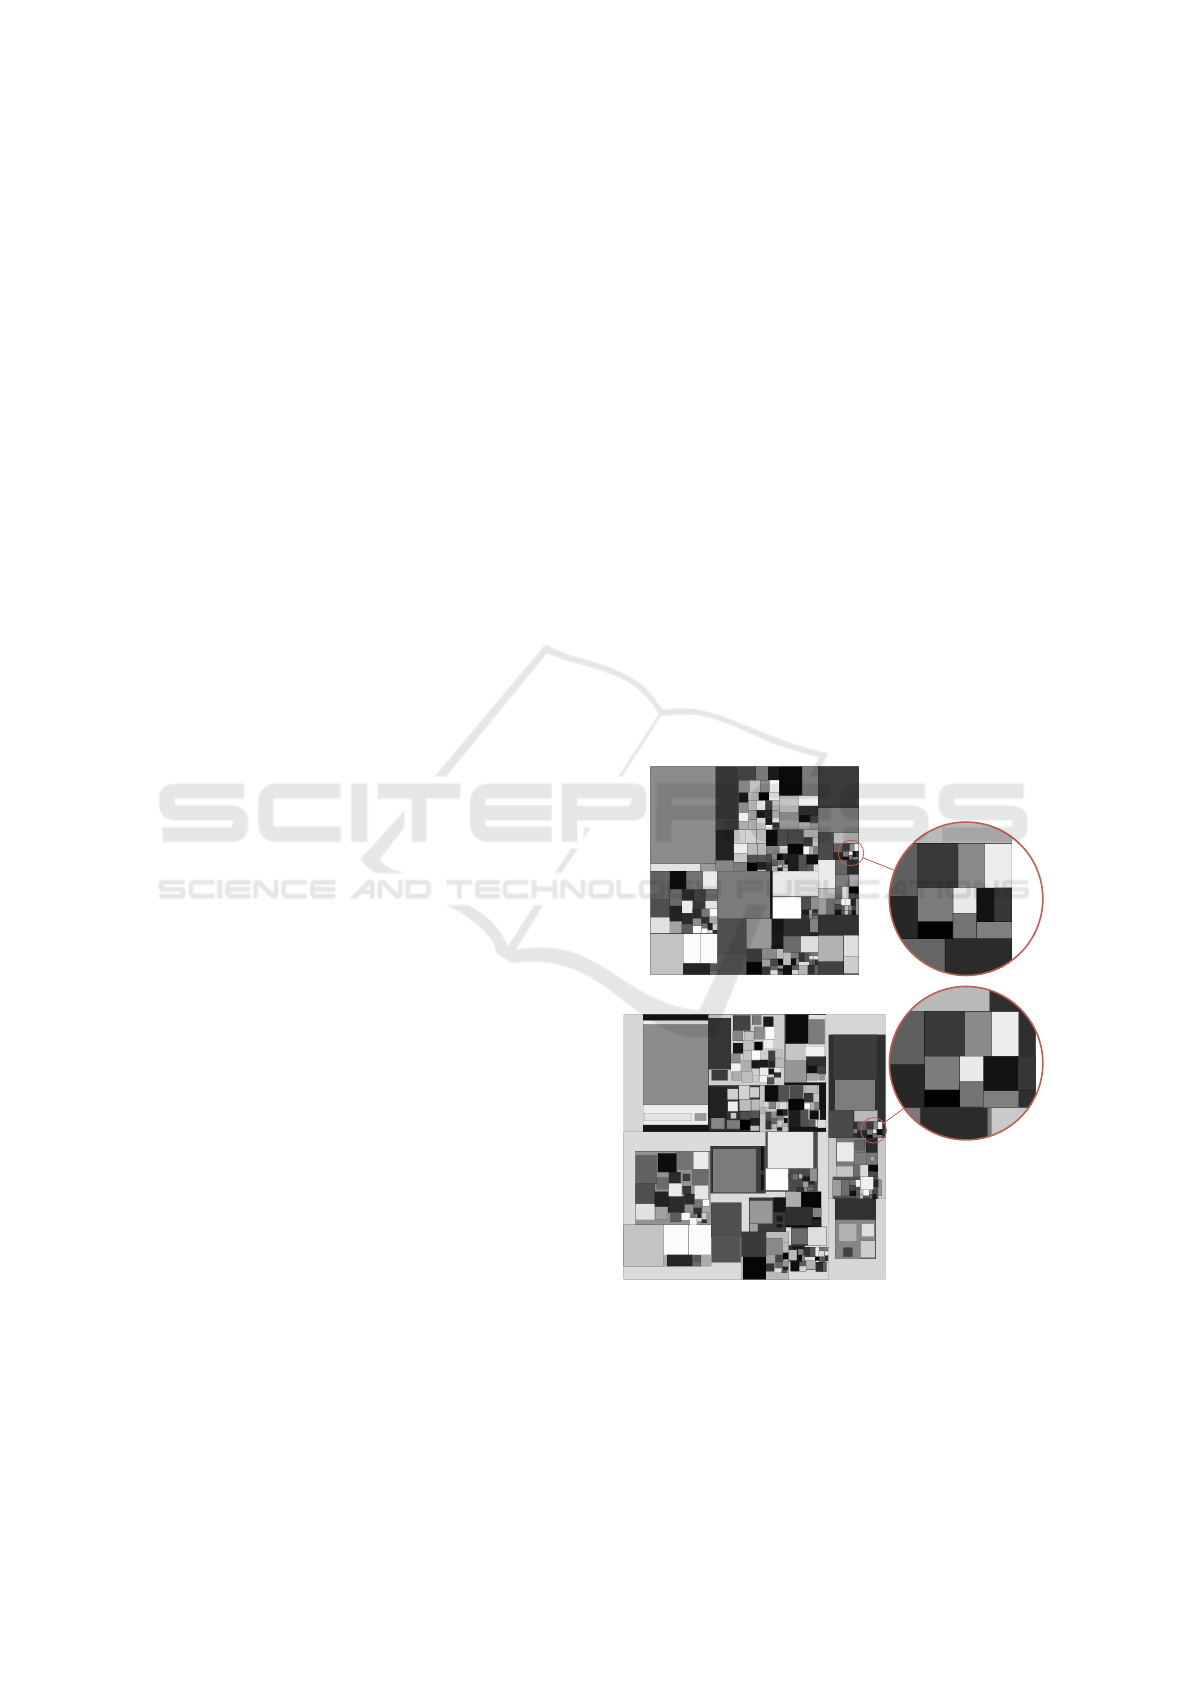
We propose the rectangular treemap layout algorithm EvoCells that maps changes in tree-structured data onto
an initial treemap layout. Changes in topology and node weights are mapped to insertion, removal, growth, and
shrinkage of the layout rectangles. Thereby, rectangles displace their neighbors and stretche their enclosing
rectangles with a run-time complexity of O(nlogn). An evaluation using layout stability metrics on the open
source ElasticSearch software system suggests EvoCells as a valid alternative for stable treemap layouting.
1 INTRODUCTION
Tree-structured data is subject to constant change.
In order to manage change, understanding the evo-
lution is important. An often used tool to commu-
nicate structure and characteristics of tree-structured
data is the treemap (Shneiderman, 1992). Most lay-
outs are based on a recursive partition of a given ini-
tial 2D rectangular area proportional to the summed
weights of the nodes. Besides topology and associ-
ated weights, additional visual variables can be used
(Carpendale, 2003), including extrusion of the 2D
layout to 3D cuboids. The restricted use of the third
dimension is reflected by the term 2.5D treemaps
(Limberger et al., 2017b).
When used over time, treemap layouts are faced
by their inherent instability regarding even minor
changes to the nodes’ weights used for the spatial
layouting, impeding the creation and use of a mental
map (Misue et al., 1995). Although a large number of
treemap algorithms exist, most of them operate solely
on the topology of tree-structured data and associated
node weights at one point in time. This could lead to
discontinuities between two successive layouts, con-
tradicting the principle of visual data correspondence
(Kindlmann and Scheidegger, 2014). Further, the use
of an adapted initial area to represent change in the
summed weight over time is underrepresented.
We propose a novel treemap layout algorithm that
maps evolving tree data onto an initial treemap layout.
This layout evolves alongside the tree data as all types
of changes are mapped onto the layout (example in
Fig. 1). Thereby, layout rectangles have a displacing
behavior against their neighbors and a stretching be-
havior to their parents. We evaluate our approach with
regard to algorithmic complexity and layout stability,
together with a case-study in the domain of software
analytics based on the software system ElasticSearch.
Initial State
Next State
Initial State
Next State
Initial State
Next State
Figure 1: An initial treemap layout and the EvoCells-
computed successor. The grayscale colors are pseudocolors
encoding the id of the nodes. The dataset is an animal pop-
ulation hierarchy of the zoological garden in Munich using
the population count as node weight (from 2011 to 2012).
Scheibel, W., Weyand, C. and Döllner, J.
EvoCells - A Treemap Layout Algorithm for Evolving Tree Data.
DOI: 10.5220/0006617102730280
In Proceedings of the 13th International Joint Conference on Computer Vision, Imaging and Computer Graphics Theory and Applications (VISIGRAPP 2018) - Volume 3: IVAPP, pages
273-280
ISBN: 978-989-758-289-9
Copyright © 2018 by SCITEPRESS – Science and Technology Publications, Lda. All rights reserved
273

2 RELATED WORK
The EvoCells algorithm is related to research on rect-
angular treemap layouting algorithms and general tree
spatialization techniques with focus on evolution. The
domain of software visualization includes additional
layout techniques that takes the specifics in structure
and evolution of tree-structured data into account.
Treemap Layouting Algorithms. Since the origi-
nal treemap layout algorithm (Shneiderman, 1992),
successive algorithms try to minimize characteristic
metrics such as the average aspect ratio as an ap-
proximation to the readability of nodes (Bruls et al.,
2000), distance change to approximate location sta-
bility of nodes between layouts (Bederson et al.,
2002), and angular change to approximate neighbor-
stability (Hahn et al., 2017). This resulted in algo-
rithms using space-filling curves (Tak and Cockburn,
2013) and hybrid treemaps (Hahn and D
¨
ollner, 2017).
Tree Layouting Algorithms. Besides layouting al-
gorithms resulting in rectangular treemaps, there are
layouting algorithms that can be used for evolv-
ing tree-structured data as the resulting layouts have
fewer degrees of freedom or are especially designed
for evolution. Early examples are SunBurst View
(Stasko et al., 2000) and the Hierarchical Bundle
View (Holten, 2006). While taking only the topol-
ogy of a tree into account, the Data-Jewelry Box al-
gorithm is especially designed for evolving data (Ya-
maguchi and Itoh, 2003). More current approaches
strive for more organic representation of nodes, such
as Gosper Maps (Auber et al., 2013) where the space-
filling Gosper curve is used to create map-like depic-
tions of a tree and stable Voronoi treemaps by use of
stable seed positions (Hahn et al., 2014).
Tree Comparison Techniques. Communicating
the evolution of tree-structured data can be achieved
by explicit comparison of two versions, e.g., by side-
by-side comparison (Scheibel et al., 2016) and ad-
ditional similarity indicators (Holten and Van Wijk,
2008; Telea and Auber, 2008). Another approach to
encode the evolution of topology and node weights
is to use a merged layout and encode the differences
in-situ (Tu and Shen, 2007). Current expert systems
use coordinated views on the same underlying data to
communicate change (Guerra-G
´
omez et al., 2013).
Software Visualization. In software visualization,
treemaps and treemap-like approaches are used.
There are software maps (Bohnet and D
¨
ollner, 2011),
Code Cities (Wettel and Lanza, 2008) and VERSO
(Langelier et al., 2008) represent software systems us-
ing nested rectangles. However, depicting the evolu-
tion is addressed using differing approaches, too. The
EvoStreets visualization technique (Steinbr
¨
uckner
and Lewerentz, 2010) represents the topology of a
software system by streets and roads for the module
hierarchy and cuboids and cylinders for source code
files. To ensure visual node location stability over
multiple states of a software system, dimensionality
reduction can be used to compute the position for a
node (Kuhn et al., 2008). Coordinated and multiple
views are used, too (Reniers et al., 2014).
3 EVOCELLS LAYOUTING
Treemap algorithms up to date compute a layout by
using one fixed state of a tree-structured dataset. We
propose an algorithm that takes previously computed
layouts into account, too. Although comparable to
template-based treemaps (Kokash et al., 2014), our
algorithm uses a packing instead of a splitting ap-
proach. EvoCells layouting computes a treemap lay-
out for one state of a tree-structured dataset by apply-
ing the changes to a treemap layout of another state.
Each change in topology and associated weights is
mapped onto a change to the layout, performing an
evolution of the initial layout (Fig. 2). The initial lay-
out can be created using any rectangular treemap al-
gorithm (e.g., Strip or Moore treemap layouting), in-
cluding EvoCells-computed layouts themselves. The
changes upon a node are mapped as follows:
Change Leaf Weight. The corresponding rectangle
is resized according to its weight.
Add Leaf. A new rectangle with area according to its
weight is added within the parent rectangle.
Remove Leaf. The rectangle is removed and leaves
empty space within the parent rectangle.
Move Leaf. The rectangle is removed from the lay-
out and readded within the new parent.
Add Parent. A new treemap layout for the sub-tree
of the new parent is computed and the resulting
rectangles are added into the layout.
Remove Parent. The parent rectangle with all its
children rectangles is removed from the layout.
Move Parent. The rectangle is removed (including
child rectangles) from the layout and readded
within the new parent, preserving the sublayout.
IVAPP 2018 - International Conference on Information Visualization Theory and Applications
274
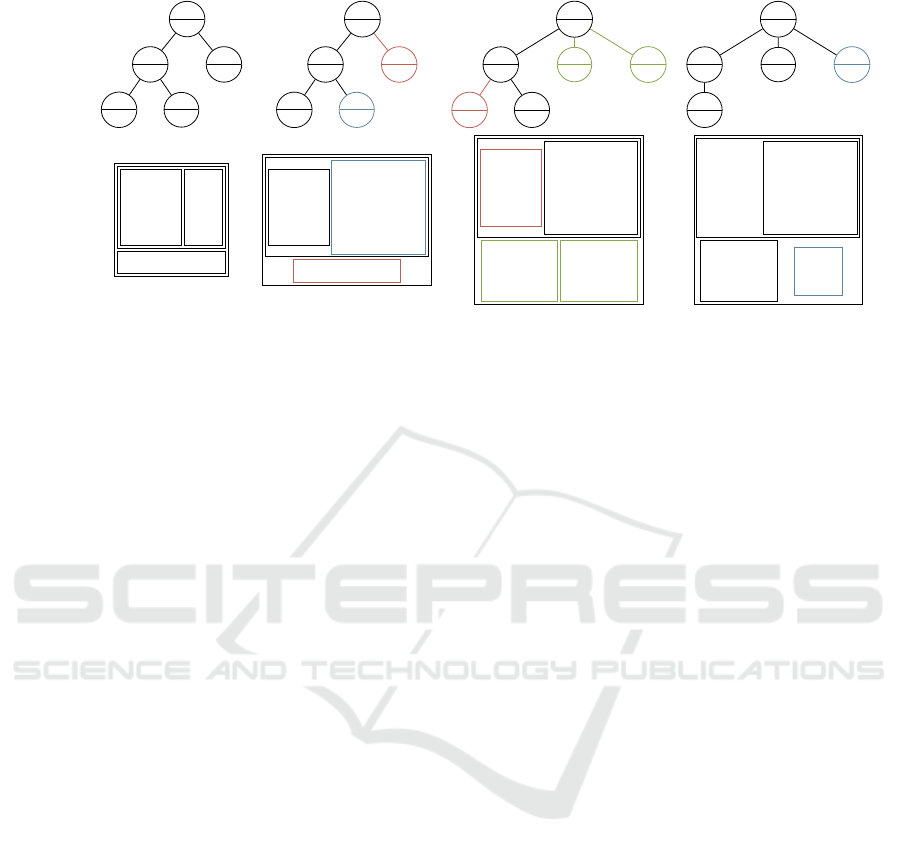
Initial State State 1 State 2 State 3
Tree
A
4
B
3
D
2
E
1
C
1
A
6
B
5
D
2
E
3
C
1
A
9
B
5
D
2
E
3
F
2
G
2
A
6
B
3
E
3
F
2
G
1
Layout
C | 1
D | 2 E | 1
C | 1
D | 2 E | 3
F | 2 G | 2
D | 2 E | 3
F | 2 G | 1
E | 3
Figure 2: An exemplary evolution of a tree-structured dataset (top) and the reflection using EvoCells layouting (bottom). Each
node and rectangle is labeled with a letter and a number representing identity and weight. Weight changes within one state
are indicated by a blue color, added nodes by a green color and nodes that are removed in the next state are colored red.
Changes in topology are detected separately for par-
ent nodes as a distinction allows for differing and opti-
mized handling during the actual layout process. Dur-
ing growth of a rectangle, it has a displacing behavior
against neighbors and a stretching behavior against
the parent. Both displacement and stretching propa-
gate through the layout and are resolved accordingly.
4 IMPLEMENTATION
An implementation of the EvoCells treemap layout al-
gorithm depends on the definition of a dataset struc-
ture and the according change computation between
two states. As treemap layout algorithm, EvoCells
is designated to be used within treemap visualization
systems (Fig. 3). We propose specialized interaction
techniques for the exploration of a dataset over time.
4.1 Dataset Structure
EvoCells layouting operates on a set of states S. Each
state S
i
consists of a rooted tree G
i
and a weight func-
tion w
i
. A state describes the system state for one
point in time. Since such a dataset represents one
changing system, trees of contiguous states mostly in-
clude common structure. The intersection of all nodes
over each tree includes at least the root v
root
. A differ-
ent root would imply a different system rather than an
evolution. Each tree G
i
satisfies the characteristics:
• G
i
= (V
i
, E
i
) is a rooted tree with n = |V
i
| nodes
including the root v
root
,
• m = n − 1 = |E
i
| edges E
i
⊂ V
i
×V
i
directed from
parent to child,
• only one node (v
root
) with no parent:
{v ∈ V
i
|@p ∈ V
i
: (p, v) ∈ E
i
} = {v
root
},
• every other node has exactly one parent:
∀v ∈V
i
: (v 6= v
root
=⇒ |{p ∈ V
i
|(p, v) ∈ E
i
}| = 1),
• and the weight w(p) of a parent node p is the sum
of its childrens’ weights:
∃(p, v
0
) ∈ E
i
=⇒ w
i
(p) =
∑
{v∈V
i
|(p,v)∈E
i
}
w
i
(v).
The weights for each state are defined as w
i
: V
i
7→ R
+
0
,
assigning a weight for each node in the state. The ini-
tial state is the state the initial layout is present for. An
initial state other than S
0
is possible, too, and allows
to compute layouts backwards in time.
4.2 Change Computation
Changes are computed by pairwise comparison of all
nodes in two states of a tree-structured dataset. A
domain-specific definition of node identity is required
to match nodes between states. As the changes are ap-
plied to the initial layout in sequence, the order influ-
ences the resulting layout. We propose to order them
by removals, moves, weight changes, and additions.
4.3 Change Application
Each change is sequently applied to the initial lay-
out, resulting in area changes, insertion, or removals
of rectangles. The area of a parent rectangle is only
updated through propagation of leaf rectangle growth
or displacement. A leaf rectangle area is defined
by the associated node weight and is set in propor-
tion to the sum of all leaf weights of the initial state
initWeightSum (i.e., the weight of the root node) and
their areas initAreaSum (i.e., the root rectangle area
EvoCells - A Treemap Layout Algorithm for Evolving Tree Data
275

Preprocessing
Mapping Image Synthesis
Tree Import
Initial Layouting
Change Extraction
EvoCells Layouting Geometry Creation Rendering
Data
Initial Tree
Tree List
Initial Layout
Changes
Layout
Geometry
Image
Figure 3: Example integration into a treemap visualization pipeline by means of an extension. EvoCells is integrated as two
new stages (EvoCells Layouting and Change Extraction). The preexisting layout stage is reused to compute the initial layout.
for splitting layouts). The area function is defined by:
a
i
(v) = w
i
(v)
initAreaSum
initWeightSum
In contrast to other treemap layout algorithms, the
definition of a
i
implies a constant area per weight over
all states. This allows for directly comparable areas
for all leaf nodes over all states.
Growing and Shrinking Nodes. A growth or
shrinkage of the rectangle is applied in proportion
to the increase or decrease in weight, respectively.
While adjusting the rectangle to cover the target area,
either its width, height, or both can be adapted. We
propose a squarifying approach where the rectangle
is gradually transformed to a square. The pivot point
of the rectangle is its center. This approach modifies
the visual characteristic (the aspect ratio) of the rect-
angle. Alternatively, both edge lengths can be resized
proportionally to ensure aspect ratio stability.
Appearing Nodes. When inserting a new node rect-
angle into the layout within a parent, the actual width
and height of the rectangle needs to get computed as
well as the insertion position. As the area of the rect-
angle is computed from one single weight value, we
propose a square. There are several approaches to
place the new rectangle in the layout. We suggest a
placement strategy that analyzes the four sides of the
parent rectangle on which the new rectangle can be
inserted to minimize the parent rectangle stretching
and whitespace. This provides a reasonable trade-off
between layout stability and computational effort.
Disappearing Nodes. A removed node allows for
two opponent approaches. The first approach retains
the corresponding rectangle but mark it as a ghost
(e.g., allowing for specialized depiction in a treemap
visualization, cf. Fig. 4). These ghosts can be deferred
removed after several more state changes. The second
approach is the immediate removal from the layout.
We recommend the ghost approach to enhance subse-
quent visual depiction and maintaining a mental map.
4.4 Interaction Techniques
The main scenario for EvoCells layouts is improved
layout stability for treemap-based exploration of a
tree-structured dataset over time. To support this, the
user has to select an initial state. From this state,
the dataset can be explored step by step (forwards or
backwards in time). To reduce free space, the user can
restore a compact treemap layout of the current state.
Choose Initial State. This interaction is similar to
stepping through states in a treemap visualization sys-
tem. Effectively, the user chooses a state using the
existing interaction techniques and starts an evolution
exploration mode, where the current state is used as
the initial one for EvoCells layouting.
Step State Forward. One scenario is the explo-
ration of future changes from an initial state. Using
this, the user may step states forward. The occurring
changes are applied to the layout in chronological or-
der.
Step State Backward. Contrary to stepping for-
ward in time, the user may choose to explore the pre-
ceding changes. The changes are applied in reverse
chronological order and in reverse effect (e.g., an ac-
tual change may have been an appearing node but
through the backward exploration in time, this change
is applied as a disappearing node).
Contract Treemap Layout. When finalizing an ex-
ploration, the user may return to a treemap layout that
is created using the layouting algorithm of the initial
layout but with the current target state.
Figure 4: Removed nodes from the dataset are rendered as
transparent ghosts to preserve the mental map (screenshot
taken from a software map visualization).
IVAPP 2018 - International Conference on Information Visualization Theory and Applications
276
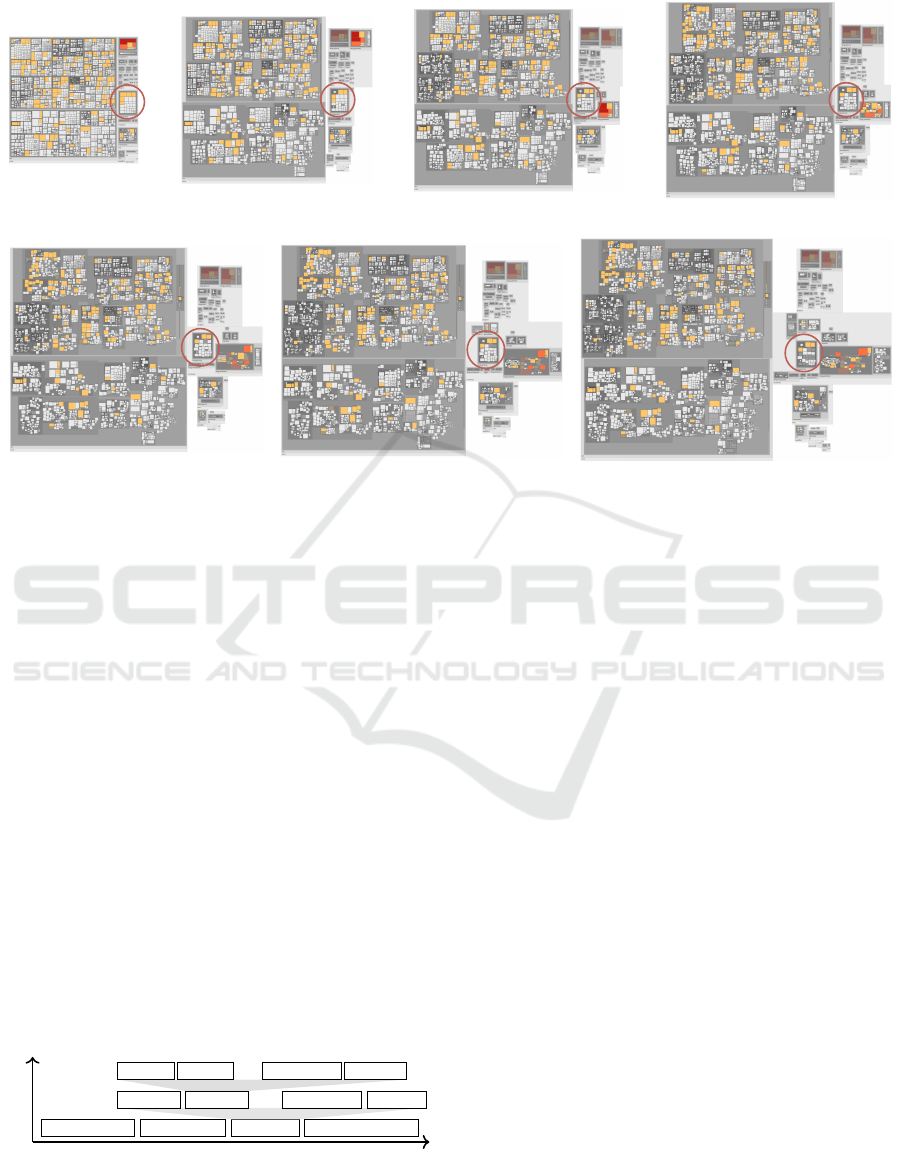
Initial Revision
Revision 1
Revision 2
Revision 3
Revision 4
Revision 5
Revision 6
Figure 5: The evolution of the ElasticSearch software project over six months using EvoCells layouting. Removed nodes
remains as ghosts in the layout. A particularly stable module is circled red in each revision.
5 EVALUATION AND RESULTS
We evaluate the algorithmic complexity of EvoCells
and stability of computed treemap layouts. Further,
we provide a short case study on the software project
ElasticSearch as a software visualization use case.
Software systems are a domain of tree-structured
data. The systems are contiguously measured by
means of software metrics, resulting in dataset con-
taining states for different points in time. Typically,
software projects are developed by applying indi-
vidual changes to source code files. To differenti-
ate between removed, added, removed, and changed
files, tracking the identity is important (Prause, 2009).
Each change to a source code file may change a mea-
sured metric value. Those changes are collected and
grouped to commits that reflect semantically coherent
changes to a software system—the revisions. Multi-
ple commits can be aggregated to represent higher-
level changes to the software system (Fig. 6).
Time
Granularity
Release 1.0 Release 2.0 Release 3.0 Release 4.0
Commit 1 Commit 2
. . .
Commit n - 1 Commit n
Change 1 Change 2
. . .
Change m - 1 Change m
Figure 6: Different levels of granularity to track changes of
a software system. EvoCells layouting can be used on each
granularity level with differing results for the layout.
5.1 Algorithmic Complexity Evaluation
The algorithmic complexity of the implementation is
O(ab
2
log
b
n) with n being the number of nodes in
the hierarchy, a the number of changes compared to
the initial state, and b the average number of children
for an inner node. Since any such algorithm must
consider all changes and each change potentially ef-
fects a node and all of its parents, our implementation
reaches the trivial lower bound in a and n. The resolu-
tion of overlapping rectangles by means of displace-
ment (currently in O(b
2
)) can further be optimized to
a lower bound of O(b logb) (Dwyer et al., 2007).
Considering typical datasets, the average number
of children for an inner node is considerably smaller
than the overall number of nodes. Assuming b as con-
stant and approximating the number of changes a per
state change by the number of nodes n (i.e., in a node
cannot be changed more than once in a state). There-
fore, the complexity can be simplified to O(n logn).
5.2 EvoCells for Software Visualization
For the case study, screenshots, and layout metric
computation, we implemented the EvoCells layout al-
gorithm into a prototypical software map visualiza-
tion system. The visualization pipeline is extended
by a change extraction and the EvoCells layouting al-
EvoCells - A Treemap Layout Algorithm for Evolving Tree Data
277
gorithm (see Fig. 3). In our example application us-
ing a software map visualization of ElasticSearch, the
file hierarchy and one software metric of the dataset
is used for the tree topology and associated weight at-
tribute. Here, the weight metric represents the quan-
tity of source code in the software system by using the
real lines of code (RLoC) as weight attribute. The ini-
tial layout was generated with the Squarified treemap
layout (Bruls et al., 2000) algorithm. We chose the
additional visual variable color that is mapped from
the cyclomatic complexity. The evolution of the lay-
out shows differences for modules with high changes
in topology and weights. Unchanged and marginally
changed modules have a high layout stability (Fig 5).
5.3 Layout Stability
The EvoCells layouting algorithm is compared
against the algorithms Hilbert, Moore, Slice’n’Dice,
Spiral, Squarified, Strip, and inverting Strip treemap
layouting. The layout stability is measured on the
ElasticSearch software project dataset using all seven
revisions. On average, the weight of more than one
thousand nodes changes with each revision. We ana-
lyzed the previously published metrics Average As-
pect Ratio, Location Drift, and Relative Direction
Change (Hahn et al., 2017) as well as the two addi-
tional metrics, Average Aspect Ratio Change and Rel-
ative Parent Change. The metrics for the seven revi-
sions were computed separate, pairwise, or—in case
of location drift—in sum. The separate and pairwise
metrics were aggregated to build a score over all re-
visions (see Fig. 7). To construct a single score per
layout algorithm, we combined the results using the
Borda Count (Hornik and Meyer, 2007).
Due to the packing approach, a layout generated
by EvoCells layouting is most probably not restrained
to a unit square. Thus, we applied the metric com-
putation to a normalized version of the layout. De-
pending on the type of normalization, each metric can
be affected. We chose an aspect-ratio-preserving nor-
malization to an area equal to the area of the unit
square. This does not affect the average aspect ra-
tio, its change, the relative parent change, and relative
direction change metrics. Values of the location drift
are more comparable regarding the other algorithms.
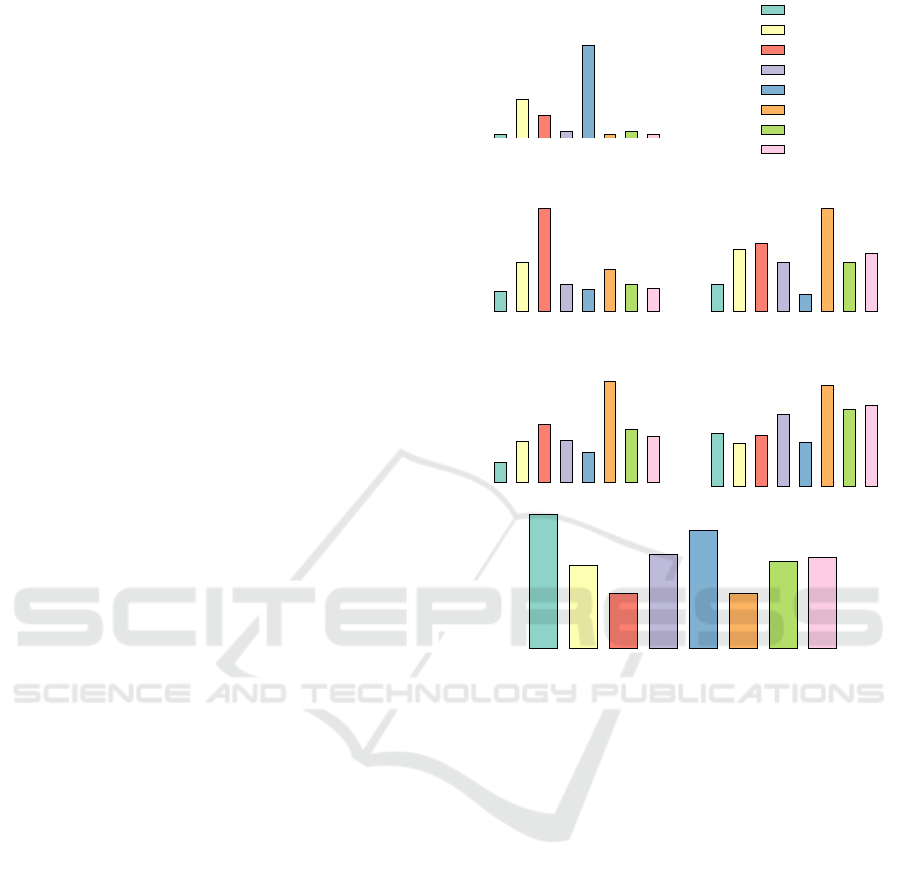
Average Aspect Ratio. The algorithms Spiral,
Squarified and EvoCells perform best in terms of av-
erage aspect ratio with values between 35 and 37. The
aspect ratio of the Slice’n’Dice algorithm with 864
is the highest among all compared algorithms. The
above-average results of EvoCells originate from the
underlying Squarified algorithm for the initial layout.
36.17
362.88
211.22
61.28
863.77
35.07
61.28
36
Average Aspect Ratio
EvoCells
Hilbert
Moore
Strip
SliceNDice
Spiral
StripInverted
Squarified
1.03
2.54
5.39
1.42
1.12
2.21
1.42
1.16
Avg. Aspect Ratio Change
0.02
0.05
0.05
0.04
0.01
0.08
0.04
0.04
Relative Parent Change
0.03
0.06
0.09
0.06
0.04
0.15
0.08
0.07
Relative Direction Change
0.03
0.02
0.03
0.04
0.02
0.06
0.04
0.05
Location Drift
34
21
14
24
30
14
22
23
Ranking by Borda Count
Figure 7: Comparison of the layout metrics average as-
pect ratio, average aspect ratio change, relative parent
change, relative direction change, and location drift (Bed-
erson et al., 2002; Hahn et al., 2017). A compound score
using Borda Count ranks the layout algorithms.
Average Aspect Ratio Change. This layout metric
measures the changes in percentage of aspect ratios
between two states and thus, approximates visual re-
semblance. EvoCells has the most stable aspect ra-
tios, which change on average by 3% between two
subsequent revisions. In contrast to the high aver-
age aspect ratio of Slice’n’Dice, its 12% change is the
second lowest among the compared algorithms. This
metric ignores changes in orientation, which benefits
Slice’n’Dice and penalizes algorithms as Moore.
Relative Parent Change. The relative parent
change measures the average change of position in
percent relative to the center of the parent rectan-
gle. This approximates the chance a user can relo-
cate the rectangle once they relocate the parent rectan-
gle. Slice’n’Dice has the best result with 0.01 closely
followed by EvoCells (0.02). With a relative parent
change of 0.08, the Spiral algorithm is most unstable.
IVAPP 2018 - International Conference on Information Visualization Theory and Applications
278

Relative Direction Change. The lowest relative di-
rection is measured for EvoCells with 0.03. The high-
est value is 0.15 for Spiral, which is approximately
66% more than Moore—the next lower algorithm.
Location Drift. Moore and Slice’n’Dice have the
lowest location drift (0.02). The highest location drift
is 0.06 by Spiral. The result of 0.03 for EvoCells de-
pends on the normalization we chose to apply. On the
one hand the normalization prevents location changes
beyond a rectangle with the area of a unit square, on
the other hand, it distorts the position of stationary
nodes, when the layout bounds change. This approach
favors centrifugal rectangle movements.
Ranking by Borda Count. The compound score
shows EvoCells is a treemap layout algorithm with
competitive stability characteristics for the Elastic-
Search dataset. It leads the score with special suit-
ability in the average aspect ratio change, relative par-
ent change, and relative direction change. Although
this result has to be verified using more datasets and
greater time spans to get reliable it indicates that Evo-
Cells is suitable for stable treemap layouting.
5.4 Supplementary Features
A treemap visualization system may be extended by
EvoCells layouting to support more stable treemap
layouts during evolution exploration. However, fur-
ther interaction and visualization techniques are re-
quired to provide a sophisticated tool. For exam-
ple, adding space between a parent rectangle and its
children helps in depicting the hierarchical structure
(L
¨
u and Fogarty, 2008). Besides layout-independent
color and height (D
¨
ubel et al., 2014) for leaf nodes,
an additional visual variable such as texture (Holten
et al., 2005) and sketchiness for uncertainty (Lim-
berger et al., 2016) can be used. The EvoCells lay-
outing algorithm is constructed to compute succes-
sive layouts where each two of them are interpolatable
without any node’s rectangle overlapping a sibling or
protruding its parent rectangle. This allows for disen-
tangled animated transitions (Bladh et al., 2005). Fur-
ther, some software projects have many modules and
source code files, making them hard to visualize with-
out visual clutter and meaningful pixels-to-elements
ratio. This can be avoided using importance-based
aggregation (Limberger et al., 2017a). In addition to
the reduction of visual elements, the aggregation can
be used to limit the tree depth on which EvoCells lay-
outing operates, improving computation run-time.
6 CONCLUSIONS
The EvoCells layouting algorithm is a novel rectan-
gular treemap layouting algorithm that applies the
evolution in topology and associated weights of a
tree-structured dataset onto an initial layout. This
layout algorithm performs well with regard to lay-
out stability and readability metrics. A compound
Borda Count score computed using the evolution of
one open source software project highlights EvoCells
layouting as the best algorithm. It is especially use-
ful for map themes using a weight mapping and data
domains with often-changing topology and nodes’
weights (e.g., software system data and business in-
telligence data, cf. Fig. 1). The algorithm can be inte-
grated into existing treemap-based visualization sys-
tems as an extension to the layouting phase.
For future work, we plan to integrate a layout
postprocessing where each node is attracted by the
center of the parent rectangle while remaining un-
overlapping. Parents may shrink during this process,
providing a gradually shrinking layout and thereby,
reduce empty space and overall layout size. Besides
the encoding of evolution in the layout rectangles of
a software map, the depiction of evolution in other
visual variables for leaf nodes can be expressed by
means of trends (W
¨
urfel et al., 2015) and Data Vases
(Thakur and Rhyne, 2009). A treemap layout tem-
plate (Kokash et al., 2014) may be derived from an
EvoCells layout to allow for an animated transition
back to a space-filling layout.
ACKNOWLEDGEMENTS
The authors would like to thank the anonymous
reviewers for their valuable comments and sug-
gestions to improve the paper. This work was
funded by the German Federal Ministry of Educa-
tion and Research (BMBF) within the BIMAP project
(www.bimap-project.de). We want to thank Seerene
(www.seerene.com) for providing the ElasticSearch
project and Munich zoological garden datasets.
REFERENCES
Auber, D., Huet, C., Lambert, A., Renoust, B., Sallaberry,
A., and Saulnier, A. (2013). Gospermap: Using a
gosper curve for laying out hierarchical data. IEEE
TVCG, 19(11):1820–1832.
Bederson, B. B., Shneiderman, B., and Wattenberg, M.
(2002). Ordered and quantum treemaps: Making ef-
fective use of 2d space to display hierarchies. ACM
Transactions on Graphics, 21(4):833–854.
EvoCells - A Treemap Layout Algorithm for Evolving Tree Data
279

Bladh, T., Carr, D. A., and Kljun, M. (2005). The effect
of animated transitions on user navigation in 3d tree-
maps. In Proc. IEEE IV, pages 297–305.
Bohnet, J. and D
¨
ollner, J. (2011). Monitoring code quality
and development activity by software maps. In Proc.
ACM MTD ’11, pages 9–16.
Bruls, M., Huizing, K., and van Wijk, J. J. (2000). Squari-
fied treemaps. In Proc. Joint EUROGRAPHICS/IEEE
TCVG Data Visualization ’00, pages 33–42.
Carpendale, M. (2003). Considering visual variables as a
basis for information visualisation. Technical report,
University of Calgary.
D
¨
ubel, S., R
¨
ohlig, M., Schumann, H., and Trapp, M. (2014).
2d and 3d presentation of spatial data: A systematic
review. In Proc. IEEE 3DVis ’14, pages 11–18.
Dwyer, T., Marriott, K., and Stuckey, P. J. (2007). Fast
node overlap removal—correction. In Proc. Springer
Graph Drawing ’06, pages 446–447.
Guerra-G
´
omez, J., Pack, M. L., Plaisant, C., and Shneider-
man, B. (2013). Visualizing change over time using
dynamic hierarchies: Treeversity2 and the stemview.
IEEE TVCG, 19(12):2566–2575.
Hahn, S., Bethge, J., and D
¨
ollner, J. (2017). Relative di-
rection change – a topology-based metric for layout
stability in treemaps. In Proc. SciTePress IVAPP ’17,
pages 88–95.
Hahn, S. and D
¨
ollner, J. (2017). Hybrid-treemap layouting.
In Proc. EuroVis ’17 – Short Papers.
Hahn, S., Tr
¨
umper, J., Moritz, D., and D
¨
ollner, J. (2014).
Visualization of varying hierarchies by stable layout
of voronoi treemaps. In Proc. SciTePress IVAPP ’14,
pages 50–58.
Holten, D. (2006). Hierarchical edge bundles: Visualiza-
tion of adjacency relations in hierarchical data. IEEE
TVCG, 12(5):741–748.
Holten, D. and Van Wijk, J. J. (2008). Visual comparison of
hierarchically organized data. EG Computer Graphics
Forum, 27(3):759–766.
Holten, D., Vliegen, R., and van Wijk, J. J. (2005). Visual
realism for the visualization of software metrics. In
Proc. IEEE VISSOFT ’05, pages 1–6.
Hornik, K. and Meyer, D. (2007). Deriving consensus rank-
ings from benchmarking experiments. In Springer Ad-
vances in Data Analysis, pages 163–170.
Kindlmann, G. and Scheidegger, C. (2014). An alge-
braic process for visualization design. IEEE TVCG,
20(12):2181–2190.
Kokash, N., de Bono, B., and Kok, J. (2014). Template-
based treemaps to preserve spatial constraints. In
Proc. SciTePress IVAPP ’14, pages 39–49.
Kuhn, A., Loretan, P., and Nierstrasz, O. (2008). Consis-
tent layout for thematic software maps. In Proc. IEEE
WCRE ’08, pages 209–218.
Langelier, G., Sahraoui, H., and Poulin, P. (2008). Explor-
ing the evolution of software quality with animated
visualization. In Proc. IEEE VL/HCC ’08, pages 13–
20.
Limberger, D., Fiedler, C., Hahn, S., Trapp, M., and
D
¨
ollner, J. (2016). Evaluation of sketchiness as a vi-
sual variable for 2.5d treemaps. In Proc. IEEE IV ’16,
pages 183–189.
Limberger, D., Scheibel, W., Hahn, S., and D
¨
ollner, J.
(2017a). Reducing visual complexity in software
maps using importance-based aggregation of nodes.
In Proc. SciTePress IVAPP ’17, pages 176–185.
Limberger, D., Scheibel, W., Trapp, M., and D
¨
ollner, J.
(2017b). Mixed-projection treemaps: A novel ap-
proach mixing 2d and 2.5d treemaps. Proc. IEEE IV
’17.
L
¨
u, H. and Fogarty, J. (2008). Cascaded treemaps: Examin-
ing the visibility and stability of structure in treemaps.
In Proc. GI ’08, pages 259–266. Canadian Informa-
tion Processing Society.
Misue, K., Eades, P., Lai, W., and Sugiyama, K. (1995).
Layout adjustment and the mental map. Elsevier Vi-
sual Languages & Computing, 6(2):183–210.
Prause, C. R. (2009). Maintaining fine-grained code meta-
data regardless of moving, copying and merging. In
Proc. IEEE SCAM ’09, pages 109–118.
Reniers, D., Voinea, L., Ersoy, O., and Telea, A. (2014). The
solid* toolset for software visual analytics of program
structure and metrics comprehension: From research
prototype to product. Elsevier Science of Computer
Programming, 79:224–240.
Scheibel, W., Trapp, M., and D
¨
ollner, J. (2016). Interactive
revision exploration using small multiples of software
maps. In Proc. SciTePress IVAPP ’16, pages 131–138.
Shneiderman, B. (1992). Tree visualization with tree-maps:
2-d space-filling approach. ACM Transactions on
Graphics, 11(1):92–99.
Stasko, J., Catrambone, R., Guzdial, M., and McDonald,
K. (2000). An evaluation of space-filling information
visualizations for depicting hierarchical structures. El-
sevier Human-Computer Studies, 53(5):663–694.
Steinbr
¨
uckner, F. and Lewerentz, C. (2010). Representing
development history in software cities. In Proc. ACM
SOFTVIS ’10, pages 193–202.
Tak, S. and Cockburn, A. (2013). Enhanced spatial sta-
bility with hilbert and moore treemaps. IEEE TVCG,
19(1):141–148.
Telea, A. and Auber, D. (2008). Code flows: Visualizing
structural evolution of source code. EG Computer
Graphics Forum, 27(3):831–838.
Thakur, S. and Rhyne, T.-M. (2009). Data vases: 2d and 3d
plots for visualizing multiple time series. In Springer
Advances ISVC, pages 929–938.
Tu, Y. and Shen, H. W. (2007). Visualizing changes
of hierarchical data using treemaps. IEEE TVCG,
13(6):1286–1293.
Wettel, R. and Lanza, M. (2008). Visual exploration of
large-scale system evolution. In Proc. IEEE WCRE
’08, pages 219–228.
W
¨
urfel, H., Trapp, M., Limberger, D., and D
¨
ollner, J.
(2015). Natural Phenomena as Metaphors for Visu-
alization of Trend Data in Interactive Software Maps.
In Proc. EG CGVC ’15.
Yamaguchi, Y. and Itoh, T. (2003). Visualization of dis-
tributed processes using ”data jewelry box” algorithm.
In Proc. IEEE CGI ’03, pages 162–169.
IVAPP 2018 - International Conference on Information Visualization Theory and Applications
280
