
A Wearable Embedded System for Detecting Accidents while Running
Vincenzo Carletti, Antonio Greco, Alessia Saggese, Mario Vento and Vincenzo Vigilante
Dep. of Information Engineering, Electrical Engineering and Applied Mathematics, University of Salerno, Italy
Keywords:
Fall Detection, Embedded Systems, Wereable Devices.
Abstract:
Every year 424,000 fatal accidents occur, they are the second cause of unintentional death after road traffic
injuries. The difference between fatal and not fatal accidents often is the presence of other people able to
promptly provide first aid or call for help. Unfortunately, even during the practice of group activities (e.g.
team sports) an accident can happen when a person is alone or out of sight; thus, the availability of devices
able to detect if a serious accident is occurred and consequently arise an alarm to other people is an important
issue for the safety of people. Starting from these considerations, in this paper we propose a wearable device
able to detect accidents occurring during the practice of running. The device uses a one class SVM trained only
on the normal activity and classifies as anomalies all the unknown situations. Then, in order to avoid alarms
related to non dangerous events, the output of the classifier is analyzed by an additional stage responsible to
detect if the person is or not unconscious after an abnormal event. In the former case an alarm is arisen by the
system.
1 INTRODUCTION
The number of fatal accident occurring each year has
been estimated around 424,000, and this is the second
cause of unintentional death after road traffic injuries.
Approximately 37.3 million falls are severe enough to
require medical attention (Sadigh et al., 2004; Kalace
et al., 2008; Igual et al., 2013), and the seriousness of
these accidents is higher if they happen when people
are alone or out of sight, situation that typically occurs
when people are doing some sports.
Therefore, the availability of a device that can be
easily worn by the sportsman and able to instantane-
ously alert other people when an accident occurs can
considerably reduce the consequences. Of course, the
detection of falls strongly depends on the monitored
activity. Indeed, a fall can be considered as an abnor-
mal pattern in a traditional pattern recognition pro-
blem, and something that can be considered normal
in a sport could be abnormal in a different sport.
For instance, the problem of detecting falls of
skying person is completely different if compared
with the same task on people who are running. The
complexity and the diversity of fall detection is con-
firmed by the growing interest, in the recent years,
of the scientific community ((Delahoz and Labrador,
2014; Brun et al., 2014; Habib et al., 2014; Koshmak
et al., 2016; Khan and Hoey, 2017)). From the above
papers, we can note that it is possible to identify two
main classes of fall detection systems: context-aware
systems and wearable systems. In the first case the sy-
stem is installed in the environment where the people
to be monitored acts and uses sensors (like cameras,
acoustic sensors, pressure sensors, infrared sensors,
lasers and Radio Frequency Identification) that are
properly deployed inside the monitored area. The ad-
vantage in this case is that the targeted person does not
need to wear or carry any special device. However,
they are suitable for those situations where the envi-
ronment to monitor is well defined and circumscribed
such as hospitals, nursing house or other indoor envi-
ronment. If the activity is performed in a wide and un-
controlled area, this kind of systems becomes unsuit-
able due to the restrictions imposed by the mobility
of the person. As an example, if the aim is to moni-
tor running people, we should limit the activity inside
a gym avoiding the people to run outside. Wearable
systems are evidently the solution to the above issues
when the monitored environment is not restricted or a-
priori known, and the activity can be practiced every-
where. In general, there are specialized devices com-
posed of an elaboration unit and a batch of sensors
like accelerometers, gyroscopes and magnetometers
used to analyze people motion. In addition, these de-
vices provide some kind of wireless connectivity to
communicate with a smartphone in case of accidents,
so as to phone some sets of emergency number. Dif-
ferently from context-aware systems that can be in-
Carletti, V., Greco, A., Saggese, A., Vento, M. and Vigilante, V.
A Wearable Embedded System for Detecting Accidents while Running.
DOI: 10.5220/0006612805410548
In Proceedings of the 13th International Joint Conference on Computer Vision, Imaging and Computer Graphics Theory and Applications (VISIGRAPP 2018) - Volume 4: VISAPP, pages
541-548
ISBN: 978-989-758-290-5
Copyright © 2018 by SCITEPRESS – Science and Technology Publications, Lda. All rights reserved
541

stalled on servers, the hardware in wearable systems
is strongly limited by the size and the consumption.
Indeed, they must be comfortable to wear and gua-
rantee to be active for all the duration of the monito-
red activity (often a couple of hours). For this reason,
most of these systems use very simple fall detection
threshold-based algorithms aimed to provide a good
trade-off between the accuracy and the computational
requirements. A first impact based system has been
proposed by (Chen et al., 2005); falls are detected by
estimating the posture and by evaluating if the magni-
tude of the accelerometer is higher than a fixed thres-
hold. Other interesting methods using accelerometer
and gyroscope have been proposed by (Bourke et al.,
2008; Bourke and Lyons, 2008; Bourke et al., 2010).
Such methods differ in terms of used sensors, sen-
sor positioning, and threshold. In particular, (Bourke
et al., 2010) have proposed a system placed on the
waist that uses thresholds in velocity, impact and pos-
ture. However, as highlighted in (Bagal et al., 2012),
most of these systems are designed and tested to work
in very simple situations such as monitoring elder pe-
ople who are walking so as to detect falls, thus when
they are applied in real environments or on more com-
plex tasks their performance drastically collapses.
Only recently, more complex approaches based
on machine learning techniques have been proposed
by (Choi et al., 2011; Abbate et al., 2012; Albert et al.,
2012; Shi et al., 2012; Fahmi et al., 2012; Khan and
Hoey, 2017). Among them, the most interesting met-
hods by (Jie Yin et al., 2008; Medrano et al., 2014;
Micucci et al., 2017) are based on the observation that
obtaining a large amount of training data of falls is un-
reasonable, but it is possible instead to obtain a large
amount of data for Activity of Daily Living (ADL)s,
corresponding to normal patterns. Thus, the detection
of falls happening during the execution of daily living
activities can be faced as an anomaly detection pro-
blem where the system is trained only on the ADLs
and considers them as normal patterns, while classi-
fying every other situation (e.g. falls) as an abnormal
pattern. As evident, a similar assumptions can hold if
we move from falls of elder persons to falls of sports-
man.
In this paper, we will focus on the detection of
falls happening during the practice of sports, with par-
ticular reference to running. In more details, we de-
sign and develop a device to be worn by the sportsman
on the wrist, like a watch. The main advantage in this
choice lies in the fact that such a device is unobtru-
sive, since it is comfortable to wear (e.g. no need to
take them off while sleeping or changing clothes) and
require little or no maintenance (e.g. charging once a
month, no other interaction required). However, this
Figure 1: General structure of the proposed fall detection
algorithm.
position makes the fall detection problem more com-
plex to be solved. Indeed, differently with respect to
the head or to the waist (positions typically adopted
in the literature), which are in-built with the body of
the person and thus move by following the movement
of the body, the wrist is not in-built with the body, but
have instead some random movements (different with
respect to the ones of the body) that need to be taken
into account.
Another important contribution of this paper is
that both the data acquisition and the processing steps
are performed in real time directly on board of the
embedded device; however, the method has been de-
signed so as to avoid paying the limited resources of
the hardware with a decreasing in the accuracy. In-
deed, a first stage (fall detection) is performed by a
multi-stage classification using a One-Class Support
Vector Machine (OC-SVM) trained on the data that
have been collected during different normal running
sessions. Furthermore, a second classification stage
(consciousness verification) is performed so as to also
evaluate the temporal information and to effectively
understand the unconsciousness of a falling person.
The paper is organized as follows: in Section 2 the
details of the proposed approach are provided, while
in Section 3 some preliminary results have been re-
ported. Finally, some conclusions and future works
are drawn in Section 4.
2 THE PROPOSED SYSTEM
The proposed system has been designed so as to be
independent on other devices and comfortably weara-
ble on the wrist, combined with bracelet or a smart-
watch. Such a choice imposes several limitations on
the hardware resources available to perform detection
and classification stages, so it is important to find out
the best trade-off between the expected accuracy of
the system and the resources required to achieve it. In
Figure 1 we show the structure of the proposed sy-
stem.
We designed and realized an hardware prototype
equipped with a low power MCU Cortex-M4 and
two inertial sensors: a three-axes accelerometer and a
three-axes gyroscope. In order to deal with the com-
plexity of the task and to achieve good performance,
VISAPP 2018 - International Conference on Computer Vision Theory and Applications
542

we propose a multi-stage fall detection system, wor-
king as follows: the first stage, namely detection
stage, is based on a One-Class SVM (OC-SVM) and
is responsible to detect the abnormal patterns with
respect to the given normal model; the second stage
(consciousness verifier), activated only after that the
detection stage fires an alarm, aims to establish whet-
her the user is still moving after the detected falls or
if he can be considered as unconscious. The two sta-
ges are connected each other by an interstage filter,
aimed to eliminate spurious detections. Since they
have different goals, the two stages work on diffe-
rent features, computed on a sliding time window of
two second. The sampling rate considered is 100Hz,
so that each window contains 200 measures per each
of the six axes (3 from the accelerometer and 3 from
the gyroscope). Due to the nature of the problem, it
is important to note that an event of interest can be
contained in more than one window, thus we conside-
red overlapped windows so that two consecutive time
windows share a subset of their measures.
2.1 Fall Detector
The core of our system is represented by the fall de-
tection module. It is responsible to continuously ana-
lyze the feature vectors extracted form the sensors
and to detect if a fall occurs during the normal acti-
vity. As mentioned before, this task is performed by a
OC-SVM trained on the expected patterns of a normal
activity. In order to reduce the battery consumption,
the detection stage is activated each 250 milliseconds
(4Hz). Furthermore, in order to avoid losing impor-
tant patterns, successive sliding windows share the
87,5% of their measures. Another important consi-
deration which allows us to have an energy efficient
system is related to the feature vector used by the
SVM. Indeed, we have reduced as much as possible
the number of features and at the same time we have
avoided the use of features that are expensive to com-
pute, such as spectral features. Therefore, according
to the current scientific literature, for each sensor, we
have computed the following features:
• Average value of the magnitude computed on the
vector resulting from the three axes.
• The maximum and the minimum value of each
axis.
• The distance between the maximum and the mini-
mum value of each axis.
• Speed of variation (SPV) in the time interval t
min
,
t
max
from the minimum value x
min
to the maxi-
mum value x
max
for each axis:
x
spv
=
x
max
− x
min
t
max
−t
min
(1)
• The maximum instantaneous variation of each
axis in two consecutive time instants k − 1 and k
(a.k.a. Slope):
x
slope
= max
k=1:N
|x(k) − x(k − 1)|, (2)
being N the number of samples in the window un-
der analysis.
• The Signal Magnitude Area (SMA) that is a mea-
sure of the magnitude of a single sensor over the
three axes x, y and z. It is defined as:
sma =
1
N
(
N
∑
i
x(i) +
N
∑
i
y(i) +
N
∑
i
z(i)
)
(3)
Note that for brevity we have shown only one axis for
the SPV and the slope. Since different sensors have
different scales, after the collection we have firstly
standardized the features by using the Z-Score and
then normalized with respect to the norm of the vec-
tor.
One drawback of OC-SVM algorithm, compared
to simpler approaches like KNN, is that the selection
of parameters can be quite tricky and a wrong choice
could have serious effects on the overall final perfor-
mance of the system. In our case, we have used an
RBF kernel, thus we have to select both the regulari-
zation factor ν and the kernel size γ. Firstly, in order to
get a lightweight classifier that fits the memory avai-
lable on the device, we have limited ν to have no more
than 300 support vectors in the model. The SVM pa-
rameter optimization has been performed via genetic
algorithm (GA-SVM). Typical GA-SVM approaches
use genetic evolution just to set the regularization and
the kernel size. Differently form the latter, we ex-
ploited the GA to obtain an optimal shaping of the
kernel. This shaping is achieved using ad-hoc fea-
ture scaling by assigning different weights to the each
feature before training. In this case, the prediction
will correspond to project the vector in feature space
with a non-spherical kernel. So that, a chromosome is
composed by the two parameters ν and γ followed by
one weight for each feature, while the fitness function
is represented by the area under the Precision-Recall
curve. The choice of considering the Precision-Recall
curve instead of the ROC curve is due to the fact that
the a-priori distribution of the data sets is not balan-
ced. The number of negative samples in the dataset is
much larger than the number of positive ones. The-
refore, the false positive rate becomes an optimistic
index, while the precision will be much more suitable
to control the real performance of the classifier.
A Wearable Embedded System for Detecting Accidents while Running
543

2.2 Interstage Filter
The interstage filtering is an extension of the concept
of confidence window. In real world, events evolve
with continuity; in other words, if a person is falling at
12:00:00.000, he will be still falling at 12:00:00.250
and at 12:00:00.500. According to this consideration
we can filter false alarms that appear as isolated ano-
malous classifications by taking the mean value of
last decisions. The effect of this mean operation is
that decisions will appear low pass filtered and shif-
ted ahead in time, so that events are recognized with
delay. A more accurate way of performing this filte-
ring is using confidence values instead of binary clas-
sification results: samples that are clearly anomalous
or clearly normal to the classifier will have a larger
weight with respect to those that are borderline. We
use a confidence window one second large (4 classifi-
cation results) and consider anomalous only the ones
containing at least 50% of anomalous samples. In ot-
her words, we use a 50% of confidence. We did not
use a stricter criterion in order not to affect recall: in-
deed, remaining false alarms will be filtered by the
consciousness verification stage.
2.3 Consciousness Verification
The aim of the second stage is to verify if the user is
still conscious after a fall. If the first stage algorithm
detects a fall, then the second stage will be in charge
of checking if the user is still lying on the ground after
a certain amount of time or if he got up to continue the
activity. This allows to distinguish serious accidents
that may lead to injuries from those with no conse-
quences, in which persons stand up just after the fall.
The second stage also allows to filter out false alarms
coming from the first stage.
Note that, since the second stage algorithm will
filter out false alarms coming from the previous sta-
ges, we can tune the fall detector in order to achieve a
high recall (no real alarms lost) even at the expense of
precision; that is a more sensitive detection stage that
will hardly ignore a real fall but will produce some
false alarms, since the second stage is expected to fil-
ter them out.
The consciousness verifier uses its own features,
i.e. the average motion index (m − index). This mea-
sure is intended to summarize the quantity of motion
of the used perceived by the sensor and represents the
average acceleration sensed in a 1 second window be-
fore the current sample minus the module of gravity.
More formally:
m(kT
s
) =
k
∑
i=k−
1
T
s
||
*
a(iT
s
)| − |
*
g|| (4)
where |
*
g| = 1000mG is the estimated module of
the gravity vector,
*
a is the acceleration vector measu-
red at time t and T
s
is the sampling time.
It is easy to understand that such a measure can
be used to discern whether the user is moving or is
almost still using as only input the module of sen-
sed acceleration. The idea is that, when the user is
moving, some produced acceleration will sum to the
constant gravity module and, on average, will give a
considerably high value of the m − index; when the
user is not moving, on the other side, only gravity and
noise will figure in sensed acceleration value and, if
we subtract |
*
g| to |
*
a| we will get a value quite close
to zero, i.e. just the noise. For this stage, a window
of 6 seconds is considered after the fall. The user is
considered unconscious if the m − index index is lo-
wer than a given threshold (in our case 100 mG) for
more then the 50% of the window. An example of this
stage at work is shown in Figure 3.
3 EXPERIMENTS
In this section we are going to show the results
achieved by the proposed approach. We first intro-
duce the protocol used in our experimentation (Sub-
section 3.1); then, in Subsection 3.2 the dataset used
for testing the proposed approach will be described
before presenting the results in Subsection 3.3.
3.1 Experimental Protocol
The performance of the proposed appriach has been
evaluated in terms of Precision (P) and Recall (R):
P =
T P
T P + FP
(5)
R =
T P
T P + FN
(6)
where TP, FP and FN represent, respectively, the
number of True-Positives (TP), False-Positives (FP)
and False-Negatives (FN).
Precision and recall are evaluated by analyzing
both the sample (at the window level, after the first
stage) and the event. On the one hand, the analysis
on the samples gives a rough idea of the capacity of
the classifier to give the correct answers. On the ot-
her hand, the analysis on the events gives an idea of
the user feeling about the usage of the application. In-
deed, in this last case a TP event is counted if at least
one positive sample (classified as fall) overlap with a
VISAPP 2018 - International Conference on Computer Vision Theory and Applications
544
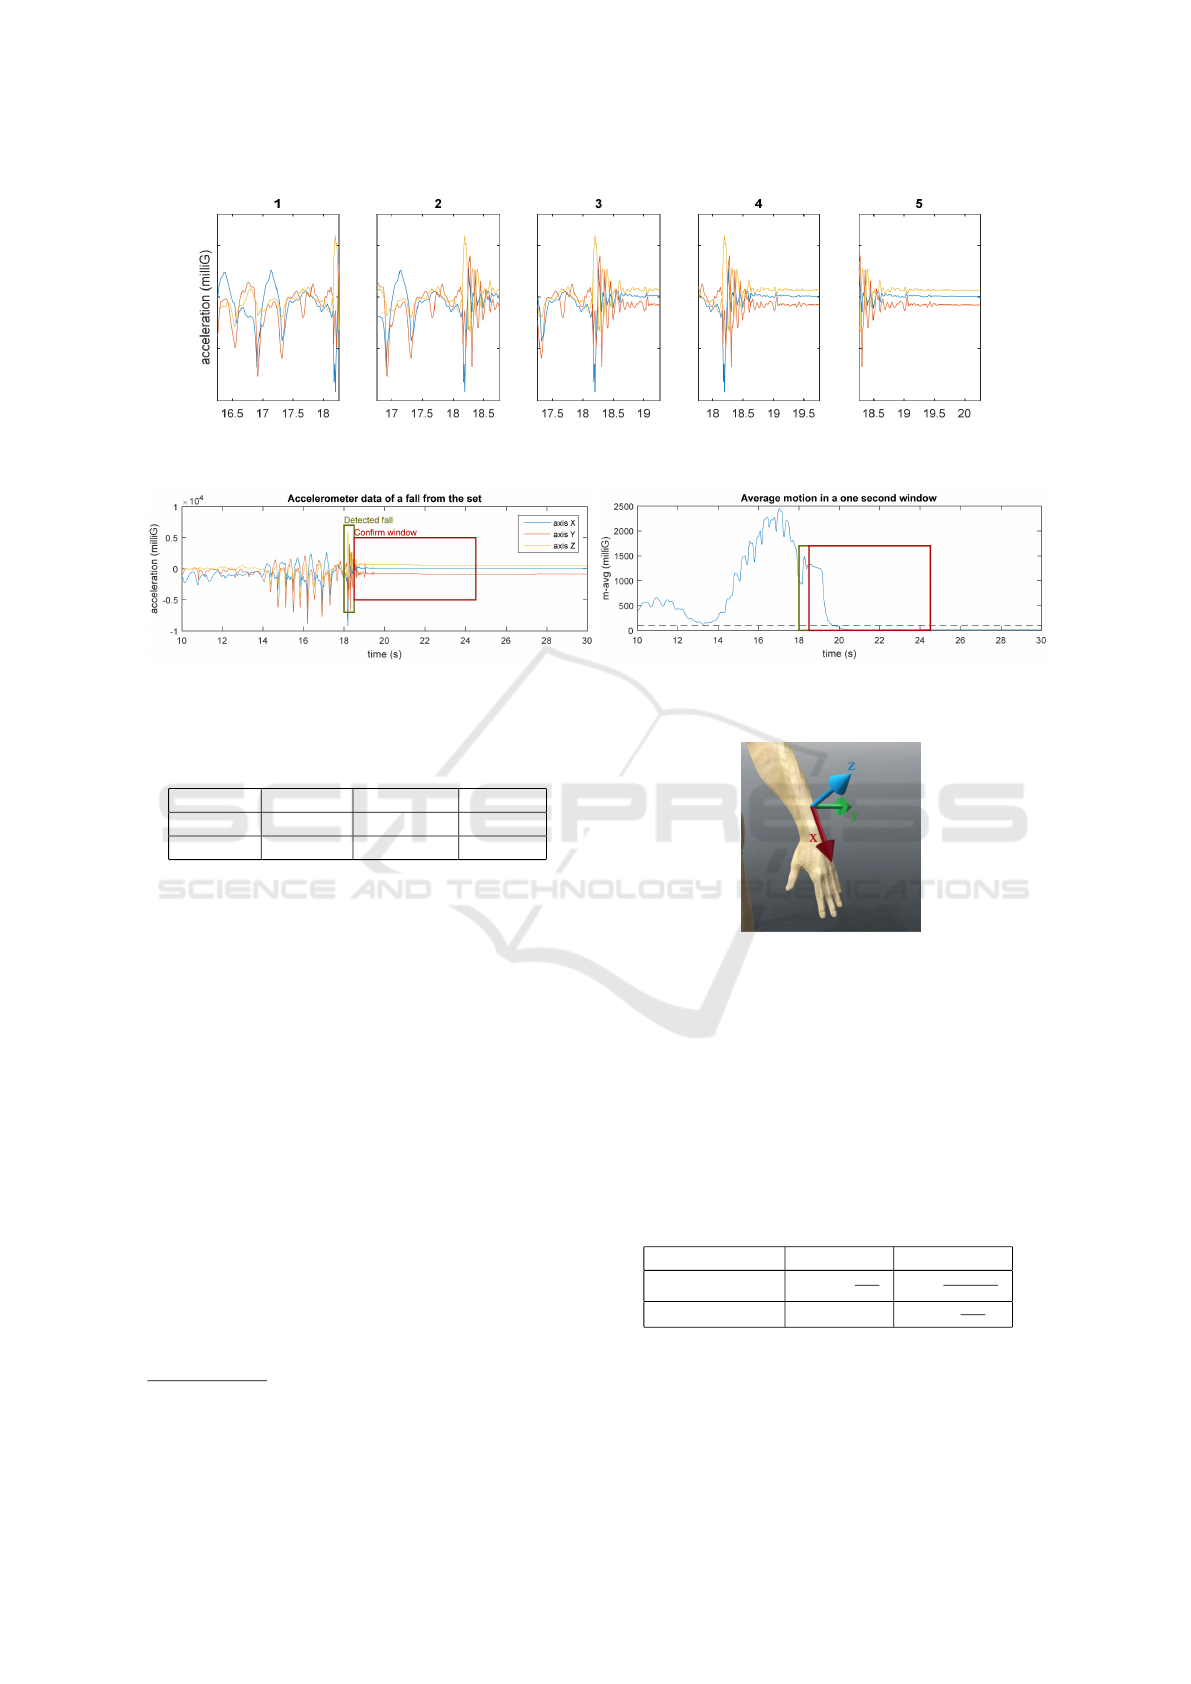
Figure 2: Example of sliding windows with 75% of overlap. Note that only in third and fourth windows the fall peak can be
seen entirely. If there was no overlap, only windows one and five would have been considered.
Figure 3: How the consciousness validator works: few seconds following the detected fall are evaluated to check that m −avg
is lower than a given threshold (the dashed line).
Table 1: MIVIA-Fall Dataset; the running times are repor-
ted in minutes, while the falls in terms of number of times.
Training Validation Testing
Running 76 mins 13 mins 13 mins
Falls - 17 21
ground truth fall. Viceversa, a FN is counted only if
there are not any positive samples associated to the
consecutive ones of a ground truth fall.
3.2 Dataset
In order to test the proposed approach, we acquired
a dataset (hereinafter MIVIA-Fall Dataset) that we
made publicly available for benchmarking purposes
1
.
The aim of our dataset is to capture real life situations.
Indeed, running data comes from real running sessi-
ons, while falls have been simulated on a soft mattress
for safety reasons. The subject runs through an aisle,
then stumbles and falls on the mattress as naturally as
possible; that means that it falls frontally putting its
hands forward. Note that we decided to capture real
life data so as to ensure that the final real prototype
performance would be similar to the one achieved by
the testing algorithm on the recorded data.
Some details of the MIVIA-Fall Dataset have been
reported in Table 1. The device, whose sensor’s featu-
1
The dataset will be made publicly available on our web-
site at the following link http://mivia.unisa.it after the publi-
cation of the paper.
Figure 4: Data axes position and orientation with respect to
the subject arm in the MIVIA-Fall Dataset.
res are reported in Table 2 (in terms of range and sen-
sitivity), has been placed on the wrist of the runner,
with the sensors mounted so as to acquire the data as
shown in Figure 4. An example of the acquired data
is plotted in Figure 5.
Table 2: MIVIA-Fall Dataset: main characteristics of the
sensing equipment. Note that the sensitivity is expressed in
LSB/unit. It means, for example, that a measure of 1G will
give a raw measure of 2048, and then the minimum change
in gravity that one will be able to appreciate will be 1/2048.
Range Sensitivity
Gyroscope ±2000
deg
secs
16.4
LSB
deg/secs
Accelerometer ±16G 2048
LSB
G
3.3 Results
The choice of the parameters to be used in our expe-
rimentation has been performed by optimizing the re-
A Wearable Embedded System for Detecting Accidents while Running
545
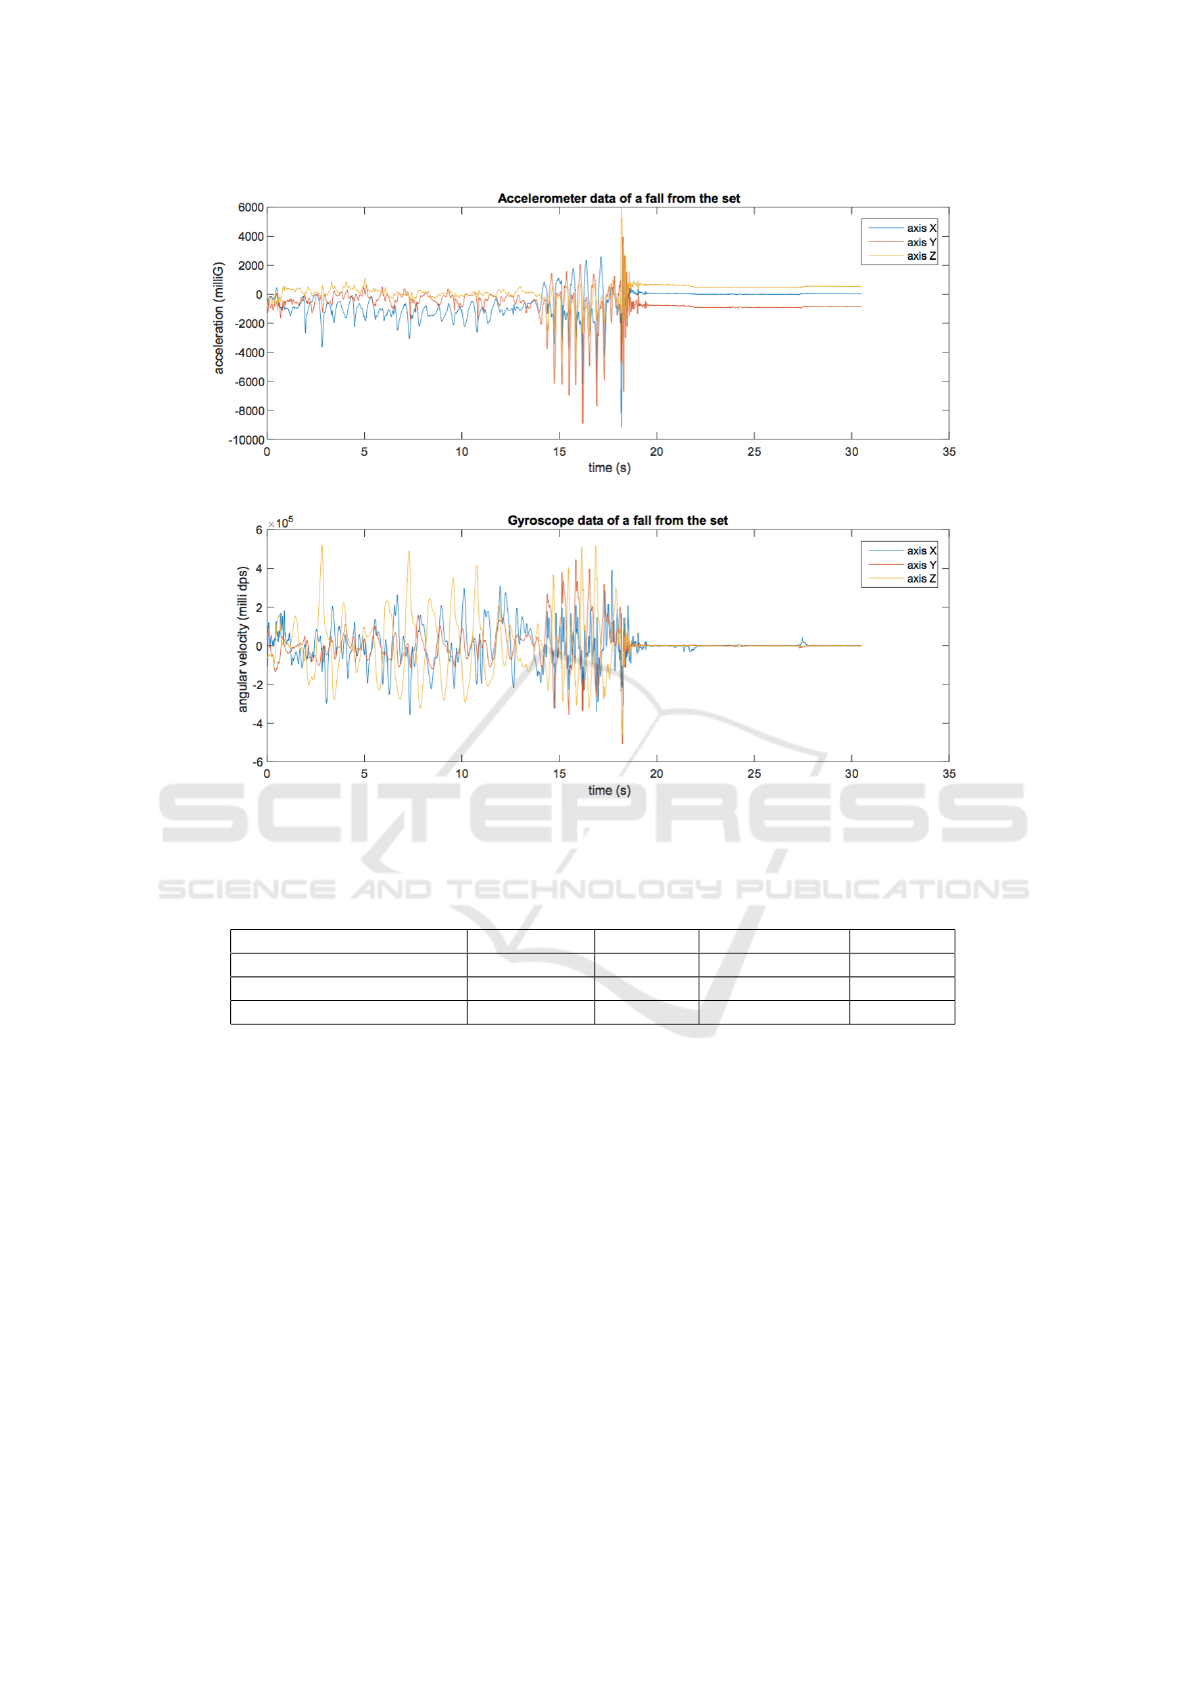
Figure 5: An example of the data in the MIVIA-Fall Dataset.
Table 3: Performance achieved on the test set. S refers to the fact that Precision and Recall are computed on the samples,
while E refers to the fact that Recall is computed on the Events. False alarm rate is computed in terms of number of false
positives (FP) for each minute.
Precision (S) Recall (S) False alarm rate Recall (E)
Fall detector 58.7% 89.8% 1.26 FP/min 100%
Interstage filter 69.3% 89.8% 0.58 FP/min 100%
Consciousness verification 100.0% 89.8% 0 FP/min 100%
sults on the validation set. The Precision-Recall curve
for the first stage is reported in Figure 6, where the
chosen operating point is reported in red. The choice
has been guided by the following two points: first, in
the particular application at hand, as mentioned in the
previous section, it is required to have an high recall,
even at the expense of precision. It depends on the
fact that the second classification stage is able to fil-
ter out some potential false alarms, but it could be not
able to recover missed event at first stage. Thus, it
becomes important at the first stage to maximize the
recall, while postponing at the successive stage the
increasing of the precision. Furthermore, we need a
point that yields an appreciable stability: points on
a vertical edge of the curve indeed may represent a
risky choice, since they may achieve rapidly descen-
ding values of precision at a fixed recall. It is worth to
remember that this is a curve estimated on the valida-
tion set and that the points could move toward worse
performance when evaluated on the test set.
The performance achieved on the test set is repor-
ted in Table 3. As we can see from the table, the in-
troduction of the interstage filter helps improving the
performance of the proposed approach, both in terms
of precision (fixed the recall to 89.8%, the precision
is improved from 58.7% to 69.3%) and of false alarm
rate (from 1.26% to 0.58%). However, the further in-
creasing is due to the introduction of the conscious-
ness verification stage. Indeed, on the test set no false
alarms have been detected at all, and the precision is
100%. The results obtained by the proposed approach
are thus very encouraging, opening to the possibility
to use such system in real environments.
VISAPP 2018 - International Conference on Computer Vision Theory and Applications
546

Figure 6: Precision-Recall curve obtained on the validation
set at the first stage and used for the operating point se-
lection. Red point identifies the selected operating point.
4 CONCLUSION
In this paper we have proposed a method for detecting
falls while sporting, with particular reference to the
running. The method is optimized so as to run di-
rectly on board of a wearable embedded device, wit-
hout any additional external server in charge of the
elaboration. The experimental results, conducted over
a dataset made publicly available for benchmarking
purposes, confirm the effectiveness of the proposed
approach, where the possibility of running on embed-
ded devices is not payed in terms of accuracy.
Although the method has been though for de-
tecting falls while running, its architecture is general
enough to also deal with other sports. In the future,
we plan to extend the proposed approach so as to deal
with other typologies of sports. Future works also in-
clude an extension of the dataset and then of the expe-
rimentation, so as to confirm the effectiveness of the
proposed approach.
ACKNOWLEDGEMENTS
This research has been partially supported by
A.I.Tech s.r.l. (www.aitech.vision).
REFERENCES
Abbate, S., Avvenuti, M., Bonatesta, F., Cola, G., Corsini,
P., and Vecchio, A. (2012). A smartphone-based fall
detection system. Pervasive and Mobile Computing,
8(6):883 – 899. Special Issue on Pervasive Healthcare.
Albert, M. V., Kording, K., Herrmann, M., and Jayaraman,
A. (2012). Fall classification by machine learning
using mobile phones. PLOS ONE, 7(5):1–6.
Bagal, F., Becker, C., Cappello, A., Chiari, L., Aminian, K.,
Hausdorff, J. M., Zijlstra, W., and Klenk, J. (2012).
Evaluation of accelerometer-based fall detection algo-
rithms on real-world falls. PLOS ONE, 7(5):1–9.
Bourke, A., van de Ven, P., Gamble, M., OConnor, R.,
Murphy, K., Bogan, E., McQuade, E., Finucane,
P., Laighin, G., and Nelson, J. (2010). Evalua-
tion of waist-mounted tri-axial accelerometer based
fall-detection algorithms during scripted and continu-
ous unscripted activities. Journal of Biomechanics,
43(15):3051 – 3057.
Bourke, A. K. and Lyons, G. M. (2008). A threshold-based
fall-detection algorithm using a bi-axial gyroscope
sensor. Medical Engineering and Physics, 30(1):84–
90.
Bourke, A. K., van de Ven, P. W. J., Chaya, A. E., OLaig-
hin, G. M., and Nelson, J. (2008). Testing of a long-
term fall detection system incorporated into a custom
vest for the elderly. In 2008 30th Annual International
Conference of the IEEE Engineering in Medicine and
Biology Society, pages 2844–2847.
Brun, L., Saggese, A., and Vento, M. (2014). Dynamic
scene understanding for behavior analysis based on
string kernels. IEEE Transactions on Circuits and Sy-
stems for Video Technology, 24(10):1669–1681.
Chen, J., Kwong, K., Chang, D., Luk, J., and Bajcsy, R.
(2005). Wearable sensors for reliable fall detection.
In 2005 IEEE Engineering in Medicine and Biology
27th Annual Conference, pages 3551–3554.
Choi, Y., Ralhan, A. S., and Ko, S. (2011). A study on ma-
chine learning algorithms for fall detection and mo-
vement classification. In 2011 International Confe-
rence on Information Science and Applications, pages
1–8.
Delahoz, Y. S. and Labrador, M. A. (2014). Survey on fall
detection and fall prevention using wearable and ex-
ternal sensors. Sensors, 14(10):19806–19842.
Fahmi, P. N. A., Viet, V., and Deok-Jai, C. (2012). Semi-
supervised fall detection algorithm using fall indica-
tors in smartphone. In Proceedings of the 6th Interna-
tional Conference on Ubiquitous Information Mana-
gement and Communication, pages 122:1–122:9.
Habib, M. A., Mohktar, M. S., Kamaruzzaman, S. B., Lim,
K. S., Pin, T. M., and Ibrahim, F. (2014). Smartphone-
based solutions for fall detection and prevention:
Challenges and open issues. Sensors, 14(4):7181–
7208.
Igual, R., Medrano, C., and Plaza, I. (2013). Challenges, is-
sues and trends in fall detection systems. BioMedical
Engineering OnLine, 12(1):1 – 24.
Jie Yin, J., Qiang Yang, Q., and Pan, J. (2008). Sensor-
Based Abnormal Human-Activity Detection. IEEE
Transactions on Knowledge and Data Engineering,
20(8):1082–1090.
Kalace, A., Fu, D., and Yoshida, S. (2008). Who global
report on falls prevention in older age. World Health
Organization Press: Ginevra, Switzerland.
Khan, S. S. and Hoey, J. (2017). Review of fall detection
techniques: A data availability perspective. Medical
Engineering and Physics, 39:12 – 22.
A Wearable Embedded System for Detecting Accidents while Running
547

Koshmak, G., Loutfi, A., and Linden, M. (2016). Challen-
ges and issues in multisensor fusion approach for fall
detection: Review paper. Journal of Sensors, 2016.
Medrano, C., Igual, R., Plaza, I., and Castro, M. (2014). De-
tecting falls as novelties in acceleration patterns acqui-
red with smartphones. PLOS ONE, 9(4):1–9.
Micucci, D., Mobilio, M., Napoletano, P., and Tisato, F.
(2017). Falls as anomalies? an experimental evalu-
ation using smartphone accelerometer data. Journal
of Ambient Intelligence and Humanized Computing,
8(1):87–99.
Sadigh, S., Reimers, A., Andersson, R., and Laflamme,
L. (2004). Falls and fall-related injuries among the
elderly: A survey of residential-care facilities in a
swedish municipality. Journal of Community Health,
29(2):129–140.
Shi, Y., Shi, Y., and Wang, X. (2012). Fall detection on mo-
bile phones using features from a five-phase model. In
2012 9th International Conference on Ubiquitous In-
telligence and Computing and 9th International Con-
ference on Autonomic and Trusted Computing, pages
951–956.
VISAPP 2018 - International Conference on Computer Vision Theory and Applications
548
