
Localization System based on Ultra Low-power Radio Landmarks
Fabian Höflinger
1
, Joan Bordoy
2
, Rui Zhang
2
, Amir Bannoura
1
, Nikolas Simon
1
, Leonhard Reindl
1
and Christian Schindelhauer
2
1
Department of Microsystems Engineering, University of Freiburg, Germany
2
Department of Computer Science, University of Freiburg, Germany
Keywords:
Indoor Localization, Ultra-wideband, On-demand, Wake-up, Low Power.
Abstract:
In this paper we present a novel indoor localization system using external reference landmarks as a guidance
system for emergency responders. The landmarks are based on low-power wake-up nodes which can be
integrated into smoke detectors. The radio wake-up technology is equipped in the system to extend the lifetime
of landmarks. While in sleep mode our landmarks have an overall power consumption of 66 µW making them
ready-to-use in case of an emergency for up to 5 years. The landmarks are small and cost-efficient and may
be integrated into the building infrastructure. The positioning is achieved by combining the radio ranging and
IMU based dead reckoning to overcome the disadvantages of both systems. The experimental results show that
the proposed system is able to outperform both standalone systems and meanwhile maintain the low power
consumption.
1 INTRODUCTION
In the recent decade, a growing demand in precise
indoor locating systems could be observed (Bordoy
et al., 2016)-(Kuhn et al., 2009) wireless so that in-
door location services, such as locating victims in
avalanches or earthquakes, injured skier on ski slope,
military personnel, fire fighters or lost children, can be
delivered. However, in contrast to this increasing de-
mand, the technology for reliable indoor navigation is
still in its infancy, since these applications need very
high accuracy requirements, low power consumption
and low complexity. Nowadays most of indoor locat-
ing technologies can be divided into acoustic, optical,
and radio frequency methods. The last type of meth-
ods can be divided into continuous wave, for example,
WLAN or RFID, and impulse signals. Unfortunately,
the above mentioned technologies either cannot fulfill
the criteria of high accuracy or low power consump-
tion required by indoor location service applications.
2 STATE-OF-THE-ART
Many non-GPS localization systems based on vari-
ous technologies have been developed (Fischer and
Gellersen, 2010). Most of them can be classified into
absolute and relative localization systems.
Absolute localization systems normally require
external references that consists of fixed landmarks
such as Wi-Fi access points (Bahl and Padmanabhan,
2000) or ultra-wide band systems (Kuhn et al., 2009)
to determine the position by measuring the Received
Signal Strength Indicator (RSSI) or the Time of Ar-
rival (ToA)/Difference of Arrival (TDoA). Due to its
high energy consumption, such systems are required
either to be connected to the power grid or frequent
battery charging/replacement. As a result, such sys-
tem are not suitable for catastrophic scenarios due to
its high installation costs and power consumption.
The most commonly used relative non-GPS in-
door localization approach is inertial measurement
units (IMU) based dead reckoning. The IMU can be
attached to the body or mount on the shoe of the res-
cue forces (Höflinger et al., 2013; Zhang et al., 2013;
Höflinger et al., 2012; Nilsson et al., 2014). In this
approach, the relative positioning is obtained in a re-
cursive manner, i.e. the direction and the distance rel-
ative to the initial state are calculated via integration
of acceleration and gyroscope data. Therefore, no
external reference or pre-installation is needed. The
system can also be powered by small size batteries.
The main drawback of such systems is that the error
will be accumulated over time due to drift of the sen-
sors. Therefore, several approaches have been devel-
oped (Zhang et al., 2011), (Fang et al., 2005), (Zhang
and Reindl, 2011) to minimize such error. Neverthe-
less, standalone IMU based localization systems are
not capable of providing sufficient accuracy for long
term measurements, especially if the nature of move-
Höflinger, F., Bordoy, J., Zhang, R., Bannoura, A., Simon, N., Reindl, L. and Schindelhauer, C.
Localization System based on Ultra Low-power Radio Landmarks.
DOI: 10.5220/0006608800510059
In Proceedings of the 7th International Conference on Sensor Networks (SENSORNETS 2018), pages 51-59
ISBN: 978-989-758-284-4
Copyright © 2018 by SCITEPRESS – Science and Technology Publications, Lda. All rights reserved
51
ments is unsteady, which is often the case during res-
cue operations.
In order to fulfill the requirements of the indoor lo-
cation application such as very high accuracy require-
ments, low power consumption and low complexity,
one should decrease the system energy consumption
especially for absolute localization systems and in-
crease the tracking accuracy of the system. By ap-
plying wake-up technology, the power consumption
can be significantly reduced. By combining both ab-
solute and relative localization systems, the tracking
accuracy can be greatly enhanced.
3 CONCEPT OVERVIEW
In this paper we present a indoor localization system
using landmarks based on low-power wake-up nodes
which can be integrated into smoke detectors. As a
central component of this system we have developed a
handheld device that serves as a master node to com-
municate with our landmarks. The handheld device
broadcasts a wake-up message and measures the Re-
ceived Signal Strength Indicator (RSSI) of each an-
swer received from all landmarks that woke up. Based
on this data the master node calculate the current po-
sition of the handheld device.
Furthermore, the handheld device is able to re-
ceive inertial sensor data of our wireless IMU which
can be integrated in shoes. The additional informa-
tion allows movement tracking between two wake-up
events to increase localization accuracy. Moreover,
due to the high short-distance accuracy of inertial data
based localization, the number of wake-up events can
be reduced and hence lifetime of the reference land-
marks is increased.
4 HARDWARE DESIGN
In the following section the main components of the
hardware are described:
4.1 Handheld Device
The developed prototype of our handheld device
consists of two parts: The credit-card sized low-
power computer BeagleBone Black with a compati-
ble touchscreen and our developed expansion circuit
board.
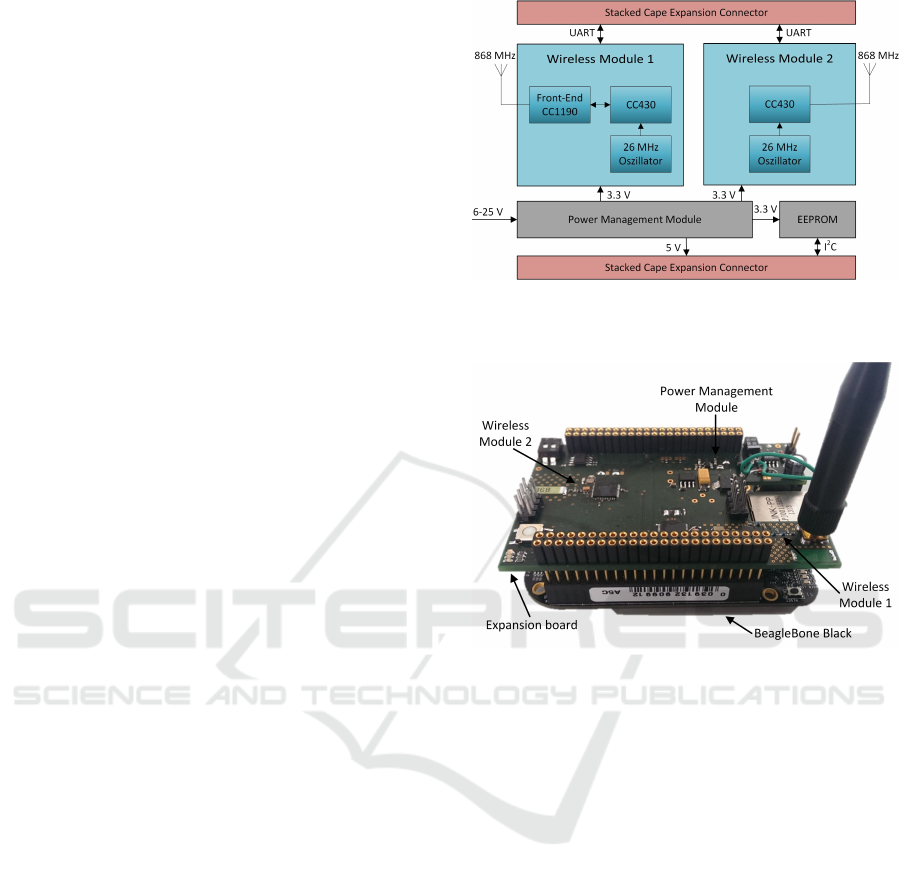
As shown in Fig. 1 our developed expansion cir-
cuit board. is made up of two wireless modules, a
power management module and an EEPROM. One of
Figure 1: Block diagram of the expansion board with its
components. The board is stacked on the BeagleBone Black
for communication and power supply (Simon et al., 2015).
Figure 2: Expansion board stacked on top of the credit-card
sized low-power computer BeagleBone Black (Simon et al.,
2015).
the wireless modules communicates with our wake-
up nodes by transmitting wake-up messages (wake-
up message details see Gamm et al. (Gamm et al.,
2012)) if requested by the computer and receiving the
answers of the landmarks. The other one receives in-
ertial sensor data from our wireless IMU. Both wire-
less modules use a CC430 low-power microcontroller
from Texas Instruments to communicate on a fre-
quency of 868 MHz with the appropriate component.
To extend the wake-up range of the system an ad-
ditional front-end amplifier CC1190 is used for the
wireless module. Furthermore, each controller uses
a separate UART connection to transfer the received
data to the BeagleBone Black computer via the cape
expansion connectors.
4.2 Low-power Wake-up Landmarks
Our developed landmarks are based on a wake-up
technology presented in Gamm et al. (Gamm et al.,
2012) which uses a 125 kHz wake-up receiver. Low
power wake-up receivers are used for keyless go entry
SENSORNETS 2018 - 7th International Conference on Sensor Networks
52
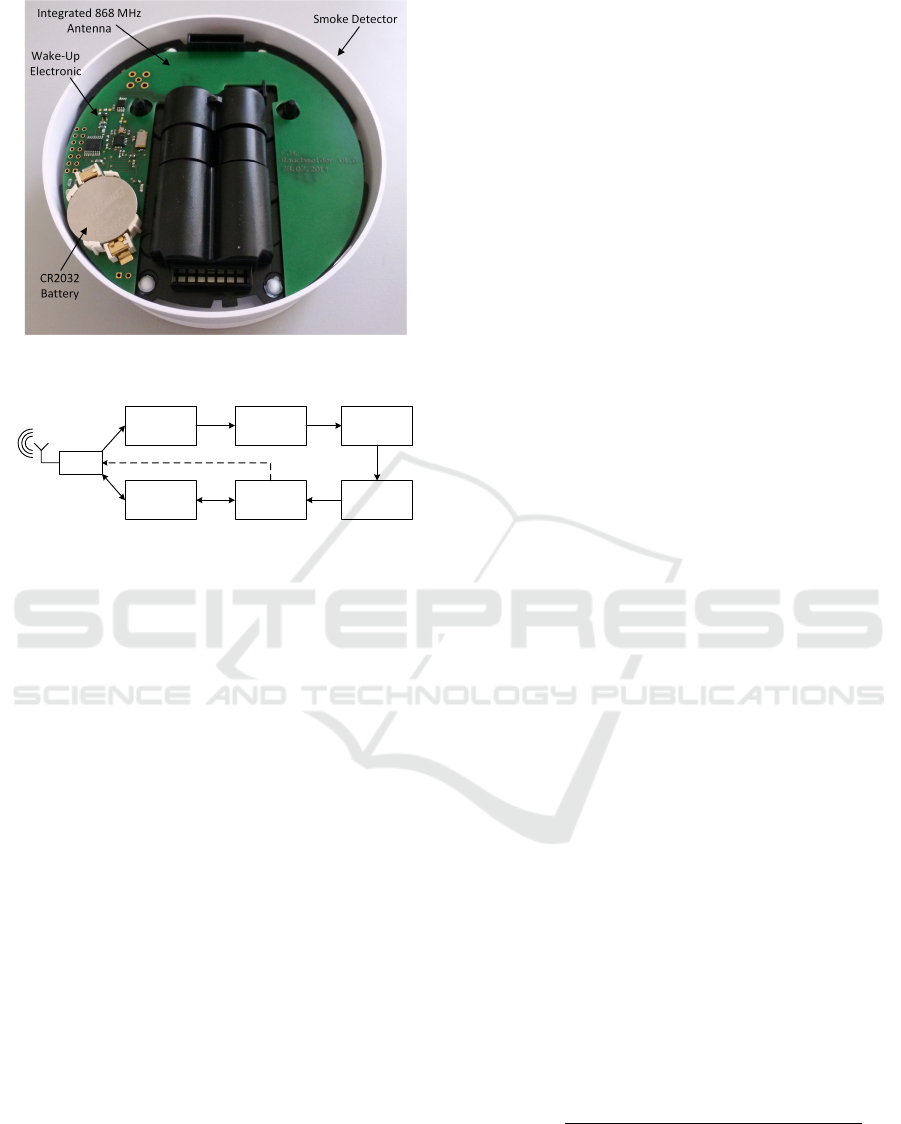
Figure 3: Topview of our developed landmark integrated
into a commercially available smoke detector.
Impedance
Matching
Rectifier Lowpass
AS3932
Wake-Up
Receiver
MSP430
Wake-Up
CC1101
868 MHz
Transceiver
Antenna
Switch
Control
Figure 4: Block diagram of the wake-up circuit in our land-
marks (Gamm et al., 2012).
systems in automotives. They are build to work a long
time without a battery change and therefore operate at
low frequencies. The short wake-up range of about 3
meters due to inductive coupling is of no limiting fac-
tor for the keyless go application.
In Fig. 4 a block diagram of the wake-up landmark
is shown. When the node is in active mode, the an-
tenna switch is configured so that all in and outgo-
ing signals pass to the main radio transceiver chip.
Before entering the sleep mode, the microcontroller
toggles the antenna switch. All incoming signals dur-
ing sleep mode are then routed to the analog circuit
consisting of impedance matching, rectifying and low
pass filtering. The incoming 868 MHz wake-up signal
is passively demodulated by a rectifier and filtered.
The passiv demodulation and the analog path is an
important factor in the performance of the wake-up
receiver since non-ideal impedance matching will re-
sult in a shorter wake-up distance. The analog path
of the presented node consists of a matching network,
two demodulation diodes and a low pass filtering cir-
cuit. The RF Schottky demodulator diodes are con-
nected as a typical voltage doubler circuit. Its pur-
pose is to rectify the modulated RF carrier signal. Be-
cause of the OOK modulation of the carrier signal
the rectifier charges a capacitor of a low pass filter
up to a certain value during the ON period of the car-
rier. When the carrier is turned OFF the capacitor is
discharged through a resistor. This way, a triangu-
lar signal is generated with a frequency of 125 kHz.
Afterwards, the signal is coupled to the wake-up re-
ceiver through a capacitor in order to remove any DC
offset. The filtered signal is then passed to the input
of the wake-up receiver IC. In our node we used the
AS3932 wake-up receiver from Austriamicrosystems.
It consumes in one channel listening mode 2.7 µA cur-
rent and has a wake-up sensitivity of 100 µVRMS as
well as a high input impedance of 2 MΩ. One of the
main reasons for choosing the AS3932 is that it has
an integrated correlator which compares the received
signal to a byte pattern saved in a configuration reg-
ister. In case of a positive correlation of the incom-
ing signal with an internal saved 16-Bit sequence the
wake-up receiver changes the state of one of its output
pins. This signal change is fed to an interrupt capable
input port of the microcontroller. The generated in-
terrupt triggers the controller from its sleep to active
mode. When entering the active mode, the controller
again toggles the antenna switch so that the main ra-
dio transceiver is connected to the antenna. The node
can then establish a normal communication link, e.g.
send an acknowledge or send a message for the RSSI-
Measurement between landmark and the handheld de-
vice.
While listening for a wake-up packet the standby
current of the node is about 2.78 µA which results
in a standby power consumption of 5.6 µW. Using
a CR2032 coin cell battery with a capacity Q
Bat
of
230 mAh as power supply we have to take an addi-
tional self-discharge current of about 263 nA into ac-
count. Therefore, the overall current consumption of
the node in sleep mode sums up to 3.044 µA. After
the node has been in this mode for t
sleep
the remain-
ing charge of the battery Q
Le ft
can be calculated with
the following equation 1. Therefore, the theoretical
maximum lifetime of the node without any wake-up
is 8.62 years.
Q
Le ft
= Q
Bat
−t
sleep
· I
sleep
(1)
Assuming a maximum current consumption of
15 mA during a sending process which takes about
13 ms the theoretical maximum operating time of our
landmarks after t
sleep
can be calculated using equation
2.
T
maxOp
=
Q
Le ft
· T
Wakeup
T
Send
· I
Send
+ (T
Wakeup
− T
Send
) · I
Sleep
(2)
Once the system is in operation the wake-up pe-
riod T
Wakeup
dominates the power consumption and
thus the maximum life time of our nodes (Gamm
et al., 2012). Figure 5 shows the negative linear be-
Localization System based on Ultra Low-power Radio Landmarks
53

Low-power sleeping time T
sleep
(years)
0 1 2 3 4 5 6 7 8 9
Maximum operating time T
op
(days)
0
20
40
60
80
100
0.5 Hz Wake-up
1 Hz Wake-up
2 Hz Wake-up
Figure 5: This figure shows the maximum theoretical oper-
ating time of a landmark for different wake-up frequencies
after it has been in its ultra-low power state for T
sleep
.
Table 1: Temperature range of critical components.
Operating temperature
Component Min. (
◦
C) Max. (
◦
C)
MSP430F2350 -40 85
CC1101 -40 85
ADG918 -40 85
AS3932 -40 85
HSMS285C -65 150
Balun 868 -40 125
Crystal -10 70
haviour of the remaining operating time for three dif-
ferent wake-up periods after the node has been sleep-
ing for t
sleep
.
As a guidance system for emergency responders
the operating temperature range is an important crite-
ria. Table 1 shows that our crystal is the most critical
component which limits operation theoretically to a
temperature range of −10
◦
C to 70
◦
C. However, our
practical tests have shown that a successful communi-
cation with our nodes is possible within a temperature
range of −20
◦
C to 115
◦
C as shown in figure 6. No-
tice that the radio frequency from the quartz oscillator
changes when the temperature varies. Beyond 100
◦
C
the reception bandwidth of receiver can not detect the
transmitted radio frequency any more.
With this technology we build a real-time capa-
ble low-power landmark with a theoretical maximum
standby time which is comparable with the one of
commercially available smoke detectors. Therefore,
we adapted our circuit board design to be able to in-
tegrate the nodes in this extisting infrastructure and
hence ease the hardware setup to have a system which
is ready-to-use in case of a catastrophic scenario (fig-
ure 3).
The sensitivity has been measured in by using a
signal generator. A successful wake-up was observed
up to an attenuation of -52 dBm (Gamm et al., 2012).
Through improved impedance matching a wake-up
Temperature (°C)
-20 0 20 40 60 80 100 120
Successful communication (%)
20
40
60
80
100
Figure 6: Our measurements show a successful communi-
cation within a temperature range of −20
◦
C to 115
◦
C.
distance of up to 80 meters is possible at 20 dBm
power output (Gamm et al., 2013).
4.3 Micro-inertial Measurement Unit
(IMU)
Our wireless micro-IMU V3 (Fehrenbach, 2014) used
in this application, has already been successfully used
for short-distance indoor motion tracking of pedestri-
ans when mounted on a shoe (Höflinger et al., 2012).
With its small size of 22 mm×14 mm× 4 mm the mi-
cro IMU is in this application mounted on a shoe
and transmits its sampled sensor data wirelessly to
our receiver, the handheld device. Concerning this,
a CC430 microcontroller from Texas Instruments is
used to transmit the data at 868 MHz. Besides the
controller the micro IMU consists of a three-axis ac-
celerometer, a three-axis gyroscope and a three-axis
magnetometer as well as a voltage regulator (see Fig.
7). The raw data of the sensors can be sent with a
maximum rate of 640 samples per second. Thereby,
data post processing is done by the receiver to in-
crease the performance of the IMU. More details
about metrological characteristics can be found in
Höflinger et al. (Höflinger et al., 2012).
5 LOCALIZATION
5.1 Problem Setting
The low power wake-up nodes are placed randomly
at unknown stationary positions S
j
(1 ≤ j ≤ B). For
simplicity, we assume they are located in a two-
dimensional Euclidean space. The handheld device H
moves in the two-dimensional Euclidean space, wak-
ing up the nodes and measuring the signal strength
(RSSI).
SENSORNETS 2018 - 7th International Conference on Sensor Networks
54

Antenna
868MHz
CC430
Microcontroller
RF- transceiver
Accelerometer
MMA8451Q
Gyroscope
ITG3200
Magnetometer
HMC6343
Voltage
Regulator
I²C
4- 6.5 V
Figure 7: Block diagram of the Micro-IMU V3 (Fehren-
bach, 2014). The IMU is capable of transmitting acceler-
ation, magnetic field and angle velocity sensor data via its
868 MHz radio module.
Figure 8: Topview of the micro-IMU V3 which is mounted
on a shoe.
5.2 Range Estimation
The handheld device is located at a distance d from
the node j:
d = kH − S
j
k (3)
where k · k denotes the Euclidean norm.
The relation between d and the RSSI measure-
ments can be modelled as follows (Qi, 2003):
P
R
=
G
t
G
r
4π
P
T
g
2
γ
d
n
(4)
where P
T
is the transmitted power, G
t
and G
r
are the
transmitter and the receiver gains, respectively, n is
the path loss exponent, and g and γ are the parame-
ters that conform the Rayleigh/Rician and lognormal
distributions, respectively.
Assuming the received signals are averaged over
a certain time interval, the fast fading term can be
eliminated. Thus, the logarithmic equation which re-
lates the received signal strength and the distance can
be formulated as follows (Qi, 2003) (Mazuelas et al.,
2009):
P
R
(dBm) = α − 10nlog
10
(d) + χ (5)
S
1
S
2
S
3
Figure 9: Schematic of the under-determined equation sys-
tem. If the firefighter moves continuously, for every new
measurement there are two new variables to estimate only
for its position. On the other hand, if he stops, his device
receives one signal from every node (S
1
,S
2
and S
3
), leading
to three constrains for every two position variables (Simon
et al., 2015).
where χ denotes a Gaussian random variable with
zero mean caused by shadowing. The term α is a
constant which depends on the averaged slow and fast
fading, the transmitted power and the gains of the an-
tennas.
5.3 Node and Standing Positions
Localization
The continuous movement of the master device re-
sults in a system of equations which cannot be
solved in closed form, as for every received measure-
ment there are two new variables of position to es-
timate. Consequently, the equation system is under-
determined and cannot be solved in closed form with-
out further information or assumptions on the sce-
nario. Therefore, we assume the master node stops
in q different positions H
i
, then we have time to re-
ceive at least one signal from every node (stop-and-
go motion). Doing this, it is only required to estimate
one handheld device position (2 variables) for every
B received signals, which makes possible an uniquely
determined system of equations (cf. Fig. 9).
Then, we obtain a system of hyperbolic equations
of the form:
f
p, j
= kH
p
− S
j
k − z
p, j
(6)
where 1 ≤ j ≤ B and 1 ≤ p ≤ q. The term z
p, j
is
the measured distance between the sender j and the
standing position p using a RSSI measurement and
Equation (5).
The system of equations has now qB independent
equations, which has to be higher than the number of
Localization System based on Ultra Low-power Radio Landmarks
55

1 2 3 4 5 6 7 8 9
20
30
40
50
60
70
80
90
Distance (m)
Signal Strength (dBm)
Node 1
Node 2
Node 3
Node 4
Node 5
Logarithmic Equation
Figure 10: Real and modeled relation between the received
signal strength and the distance between the node and the
hand-held device. The uncertainty bars show the standard
deviation of the signal strength after the 5% highest and
the 5% lowest RSSI signals for each distance have been re-
jected.
variables:
qB ≥ 2q
|{z}
Handheld device
+ 2B
|{z}
Nodes
(7)
Which means the system of equations can be solved in
a closed form if the number of standing still positions
q is higher than:
q ≥
2B
B − 2
(8)
Assuming the stop-and-go motion and having a
number of standing positions and nodes fulfilling
Equation (8) the system of hyperbolic equations can
be solved with local optimization algorithms. We
use both the gradient descent and the Gauss-Newton
method, the two are first-order methods that use the
derivative of the system of hyperbolic error equa-
tions. The Equation (6) results in a quadratic objective
which can be formulated as follows:
q
∑
p=1
B
∑
j=1
arg min
H
p
,S
j
( f
p, j
)
2
. (9)
Which in vector notation is proportional to w =
1
2
b
T
b
with b = ( f
1,1
, ..., f
q,B
)
T
. The operator (·)
T
denotes
the transposition.
We calculate the direction of the steepest ascent:
Ow = O
1
2
b
T
b
= Q
T
b (10)
where Q is the Jacobian matrix:
Q =
∂ f
1,1
∂S
1
. . .
∂ f
q,B
∂S
1
.
.
.
.
.
.
.
.
.
∂ f
1,1
∂S
B
. . .
∂ f
q,B
∂S
B
∂ f
1,1
∂H
1
. . .
∂ f
q,B
∂H
1
.
.
.
.
.
.
.
.
.
∂ f
1,1
∂H
q
. . .
∂ f
q,B
∂H
q
T
(11)
The partial derivative with respect to a vector is
defined as the derivative with respect to each of its
components:
∂ f
p, j
∂H
i
=
∂ f
p, j
∂H
p,x
,
∂ f
p, j
∂H
p,y
T
(12)
In our case the partial derivative with respect to
the node position S
j
is:
∂ f
p, j
∂S
j
= −
H
p
− S
j
kH
p
− S
j
k
(13)
The partial derivative with respect to the handheld po-
sition is:
∂ f
p, j
∂H
p
=
H
p
− S
j
kH
p
− S
j
k
(14)
All the variables which need to be estimated are
components of the state vector u:
u = (S
T
1
, ..., S
T
B
, H
T
1
, ..., H
T
q
)
T
(15)
Every iteration the state vector is updated using Q
and b. The methods used are:
5.3.1 The Gradient Descent Method
In every iteration step l the Gradient Descent method
updates the state vector in direction of the steepest
descent. The adaptive factor λ sets the step width.
ˆ
u = λOw = λQ
T
b
u
l+1
= u
l
−
ˆ
u
(16)
5.3.2 The Gauss-Newton Algorithm
Instead of relying on an adaptive factor γ it calculates
the step size using the inverse (Q
T
Q)
−1
for every it-
eration:
u = (Q
T
Q)
−1
(Q
T
b) (17)
We calculate for higher numerical stability the
pseudo-inverse with singular value decomposition in-
stead of calculating the inverse.
This algorithm is faster, nevertheless it is very
prone to divergence when applied to random initial
positions. However, it can be used when the Gradient
Descent error function has become steady to reduce
notably the number of iterations (Wendeberg et al.,
2013).
5.4 Handheld Device Localization. Data
Fusion
The IMU has been proved to be capable of tracking
pedestrians in indoor areas showing a maximum de-
viation of 1 m after a walk of 30 m (Höflinger et al.,
SENSORNETS 2018 - 7th International Conference on Sensor Networks
56

2012). However, it cannot be used as the only source
of information due to its accumulative error. In or-
der to solve this, we combine the measurements of
the IMU and the anchor nodes using an unscented
Kalman filter (UKF). The UKF is a recursive state es-
timator which fulfils the bayesian filtering model and
uses a set of sample points (sigma points) to linearise
non-linear functions. Therefore, it is cheaper in com-
putation than other similar algorithms like the parti-
cle filter, which requires evaluation of a large number
of particles, or the extended Kalman filter, which re-
quires calculation of the Jacobian matrix. More de-
tailed information about it and its implementation can
be found in (Thrun et al., 2005). In our case, the state
vector x
t
which contains the variables to estimate has
the following components:
x
t
=
M
T
t
, V
T
t
, A
T
t
T
(18)
where M
t
is the position of the target, V
t
his veloc-
ity and A
t
the acceleration. All of them in a two-
dimensional euclidian space.
We use the the Weiner process acceleration model
(Bar-Shalom et al., 2001) in two dimensions.
M
t
V
t
A
t
= Θ
t−1
M
t−1
V
t−1
A
t−1
+Φ
t−1
Φ
t−1
∼ N (0, R
m
)
(19)
where
Θ
t
=
1 ∆t ∆t
2
0 1 ∆t
0 0 1
R
m
= τ
∆t
5
20
∆t
4
8
∆t
3
6
∆t
4
8
∆t
3
3
∆t
2
2
∆t
3
6
∆t
2
2
∆t
(20)
where τ is a parameter that depends on the expected
movement of the target.
In this case we assume each time the nodes are
woken up the RSSI measurements are received at the
same position. Then, having RSSI measurements of
N different nodes at time t, the first N components
of the predicted measurement vector z
t,1:N
fulfil the
following sensor model:
z
t,i
= α−10nlog
10
(kM
t
−S
i
k)+ρ
t
ρ
t
∼ N (0, σ
r
)
(21)
where σ
r
is the expected standard deviation of the
RSSI measurement noise. We combine these mea-
surements with the foot-mounted IMU measure-
ments. The sensors that we use are the accelerometer
and the gyroscope.
We remove the effect of the gravity and extract
the x and y components of the acceleration by com-
bining the acceleration and the angular rate. More
H7H6H5H4H3H2H1
S1
S5
S2
S3
S4
S3
S2
S1
S5
Start
End
Correct landmark position
Estimated landmark position
Standing position
Figure 11: Node localization. The master node stands still
in 7 positions H
1
,...,H
7
measuring the signal strength of the
nodes S
1
,...,S
5
. These measurements are used as an input of
local optimization algorithms (Simon et al., 2015).
information about this transformation can be found in
(Kuipers, 2002). Then, the components N + 1 and
N + 2 of the measurement vector are predicted as fol-
lows:
z
t,N+1:N+2
= A
t
+ ν
t
ν
t
∼ N (0, σ
q
) (22)
where σ
q
is the expected noise of the acceleration
measurement.
To reduce the drift of the IMU sensors, we detect
when the human being is not moving and we set the
velocity and the acceleration to zero, as it is done in
(Woodman and Harle, 2008). As the IMU has a much
higher sampling rate than the nodes, the sensor data
fusion is only done when the velocity and acceleration
are not set to zero and there is a RSSI measurement
available. In the other cases, the UKF estimates the
values using only the IMU measurements.
6 EXPERIMENTAL RESULTS
6.1 Relation between Signal Strength
and Distance
The parameters of the theoretical model which re-
lates the received signal strength and the distance (see
Equation (5)) are estimated by collecting measure-
ments from 5 nodes in 7 different positions in a corri-
dor. The best fit to the real measurements are a path
loss exponent of 7.1 and a constant α equal to 89.7
(see Fig. 10).
6.2 Node and Standing Positions
Localization
In order to test the node localization, we stop in 7 po-
sitions H
1
, ..., H
7
, as shown in Fig. 11. Such positions
are assumed to be known, as they can be estimated by
Localization System based on Ultra Low-power Radio Landmarks
57
-
c
_/
m
_/
l
.
)
\
1
LJ
Node 1
Node 2
Node 3
Node 4
Node 5
1 m
Start/End
Data fusion
IMU
Real trajectory
Figure 12: Master node localization. A person moves con-
tinuously with the IMU attached to his shoe. Sensor data
fusion is performed to combine the RSSI and the IMU data.
the inertial measurement unit, when the accumulative
error is still negligible. As the standing positions are
symmetrical to the node positions, the local optimiza-
tion algorithms are initialized on the side of their true
value. The resulting median error is 78 cm.
The same data is used to test the hand-held device
localization without IMU. The node positions are as-
sumed to be known and the target is located with a
median error of 99 cm.
6.3 Continuous Movement Tracking
In order to test the performance of the sensor data fu-
sion we perform an experiment in a different building
of the faculty, using the same path loss exponent and
α mentioned above. The device was attached to the
foot of a person. The sampling rate of the IMU is
50 Hz and data from the wake-up nodes is received
every 3 seconds. As having only one RSSI measure-
ment can lead to high errors, the measurement noise
of the RSSI measurements is increased in this case in
order to reflect this uncertainty. In Fig. 12 we can
see both the result of using only the IMU and sensor
data fusion. The median error using only the IMU
is 0.470 m with a standard deviation of 0.332 m while
the median error using also the RSSI measurements is
0.276 m with a standard deviation of 0.229 m. There-
fore, the error is notably reduced.
7 CONCLUSION AND FUTURE
WORK
In this paper, we have presented a novel self-
calibrating indoor localization system for emergency
responders using 868 MHz radio landmarks and iner-
tial sensor data. For this system we have developed
new wireless landmarks using ultra low-power wake-
up technology, which makes them ready-to-use for up
to 8 years if powered by a coin cell. The nodes are
integrable into building infrastructures like smoke de-
tectors. Moreover, a handheld device has been devel-
oped to send initial wake-up calls to the landmarks,
measure the RSSI of the response, and use this data to
estimate and display the current position of the fire-
fighter. Additionally, our handheld device is able to
receive inertial sensor data by a body-mounted micro-
intertial measurement unit (IMU) to increase localiza-
tion accuracy. The data is fused with an Unscented
Kalman filter.
The experimental results demonstrate that using
the obtained relation of signal strength and distance
the system is able to locate our landmarks with a me-
dian error of 78 cm in an indoor environment. More-
over, fusing the RSSI and IMU data, the continous
trajectory of the firefighter is tracked with a median
error of 27.6 cm.
Due to the fact that the RSSI approach is highly
sensitive to the environments, long-term high accu-
racy tracking can not be ensured. In the future,
we plan to equip our landmark device with Ultra-
Wide-Band (UWB) technology. Instead of measur-
ing the RSS, signal time of arrival will be used as
the measurement for improving the localization accu-
racy. Meanwhile, more reliable estimators that explic-
itly consider outlier error mitigation, e.g. RANSAC
(Bordoy et al., 2016), or robust regression (Bordoy
et al., 2017) will be investigated and adapted for the
proposed system so that system robustness can be en-
hanced.
ACKNOWLEDGEMENTS
This work has partly been supported by the German
Federal State Postgraduate Scholarships Act (Landes-
graduiertenförderungsgesetz - LGFG) within the co-
operative graduate school “Decentralized sustainable
energy systems".
SENSORNETS 2018 - 7th International Conference on Sensor Networks
58

REFERENCES
Bahl, P. and Padmanabhan, V. N. (2000). Radar: An in-
building rf-based user location and tracking system.
In INFOCOM 2000. Nineteenth Annual Joint Confer-
ence of the IEEE Computer and Communications So-
cieties. Proceedings. IEEE, volume 2, pages 775–784.
Ieee.
Bar-Shalom, Y., Li, X. R., and Kirubarajan, T. (2001). Es-
timation with applications to tracking and navigation.
Wiley-Interscience.
Bordoy, J., Schindelhauer, C., Zhang, R., Höflinger, F., and
Reindl, L. M. (2017). Robust extended kalman filter
for nlos mitigation and sensor data fusion. In Inertial
Sensors and Systems (INERTIAL), 2017 IEEE Inter-
national Symposium on, pages 117–120. IEEE.
Bordoy, J., Wendeberg, J., Schindelhauer, C., Höfflinger,
F., and Reindl, L. M. (2016). Exploiting ground re-
flection for robust 3d smartphone localization. In In-
door Positioning and Indoor Navigation (IPIN), 2016
International Conference on, pages 1–6. IEEE.
Fang, L., Antsaklis, P. J., Montestruque, L., McMickell,
M. B., Lemmon, M., Sun, Y., Fang, H., Koutroulis,
I., Haenggi, M., Xie, M., et al. (2005). Design of a
wireless assisted pedestrian dead reckoning system-
the navmote experience. Instrumentation and Mea-
surement, IEEE Transactions on, 54(6):2342–2358.
Fehrenbach, P. (2014). Entwicklung einer inertialsensorik
zur analyse von schwimmbewegungen.
Fischer, C. and Gellersen, H. (2010). Location and navi-
gation support for emergency responders: A survey.
IEEE Pervasive Computing, 9(1):38–47.
Gamm, G., Kostic, M., Sippel, M., and Reindl, L. M.
(2012). Low power sensor node with addressable
wake-up on demand capability. Int. J. Sensor Net-
works, 11(1):48–56.
Gamm, G., Sester, S., Sippel, M., and Reindl, L. M. (2013).
Smartgate - connecting wireless sensor nodes to the
internet. Journal of Sensors and Sensor Systems,
pages 45–50.
Höflinger, F., Müller, J., Zhang, R., Reindl, L. M., and Bur-
gard, W. (2013). A wireless micro inertial measure-
ment unit (imu). Instrumentation and Measurement,
IEEE Transactions on, 62(9):2583–2595.
Höflinger, F., Zhang, R., and Reindl, L. M. (2012). Indoor-
localization system using a micro-inertial measure-
ment unit (imu). In European Frequency and Time
Forum (EFTF), 2012, pages 443–447. IEEE.
Kuhn, M., Zhang, C., Lin, S., Mahfouz, M., and Fathy, A. E.
(2009). A system level design approach to uwb lo-
calization. In Microwave Symposium Digest, 2009.
MTT’09. IEEE MTT-S International, pages 1409–
1412. IEEE.
Kuipers, J. (2002). Quaternions and Rotation Sequences .
Princeton Paperbacks.
Mazuelas, S., Bahillo, A., Lorenzo, R. M., Fernandez, P.,
Lago, F. A., Garcia, E., Blas, J., and Abril, E. J.
(2009). Robust indoor positioning provided by real-
time RSSI values in unmodified wlan networks. Se-
lected Topics in Signal Processing, IEEE Journal of,
3(5):821–831.
Nilsson, J.-O., Rantakokko, J., Händel, P., Skog, I., Ohls-
son, M., and Hari, K. (2014). Accurate indoor po-
sitioning of firefighters using dual foot-mounted iner-
tial sensors and inter-agent ranging. In Proceedings
of the Position, Location and Navigation Symposium
(PLANS), 2014 IEEE/ION.
Qi, Y. (2003). Wireless geolocation in a non-line-of-sight
environment. PhD thesis, Princeton University.
Simon, N., Bordoy, J., Höflinger, F., Wendeberg, J., Schink,
M., Tannhäuser, R., Reindl, L. M., and Schindel-
hauer, C. (2015). Indoor localization system for emer-
gency responders with ultra low-power radio land-
marks. In International Instrumentation and Measure-
ment Technology Conference (I2MTC).
Thrun, S., Burgard, W., and Fox, D. (2005). Probabilistic
Robotics. mitpress.
Wendeberg, J., Höflinger, F., Schindelhauer, C., and Reindl,
L. (2013). Calibration-free TDOA self-localization.
Journal of Location Based Services.
Woodman, O. and Harle, R. (2008). Pedestrian localisa-
tion for indoor environments. In Proceedings of the
10th international conference on Ubiquitous comput-
ing, pages 114–123. ACM.
Zhang, R., Höflinger, F., Gorgis, O., and Reindl, L. (2011).
Indoor localization using inertial sensors and ultra-
sonic rangefinder. In Wireless Communications and
Signal Processing (WCSP), 2011 International Con-
ference on, pages 1–5. IEEE.
Zhang, R., Höflinger, F., and Reindl, L. (2013). Inertial sen-
sor based indoor localization and monitoring system
for emergency responders. Sensors Journal, IEEE,
13(2):838–848.
Zhang, R. and Reindl, L. (2011). Pedestrian motion based
inertial sensor fusion by a modified complementary
separate-bias Kalman filter. In Sensors Applications
Symposium (SAS), 2011 IEEE, pages 209–213. IEEE.
Localization System based on Ultra Low-power Radio Landmarks
59
