
Scalable and Easy-to-use System Architecture for Electronic Noses
Ana P
´
adua
1,
*
, Daniel Os
´
orio
2,∗
, Jo
˜
ao Rodrigues
2,∗
, Gonc¸alo Santos
1
, Ana Porteira
1
, Susana Palma
1
,
Ana Cec
´
ılia Roque
1
and Hugo Gamboa
2
1
UCIBIO, REQUIMTE, Departamento de Qu
´
ımica, Faculdade de Ci
ˆ
encias e Tecnologia da Universidade NOVA de Lisboa,
2829-516 Caparica, Portugal
2
Laborat
´
orio de Instrumentac¸
˜
ao Engenharia Biom
´
edica e F
´
ısica da Radiac¸
˜
ao (LIBPhys-UNL), Departamento de F
´
ısica,
Faculdade de Ci
ˆ
encias e Tecnologia da Universidade NOVA de Lisboa, Portugal
Keywords:
E-nose, System Integration, Scalability, VOCs.
Abstract:
The purpose of this work was the development of a scalable and easy-to-use electronic noses (E-noses) system
architecture for volatile organic compounds sensing, towards the final goal of using several E-noses acquiring
large datasets at the same time. In order to accomplish this, each E-nose system is comprised by a delivery
system, a detection system and a data acquisition and control system. In order to increase the scalability, the
data is stored in a database common to all E-noses. Furthermore, the system was designed so it would only
require five simple steps to setup a new E-nose if needed, since the only parameter that needs to be changed
is the ID of the new E-nose. The user interacts with a node using an interface, allowing for the control and
visualization of the experiment. At this stage, there are three different E-nose prototypes working with this
architecture in a laboratory environment.
1 INTRODUCTION
Electronic noses (E-noses) are devices that detect and
discriminate different odors. An E-nose is generally
defined as an instrument which comprises an array
of electrochemical sensors with partial specificity and
an appropriate pattern recognition system, capable of
recognizing individual components or mixtures of va-
pors (Gardner and Bartlett, 1994).
E-noses architecture’s includes four elements: (i)
a sample delivery system, that switches the tested air
with the reference air; (ii) a detection chamber, where
the odors originate electrical signals; (iii) a data ac-
quisition and control system, that acquire and send
the signals generated in the detection chamber to a
computer; and (iv) software for feature extraction and
pattern recognition algorithms (Gutirrez and Horrillo,
2014). The way E-noses sense odorant molecules re-
sembles the human olfactory system. The analyte in-
teracts with the sensor array, that consists in a set
of broadly-tuned responsive materials. Once stim-
ulated, the sensors give characteristic signature re-
sponses to the odors detected. Subsequently, the soft-
ware processes the raw signals, extracts and selects
useful information and performs pattern recognition
*
Authors divided the work equally
(Yan et al., 2015). Therefore, a database can be cre-
ated from the patterns of known odors, and used to
train a pattern recognition system so that new odors
detected can be then classified and identified.
The most commonly used sensing materials are:
metal oxides, conducting polymers and composites.
Moreover, surface acoustic wave sensors, gas sensi-
tive field effect transistors, quartz micro-balance sen-
sors, and micro-electro-mechanical systems associ-
ated with nanomaterials can also be used for gas sens-
ing (Loutfi et al., 2015). Recently, the term E-nose has
been used by some companies referring to systems
based on ultra-fast gas chromatography (e.g. zNose
from Electronic Sensor Technology), or ion mobility
spectrometry (e.g. Lonestar gas sensor from Owl-
stone), as well.
E-noses can be optimized by reducing the de-
vices’ price, minimizing the number of sensors re-
quired for discrimination, becoming more portable
through miniaturization, and using user-friendly and
faster signal processing tools.
The expression ’scale-up of an E-nose’ refers to
the process of producing the devices at higher num-
ber. In particular, a scalable acquisition and control
system is an important achievement to acquire and vi-
sualize more data in less time. It is useful for research
Pádua, A., Osório, D., Rodrigues, J., Santos, G., Porteira, A., Palma, S., Roque, A. and Gamboa, H.
Scalable and Easy-to-use System Architecture for Electronic Noses.
DOI: 10.5220/0006597101790186
In Proceedings of the 11th International Joint Conference on Biomedical Engineering Systems and Technologies (BIOSTEC 2018) - Volume 1: BIODEVICES, pages 179-186
ISBN: 978-989-758-277-6
Copyright © 2018 by SCITEPRESS – Science and Technology Publications, Lda. All rights reserved
179

purposes, allowing the production of large amounts
of data, that can be then analysed and processed. One
of the most important issues is to replicate the sen-
sor array production uniformly at large scale. For
example, for graphene-based chemical sensors, dif-
ferences in carbon nanotubes (CNTs) structure and
chirality causes variability in the response of differ-
ent devices, which may compromise the reliability of
the results. Another challenge is to grow graphene
at large scale with uniform thickness (Zhang et al.,
2009). On the contrary, MOS sensors are manufac-
tured applying easily controllable processes, therefore
can be produced quickly on a large scale with guaran-
tee of sensor uniformity (Fine et al., 2010).
The delivery system and the data acquisition and
control system can also be adapted for acquiring
larger datasets. This article describes the scale-up
process of a data acquisition and control system cre-
ated for research purposes in laboratorial environ-
ment. A database was created to organize large
datasets acquired from three in-house assembled E-
noses.
2 METHODOLOGY
2.1 Requirements
Our research group is developing E-noses using new
sensing materials(Hussain et al., 2017). This de-
vice should be easy-to-use (independently of the user
background/field of study), easy to assemble and re-
pair, scalable and reliable.
To facilitate the use of the E-nose, the user should
have an interface to insert the following parameters
that describe the experiment in an unambiguous way:
sensors identifiers (sensors IDs), session configura-
tion, VOC specifications, and user ID.
Figure 1 presents an overview of the E-nose sys-
tem and, in the following sections ,the hardware and
the system architectures will be described.
2.2 Hardware
Each E-nose is composed by three hardware systems:
a delivery system, a detection system, and a data ac-
quisition and control system. The delivery system
is composed by two air pumps, tubes and connec-
tors that transfer the VOCs to be analysed from the
headspace of the sample chamber (in the exposure pe-
riods) or the environmental air (in the recovery peri-
ods) to the detection chamber. A two relays module
switches the pump state in each period. The exposure
Figure 1: Architecture of an E-nose plus the network layer.
Each device is composed by multiple systems, namely the
acquisition and control system, the delivery system, and the
detection system. The network layer establishes the inter-
action between the device, the user and the database.
pump is ON in the exposure periods and OFF in the
recovery ones, and the recovery pump vice-versa.
The detection chamber consists in a 3-D printed
black protective box. Inside, there is a set of opti-
cal sensors that change their properties while inter-
acting with VOCs. The optical detection system in-
cludes two PCBs: one with an emission circuit, and
the other with a detection circuit. The sensing mate-
rials are placed in an adequate support, between the
PCBs.
The acquisition and control system includes a mi-
crocontroller (Arduino Due), and an embedded sys-
tem (Raspberry Pi). The output signals given by the
sensors placed in the detection chamber are connected
to the analog input pins of the microcontroller. The
Arduino selected is a 32-bit ARM based microcon-
troller development board, with 12 analog input pins,
a 84 MHz clock, able to run at 3.3 V and has a 12-
bit analog-to-digital converter (ADC), which converts
the analog values into digital values ranging from 0 to
4095. The high number of analog ports and the low
voltage power input, coupled with the ease of pro-
graming make this development board an ideal choice
for this project.
The embedded system chosen for this project was
the Raspberry Pi, since it offers more than enough
power for the needs of this project and has a big active
on-line community. Each one of the E-noses devel-
oped is connected to a Raspberry Pi. The first and the
second assembled E-noses use Raspberry Pi 2, and
the last one already has Raspberry Pi 3.
Table 1 gives a comparison between the processor
and RAM values for each Raspberry Pi version.
Both Raspberry Pi version 2 and 3 have powered
USB ports, and version 3 also has on-board Wi-Fi and
bluetooth version 4. Due to disparity of performance
in the project embedded system’s, all the code and
architecture was designed to run on the performance
BIODEVICES 2018 - 11th International Conference on Biomedical Electronics and Devices
180
lagging device, the version 2. This was accomplished
by making the tasks performed by the Raspberry Pi
as lean as possible. In the purposed architecture, the
Raspberry Pi is only responsible for saving the data
and controlling the Arduino.
The data is stored in a data storage and backup
system, normally called Network Attached Storage
(NAS) for a convenient and organized storage of the
information that is acquired in each E-nose. The NAS
used in this project is a QNAP TS-453A. All E-nose
systems share the same folder, composed by a com-
mon excel file (where the configuration of each exper-
iment session will be stored), and a specific directory
for each E-nose.
2.3 System Architecture
Figure 1 shows every layer of each E-nose and how
the elements interact and communicate with each
other. Each experiment is launched by the user after
setting the necessary parameters. The process runs in
the Raspberry Pi and at the same time, a process is
launched in the personal computer of the user to en-
able real-time visualization. This data is also saved in
the NAS.
This section will thoroughly explain how the var-
ious layers interact in the process of control, acqui-
sition and visualization, showing the flowchart of the
entire experiment session, explaining as well how the
Arduino actions are controlled with a python script
and how the interface is used for monitoring and vi-
sualization.
2.3.1 Acquisition and Control
In each E-nose system, the Arduino board is responsi-
ble for controlling the pump relays module, acquiring
the data from the photo receptors, and read the room
temperature and humidity values.
The Arduino has been flashed with firmata plus
firmware in order to be controlled by a python script
which runs in the Raspberry Pi. This is accomplished
by means of a python library that enables the interac-
tion with the Arduino firmware - pymataIO.
Each of the six photo receptors is connected to an
analog input channel of the Arduino, while the hu-
midity and temperature sensor is connected using the
I
2
C protocol.
Table 1: CPU and RAM values for each version of the Rasp-
berry Pi.
Raspberry Pi version CPU type CPU frequency RAM
1B+ Single 32-bit 700 MHz 500 Mb
2 Quadcore 32-bit 900 MHz 1 Gb
3 Quadcore 64-bit 1200 MHz 1 Gb
Due to the need of using I
2
C, the pymataIO library
was chosen, since between the two most used libraries
used to control Arduinos flashed with the firmata plus
firmware, pymataIO provides a simpler method to im-
plement the protocol.
The control and acquisition script runs in the
Raspberry Pi. In the first place, the user sets the con-
ditions in which the experiment session will be con-
ducted by specifying the parameters that profile the
sample: the sensors’ labels, the room’s conditions,
the total duration of the experiment session, the ex-
posure and recovery duration, and the sampling rates
at which the values from both the photo receptor’s ar-
ray and the temperature and humidity sensors are ac-
quired.
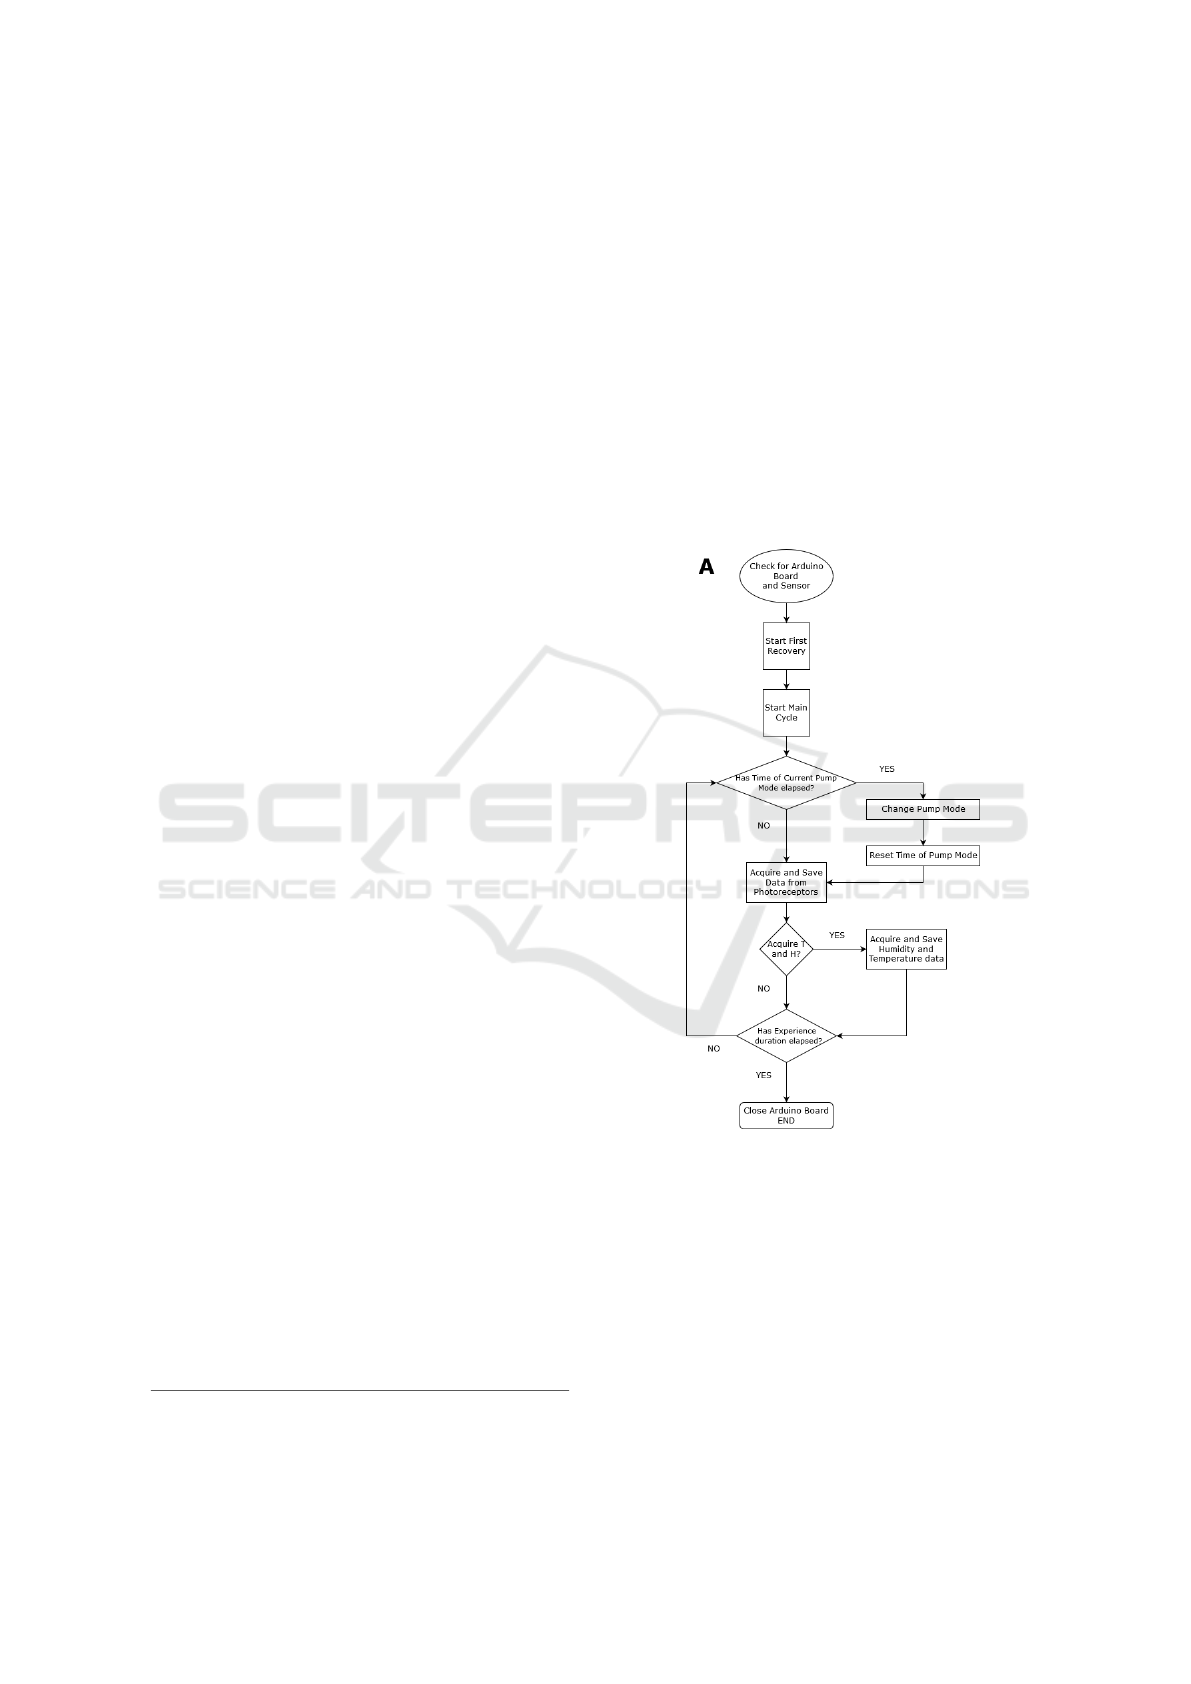
Figure 2: Flowchart that explains how the main process oc-
curs, which demonstrates how the Arduino is controlled.
Figure 2 depicts the flowchart of the process that
controls the Arduino board. After setting the main pa-
rameters, the main cycle starts and a first recovery cy-
cle is performed to clean the detection chamber con-
ditions to a reference state. Further, the acquisition
cycle (main cycle) starts and will last for the duration
specified initially.
As shown in Figure 2, in each iteration of the main
cycle the period of the current activated pump, and the
time for acquiring the room temperature and humidity
are checked. When the period of the pump cycle has
Scalable and Easy-to-use System Architecture for Electronic Noses
181

elapsed, the pump mode (exposition or recovery) is
changed and the pump timer is reset. The temperature
and humidity values are acquired and saved at defined
periods. This process is repeated in each iteration,
ending when the duration of the experiment session
has elapsed.
2.3.2 Network Layer
In order to make the system as scalable as possible,
each acquisition module must be able to easily con-
nect to the NAS and to the user.
First, the NAS, Raspberry Pi systems, and the user
must be connected to the same network, in this case
the internal LAN of the laboratory. By being con-
nected to the same LAN, it makes it easier for all the
devices to see and be seen by the rest of the hardware
components.
With all the components connected to the same
LAN, the IP of both the NAS and the Raspberry Pi
systems must be set to a static IP in order to make the
connection easier. In the case of the Raspberry Pi’s,
the static IP also gives a unique ID to each of them.
In order to access the NAS, each Raspberry Pi
auto-mounts the folders in the shared folders direc-
tory via the network file system (NFS) protocol. Each
Raspberry Pi connects to a particular folder in the
NAS to save the data acquired and to a common folder
containing the Excel file. Each Raspberry Pi folder is
named using its own IP, e.g., eNose108 is the NAS
folder where the Raspberry Pi with the 108 ending IP
connects to. The user also mounts the NAS folders in
his/hers computer in order to access the files for set-
ting up, controlling and visualizing the experiments.
To communicate with the Raspberry Pi ’s via a PC,
the secure shell (SSH) protocol was used. In order to
use this protocol in python, the paramiko library was
used. This library implements the SSHv2 protocol.
This library is used to run the data acquisition script,
query the Raspberry Pi if there is any script running
and to stop the script if the user deems necessary.
2.3.3 Interface, Control and Visualization
In order to ease the management of the experiment,
an user interface has been built using a python GUI
library, TKinter. The interface runs in the personal
computer of the user and coordinates all the processes
that run during the experiment, namely the main pro-
cess that controls the Arduino and runs on the Rasp-
berry Pi, and the visualization process which also runs
in the personal computer of the user. This interaction
is also possible because the interface is connected to
the Raspberry Pi by SSH.
As mentioned in the previous section, each E-nose
system is associated to its corresponding Raspberry Pi
ID. The interface will also be linked to that specific ID
in order to check, every time it is started, if any exper-
iment session is already running in the corresponding
Raspberry Pi. If so, the main page of the interface will
be frame B (see Figure 4), where all the characteris-
tics of the experiment are shown as disabled, whereas
in Figure 3, is represented the main page of the inter-
face, in which would appear enabled for the user to
interact with.
The main page enables the user to configure the
conditions in which the experiment will be conducted.
The first appearance shows a default configuration,
which can be changed according to the needs of the
user. Each entry is verified in order to guarantee that
the input text type is valid.
After the configuration is done, the user can press
the button ”Run” to start the experiment session. This
action triggers a new thread which sends a command
via SSH to the Raspberry Pi that runs the python script
that activates the Arduino and runs as demonstrated
in Figure 2. All the remaining buttons and entries are
disabled, except the button ”Stop” which is enabled
and can be pressed by the user to stop the experiment
session if necessary.
The visualization starts automatically when the
”Run” button is pressed by calling a subprocess that
runs the plotting script in the user’s computer. This
part of the software has been developed in Bokeh,
which is a web based python interactive plotting plat-
form.
As the access to data from the NAS can be slow,
the data has been saved in multiple temporary files
with 100 samples, which are accessed and read by the
plotting process and erased afterwards.
During the experiment the data is acquired and
plotted. When the experiment finishes, all the pro-
cesses are stopped.
The interface and the processes that are launched
are completely independent. If the interface is closed,
the main process that controls the Arduino will still
be active, as well as the visualization subprocess. This
procedure guarantees that the experiment does not fail
by means of any unexpected occurrence.
This independence is also relevant for the scala-
bility of the system, since all the scripts are separated
into specific blocks, it will be easier to use what is
necessary for any future improvement and upgrade of
the system.
2.3.4 Database and Data File Structure
The name of the files where the data from the exper-
iments are stored has itself information about the ex-
BIODEVICES 2018 - 11th International Conference on Biomedical Electronics and Devices
182
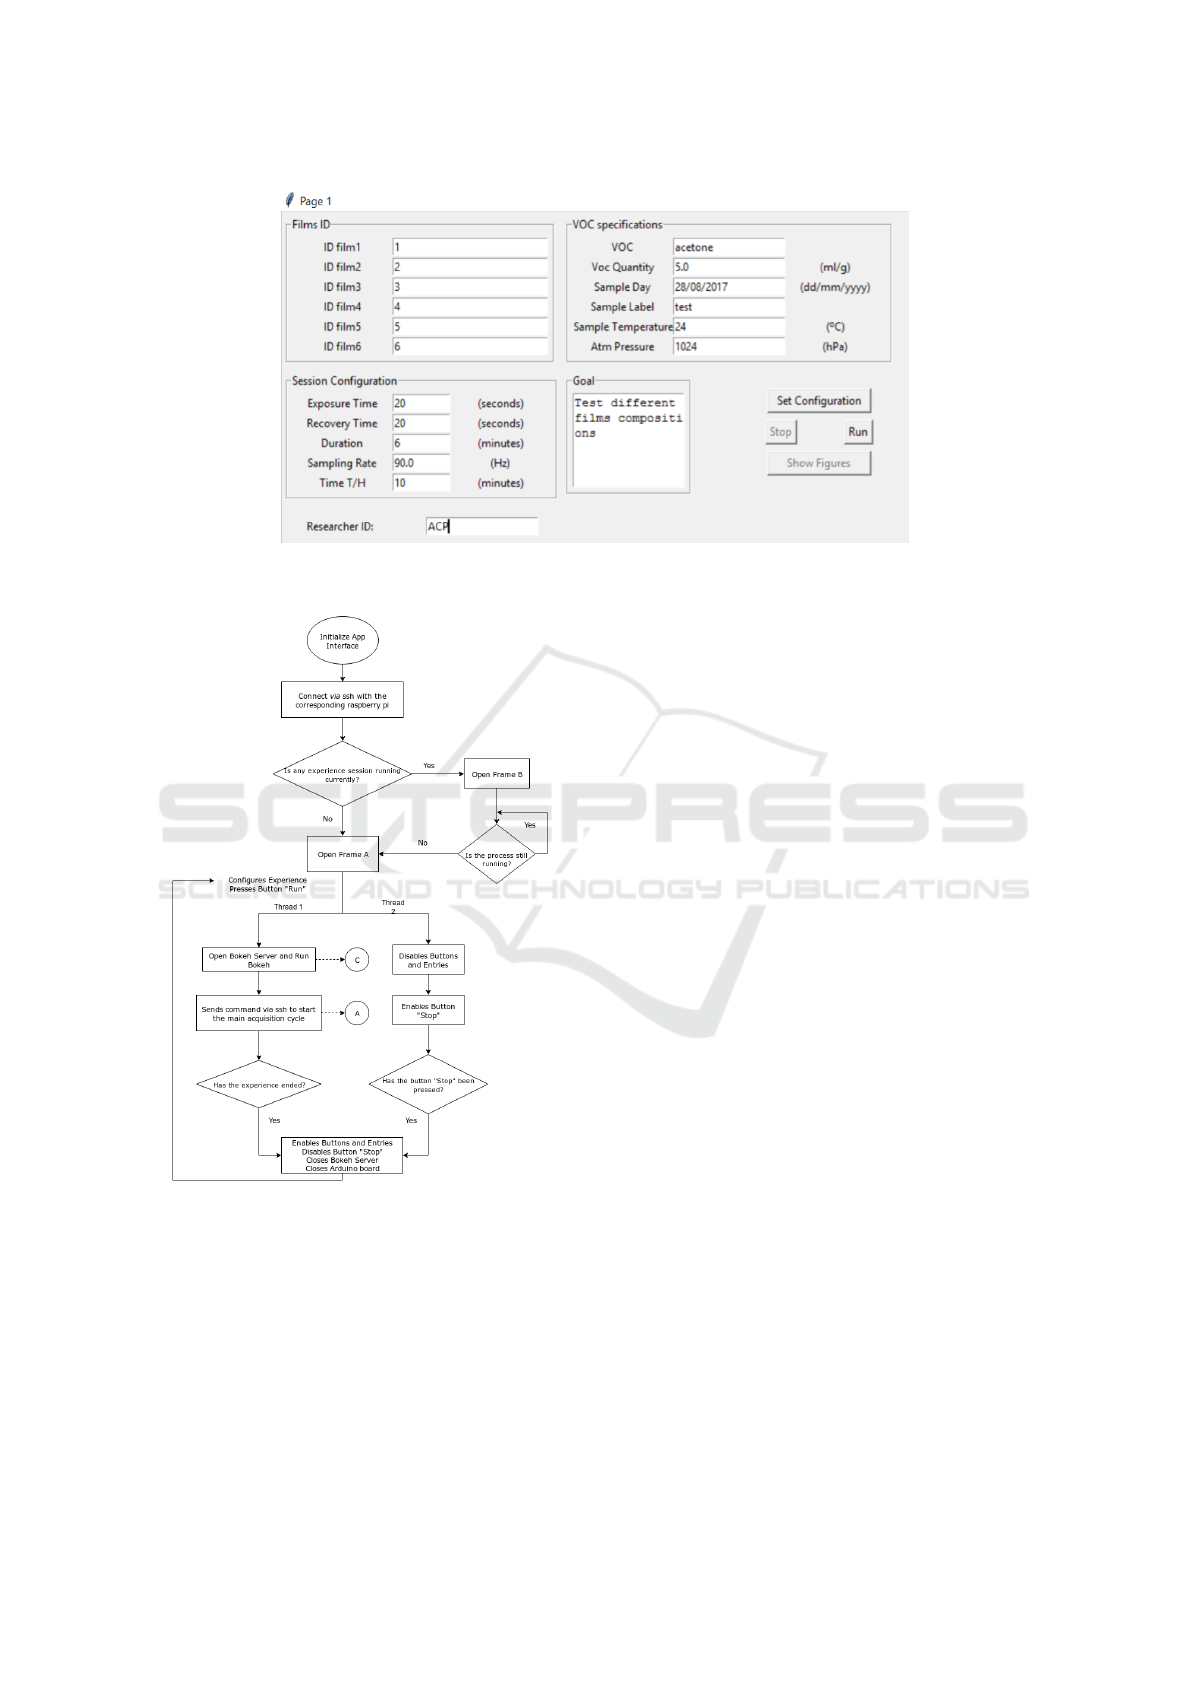
Figure 3: Representation of the frame A of the interface, which shows the data that has to be set by the user and the buttons
that enable the interaction.
Figure 4: Flowchart of the interface code. In this chart
is shown that the interface connects via SSH to the corre-
sponding Raspberry Pi and starts the main process that con-
trols the Arduino and runs in the Raspberry Pi, represented
by the letter A and the flowchart of Fig. 2. The process
C represents the visualization task that runs in the personal
computer of the user.
periment. It is a string with the following parameters:
’data’ + ’experiment session date and hour’ + ’E-nose
version’ + ’last three digits of Raspberry Pi’s E-nose
IP’. The files contain a header that describes all the
experiment conditions, and a body with data from the
experiment.
The header has 22 commented lines, starting with
a ”#”. The first 6 lines present the sensors’ IDs. The
7
th
line indicates the VOC or type of sample that is in-
side the sample chamber. Lines number 8, 9, 10 and
11 refer to the parameters of the sample profile (quan-
tity, day, label and temperature). The atmospheric
pressure is registered at line number 12. The exposure
and recovery period times, the experiment duration,
and the sampling rate are shown in lines 13, 14 and
15, respectively. Line 16 refers to the periods of ac-
quisition from the temperature and humidity sensors.
The remaining lines are more descriptive, including
the researcher(s) responsible name(s), the experiment
goal, the script name, the E-nose version and the last
three digits of the Raspberry Pi IP’s.
The body is composed by 10 columns. The 1
st
refers to the time since the beginning of the exper-
iment session (in seconds). The 2
nd
mentions the
pump state (”True” if the recovery pump is work-
ing, and ”False” if rather the exposure pump is ON).
Columns 3 up to 8 present the values given by each
one of the 6 photo detectors. And, columns 9 and 10
contain the data from the temperature and humidity
sensor, respectively. Each column entry is separated
by the next by a ”;”.
The database is composed by four tables: the sen-
sors table, the pictures table, and the two experiments
tables. The sensors table should be written by the user
prior to the experiment. The pictures table contains
the sensing film images, visualized under 90-degree
crossed polarizing filters at the microscope (magnifi-
cation: 5x), before and after the experiment. Lastly,
the experiments tables fields are automatically written
by the script, while the experiment is running.
Scalable and Easy-to-use System Architecture for Electronic Noses
183

For the sensing films table the following fields
are obligatory and therefore should be filled: ”ID”,
”Label”, ”Production date”, ”IL”, ”IL quantity (µL)”,
”LC”, ”LC quantity (µL)”, ”Polymers”, ”Poly-
mers quantity (mg)”, ”Water quantity (µL)”, ”Cross-
linking”, ”Spread technique”, ”Quantity deposited
(µL)”. Other fields are optional: ”Thickness (µm)”
and ”SC parameters”.
There are two experiments tables: one that con-
templates all the experiments performed (including
even the aborted experiments), and another that just
contains the completed experiments.
Both the experiments tables have the following
columns: ”experiment ID”, ”Date and hour”, ”E-nose
ID”, ”ID sensor 1”, ”ID sensor 2”, ”ID sensor 3”,
”ID sensor 4”, ”ID sensor 5”, ”ID sensor 6”, ”Sam-
ple type”, ”Sample day”, ”Sample label”, ”Sample
quantity (mL or g)”, ”Sample temperature ( C)”, ”At-
mospheric pressure (hPa)”, ”Exposure time (s)”, ”Re-
covery time (s)”, ”Duration (min)”, ”Sampling rate
(Hz)”, ”Responsible person(s)”, ”Goal”, and ”Tem-
perature and humidity acquisition period (min)”. The
”ID sensor” columns are filled with the IDs associated
to the sensor used, which were previously attributed
in the sensors Table.
3 SCALABILITY AND RESULTS
3.1 Scalability
One of the main objectives of this work is make a
scalable experimental system. Currently there are 3
E-noses, but in the future a 20 E-nose system is in the
development pipeline. Figure 5 represents how mul-
tiple E-noses systems would interact.
Figure 5: Demonstration of the arrangement of a scaled sys-
tem that comprises multiple E-noses connected to the same
database.
The current system is designed to be scalable. In
order to add a new node, 5 steps are needed, which
for a 20 node system is manageable.
Since the IP of the Raspberry Pi is needed on the
interface script in order to create a SSH session to
communicate with it, the file name contains the end
number of the IP address. By using the name of the
file to get the IP of the Raspberry Pi, there is no need
to edit the file itself.
Also, the directory name and structure created in
fourth point on the list above is common to all Rasp-
berry Pi’s. The common structures allows the data
acquisition script to be device ”agnostic”, where the
hard-coded paths don’t need to be changed. These
hard-coded paths include the excel file location and
the folder where the data will be saved.
The most time expensive and scalability costly is
the python related tasks, more specifically the up-
grade stage, taking up to 20 minutes.
3.2 Results
The outcomes of this work refer to the structured ar-
chitecture that has been developed and evaluate if it
goes towards the purpose of creating a scalable, easy
to use and low-cost system. In order to present some
of the results, the interaction between the individual
elements of the E-nose system will be shown with a
demonstration of an experiment session.
In Figure 3, the entries have been filled in the cor-
responding fields. This experiment was to test 5 mL
of acetone at 24 °C as VOC. The films were exposed
during 20 seconds, following a recovery of 20 sec-
onds as well. The experiment lasted for 6 minutes
(360 seconds). During this time, the data from the
photo receptors have been acquired at a sampling rate
of 90 Hz, while the temperature and humidity values
were acquired in intervals of 5 minutes.
This configuration is saved in the main Excel file
that is located in the database and saves every config-
uration of all E-noses, as can be seen in the line 7 of
the Excel depicted in Figure 6.
In Figure 7, the plots of this experiment can be
visualized.
Figure 7 shows the signal plots visualized in real-
time using bokeh. Six optical signals were obtained,
when the optical sensors were cyclically exposed to
acetone (exposure time: 20 s) and then recovered
(making atmospheric air pass through them for 20 s).
Different signals were generated, due to the use of
sensing materials with different compositions in the
sensing films unit. The response timing demonstrated
that the multiple elements of the system are synchro-
nized and correctly interconnected.
Nonetheless, this interconnection is only assured
while the elements are connected to the same net-
work. If not, the elements for plotting and control
BIODEVICES 2018 - 11th International Conference on Biomedical Electronics and Devices
184

Figure 6: Print-screen of the Excel file that stores all the configurations. In this is depicted that the configuration from the
current example has been correctly saved and the fields correctly filled.
Figure 7: Representation of the data acquired along the experiment configured with the parameters of Figure 3. The first six
plots are the values acquired from the photo receptor array in volts. The bottom plots show the room temperature in Celsius
degrees (left) and the percentage of relative humidity (right).
will not work and the Arduino will have to be acti-
vated manually in the Raspberry Pi.
One important remark involves the latency of the
database in updating the temporary files that are used
for plotting. By reducing the size of the files to 100
samples per file, we force the NAS to update the
folder thereby reducing the latency. Nevertheless,
there is still a perceived latency to delay the ”real-
time” plotting of the acquired data, which in the worst
cases can be up to 10 seconds.
4 CONCLUSION AND FUTURE
WORK
The main outcome of this work was the development
of a scalable and reliable data acquisition architecture
for an E-nose device prototype. This system is able
to be easily scaled up to a 20 E-nose system, taking
5 steps to setup a new node. The system also has a
ease-to-use interface, that allows the user to config-
ure all the parameters of an acquisition. A real-time
visualization solution is also provided, allowing for
an interactive and succinct experiment. Theses ex-
periments can run in all the current iteration of the
E-nose and up to a sampling rate of 100 Hz. This
means that the same experiment can run in any one
of the in-house developed E-noses, even if some have
the Raspberry Pi 2 and others the Raspberry Pi 3. Due
to the reasons mentioned above, the primary level of
this research has been achieved successfully.
An improvement could be the introduction of a
scheduler, a table where the user can schedule an ex-
periment. Using this alternative, the interface would
be used to fill the schedule table. This would allow
for the experiment to be programmed outside the lab
if, e.g., an on-line spreadsheet service was used. This
Scalable and Easy-to-use System Architecture for Electronic Noses
185

solution would need a script to be always running on
each Raspberry Pi that checks the scheduler for a new
job.
Finally, to mitigate against software problems or
emergency situations, a physical button connected ei-
ther to the Raspberry Pi or the Arduino could be in-
corporated into the system architecture in order to
abruptly stop the experiment.
REFERENCES
Fine, G. F., Cavanagh, L. M., Afonja, A., and Binions, R.
(2010). Metal oxide semi-conductor gas sensors in en-
vironmental monitoring. Sensors, 10(6):5469–5502.
Gardner, J. W. and Bartlett, P. N. (1994). A brief history of
electronic noses. Sensors and Actuators B: Chemical,
18(1-3):210–211.
Gutirrez, J. and Horrillo, M. (2014). Advances in arti-
ficial olfaction: sensors and applications. Talanta,
124:95105.
Hussain, A., T. S. Semeano, A., Palma, S., Pina, A.,
Almeida, J., F. Medrado, B., C. C. S. Pdua, A., L. Car-
valho, A., Dionsio, M., Li, R., Gamboa, H., V. Ulijn,
R., Gruber, J., and C. A. Roque, A. (2017). Liquid
crystals: Tunable gas sensing gels by cooperative as-
sembly (adv. funct. mater. 27/2017). 27.
Loutfi, A., Coradeschi, S., Mani, G. K., Shankar, P., and
Rayappan, J. B. B. (2015). Electronic noses for food
quality: A review. Journal of Food Engineering,
144:103 – 111.
Yan, J., Guo, X., Duan, S., Jia, P., Wang, L., Peng, C., and
Zhang, S. (2015). Electronic nose feature extraction
methods: A review. Sensors 2015, 15:27804–27831.
Zhang, L., Liang, J., Huang, Y., Ma, Y., Wang, Y.,
and Chen, Y. (2009). Size-controlled synthesis of
graphene oxide sheets on a large scale using chemi-
cal exfoliation. Carbon, 47(14):3365 – 3368.
BIODEVICES 2018 - 11th International Conference on Biomedical Electronics and Devices
186
