
Species Categorization via MicroRNAs
Based on 3’UTR Target Sites using Sequence Features
Malik Yousef
1
, Dalit Levy
1
and Jens Allmer
2
1
Community Information Systems, Zefat Academic College, Zefat, 13206, Israel
2
Applied Bioinformatics, Wageningen University and Research, Wageningen, The Netherlands
Keywords: MicroRNA, MicroRNA Target, Categorization, Sequence Features, Machine Learning.
Abstract: Proteins define phenotypes and their dysregulation leads to diseases. Post-translational regulation of protein
abundance can be achieved by microRNAs (miRNAs). Therefore studying this method of gene regulation is
of high importance. MicroRNAs interact with their target messenger RNA via hybridization within a
specialized molecular framework. Many miRNAs and their targets have been identified and they are listed
in various databases like miRTarBase. The experimental identification of functional miRNA-mRNA pairs is
difficult and, therefore, they are detected computationally which is complicated due to missing negative
data. Machine learning has been used for miRNA and target detection and many features have been
described for miRNAs and miRNA:mRNA target duplexes generally on a per species basis. However, many
claims of cross-kingdom regulation via miRNAs have been made and, therefore, we were interested whether
it is possible to differentiate among species based on the target sequence in the mRNA alone. Thus, we
investigated whether miRNA targets sites within the 3’UTR can be differentiated between species based on
k-mer features only. Target information of one species was used as positive examples and the others as
negative ones to establish machine learning models. It was observed that few features were sufficient for
successful categorization of mircoRNA targets to species. For example mouse versus Caenorhabditis
elegans reached up to 97% average accuracy over 100 fold cross validation. The simplicity of the approach,
based on just k-mers, is promising for automatic categorization systems. In the future, this approach will
help scrutinize alleged cross-kingdom regulation via miRNAs in respect to miRNA from one species
targeting mRNAs in another.
1 INTRODUCTION
Protein expression is tightly regulated on several
levels since their dysregulation may often lead to
disease. Two of these levels are gene regulation and
protein stability. Another regulatory level that
directly modulates protein abundance is post
transcriptional regulation governed by microRNAs
(Erson-Bensan, 2014). Mature microRNAs
(miRNAs) interact with messenger RNAs (mRNAs)
via hybridization which leads to modulation of the
translation rate (Saçar and Allmer, 2013). A stretch
of approximately 20 nucleotides incorporated in the
RISC complex functions as the target recognition
key. This type of post-transcriptional regulation has
been described for many species ranging from
viruses (Grey, 2015) to plants (Yousef, Allmer and
Khalifa, 2016a). Known pre-miRNAs are stored in
miRBase (Griffiths-Jones, 2010) and their targets
can be found in TarBase (Vergoulis et al., 2012) and
miRTarBase (Hsu et al., 2014). Currently, about
30000 miRNAs are known but many more may exist
(Londin et al., 2015). In respect to the targets, one
miRNA can have many targets and an mRNA may
be targeted by many miRNAs so that the number of
possible interactions is very large. Human, for
example, has less than 2,000 known pre-miRNAs
but more than 300,000 miRNA-mRNA interactions.
For these interactions to be detectable
experimentally, both miRNA and mRNA need to be
co-expressed. This feat is impossible to achieve for
all miRNA-mRNA pairs since some may only be
expressed under certain conditions (Saçar and
Allmer, 2013). For this reason, computational
detection of pre-miRNAs has become important and
most approaches employ machine learning (Allmer,
2014; Saçar and Allmer, 2014). Machine learning
models have been established for many species
112
Yousef, M., Levy, D. and Allmer, J.
Species Categorization via MicroRNAs - Based on 3’UTR Target Sites using Sequence Features.
DOI: 10.5220/0006593301120118
In Proceedings of the 11th International Joint Conference on Biomedical Engineering Systems and Technologies (BIOSTEC 2018) - Volume 3: BIOINFORMATICS, pages 112-118
ISBN: 978-989-758-280-6
Copyright © 2018 by SCITEPRESS – Science and Technology Publications, Lda. All rights reserved

among them for metazoan (Allmer and Yousef,
2012) and plants (Yousef, Allmer and Khalifa,
2016a) and they depend on the parameterization of
the folded pre-miRNA’s three dimensional structure
(Sacar and Allmer, 2013). Many features have been
described and we recently compared existing
machine learning approaches and were able to show
that an ensemble method is applicable to all species
(Saçar Demirci, Baumbach and Allmer, 2017). This
shows that some structural features universally
describe miRNAs. On the other hand, sequence
based features like k-mers and sequence motifs
(Yousef, Allmer and Khalifa, 2016a), (Malik
Yousef, Khalifa, et al., 2017) can be used to
differentiate pre-miRNAs among species (Malik
Yousef, Nigatu, et al., 2017). Selected features are,
therefore, important when training machine learning
classifiers to distinguish between positive (miRNAs
or their targets) and negative examples. Generally,
two-class classifications suffers from missing high
quality negative examples (Khalifa et al., 2016)
which is even worse when considering miRNA
targets. There is no dataset holding the guarantee not
to contain target sites for miRNAs which confounds
their computational prediction (Hamzeiy, Allmer
and Yousef, 2014). A viable approach to remove the
dependency on negative data is to use one-class
classification (Yousef, Allmer and Khalifa, 2016b).
For the computational detection of miRNA
targets(Peterson et al., 2014), generally the
miRNA:mRNA duplex is considered. Some of the
most commonly used features are seed match,
conservation, free energy, and target site
accessibility. For instance, NBmiRTar (Yousef et
al., 2007) splits the duplex into two parts “seed” and
“out-seed” and extracts a set of features from each.
Among these features are the number of bulges,
number of loops, and number of asymmetric loops.
NBmiRTar also employs sequences features like k-
mers. Similarly, RFMirTarget (Mendoza et al.,
2013) extracts alignment features that are assigned
by miRanda (Enright et al., 2003), minimum free
energy (MFE), and structural features (Watson-
Crick matches, G:U wobble pair, gaps, mismatches).
In this study, we avoid the problem with missing
negative data by using positive examples from one
species as negative examples for another species.
Thereby, training machine learning models that can
differentiate among targets from different species.
Since structural features are widely applicable and
evolutionary stable, we use k-mers which are less
stable and allow differentiation among relatively
closely related species (Malik Yousef, Khalifa, et al.,
2017; Malik Yousef, Nigatu, et al., 2017) which is in
line with previous reports of fast evolution within
vertebrate, fly, and nematode 3’UTRs (Chen and
Rajewsky, 2006). Accordingly, this study only
considers 3’UTR target sites. Thus, it is our aim to
differentiate between miRNA targets sites of one
species by using another species as negative training
data which means that positive and negative classes
derived from known miRNA targets sites. There
have been accounts of cross-kingdom regulation via
miRNAs and we were able to reject some of them
(Bağcı and Allmer, 2016), but on the other hand
cross-kingdom regulation may occur in tightly
coupled systems like viruses or intracellular
parasites and their hosts (Saçar, Bağcı and Allmer,
2014; Saçar Demirci, Bağcı and Allmer, 2016).
Machine learning models allowing the
differentiation of miRNA targets among species add
another line of evidence for the investigation of
cross-kingdom regulation and we suggest that both
miRNAs should fit the host species machine model
(Malik Yousef, Nigatu, et al., 2017) as well as the
targeting model (this study) to consider the
regulation for experimental follow-up studies.
2 MATERIALS AND METHODS
2.1 Datasets
We downloaded all microRNAs’ targets for all
species available on miRTarbase (Release 6.0: Sept.
15, 2015) having 500 or more targets which included
the species Caenorhabditis elegans (Cel), Mus
musculus (Mmu), Homo sapiens (hsa), Rattus
norvegicus (Rno), and Bos Taurus (Bta) (Table 1).
All data can be considered positive examples for
application in regular machine learning. However, to
distinguish among species one species’ positive data
was utilized for training as positive examples while
the other’s positive data was used as negative
training and testing examples.
Table 1: List of the species whose known miRNA:mRNA
duplexes were used in this study and their amounts
available on miRTarBase. Cleaning refers to clustering of
reads and removing duplicates.
Species
Number of target sites
Cel
4,029
Mmu
54,951
Hsa
317,542
Rno
658
Bta
489
Species Categorization via MicroRNAs - Based on 3’UTR Target Sites using Sequence Features
113
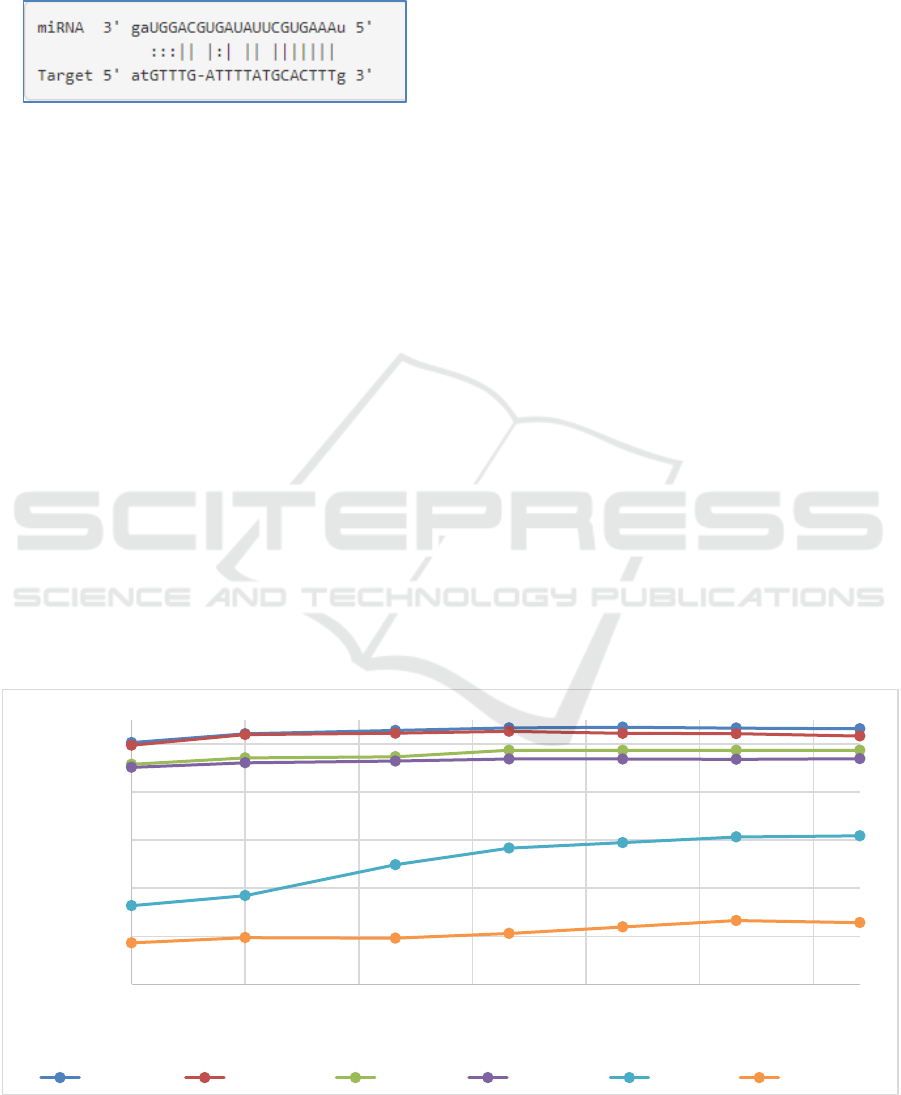
MicroRNA target information on miRTarBase is
presented as miRNA:mRNA duplexes (Figure 1).
Here we only consider the lower part of the image
which refers to the sequence within the 3’UTR.
Figure 1: Example duplex structure of a miRNA and its
target 3’UTR target site.
The set of 3’UTR target sites were filtered according
to sequence similarity using USEARCH (Edgar, 2010) on
the sequences of each species and also on a per species
basis to ensure that there is no bias due to multiple
identical target sequences. 74 similar sequences between
Hsa and Mmu were detected and removed.
2.2 Parameterization
2.2.1 K-mers and Feature Vector
K-mers are short stretches of nucleotides of length k
(also termed n-grams or words). Such sequence-
based features were used for ab initio pre-miRNA
detection, before, and may also be useful for target
prediction (Yousef, Allmer and Khalifa, 2016b).
Formally, a 1-mer is one element of the relevant
alphabet, here {A, U, C, G}. A 2-mer can generate
16 different elements: AA, AC, …, UU. Higher k
have also been used (Cakir and Allmer, 2010), but
here we limited k to 1 ≤ k ≤ 3 leading to 84 features.
As features k-mer frequencies were calculated from
the target sequences divided by the k-mers in the
sequence given by len(sequence) - k + 1.
The feature vector thus consist of all k-mers (1 ≤
k ≤ 3).
For the comparison study we have consider the
results that we have published in previous studies
based on k-mer and sequence motifs(M Yousef et
al., 2017).
2.2.2 Classification Approach
Random Forest (RF, default settings of KNIME
implementation were used) was used for
classification in this study since it outperformed
support vector machines (Vapnik, 1995), decision
trees (DT), and Naive Bayes (NB) in preliminary
tests. The classification approach was setup using
the data analytics platform KNIME (Berthold et al.,
2008). Models were trained and tested using 100
fold Monte Carlo cross validation (Xu and Liang,
2001) and in each fold of the cross validation the
data were split into 80% training and 20% testing.
During random selection, negative and positive
examples were sampled in equal amounts since we
showed that this approach is beneficial for model
establishment in pre-miRNA detection (Sacar and
Allmer, 2013). For each of the 100-fold Monte Carlo
cross validation (MCCV) the performance was
recorded.
2.2.3 Model Performance Evaluation
For each established model we calculated a number
of performance measures for the evaluation of the
Figure 2: Average accuracy for 100-fold MCCV in respect to number of selected features of k-mer. The x-axis is in log 2
format.
0,45
0,55
0,65
0,75
0,85
0,95
1 2 4 8 16 32 64
Average Accuracy
Number of selected features
Mmu vs Cel Rno vs Mmu Hsa vs Cel Rno vs HSA Bta vs Cel Hsa vs Mmu
BIOINFORMATICS 2018 - 9th International Conference on Bioinformatics Models, Methods and Algorithms
114
classifier such as sensitivity, specificity and
accuracy according to the following formulations
(with TP: true positive, FP: false positive, TN: true
negative, and FN referring to false negative
classifications):
Sensitivity = TP / (TP + FN); (SE, Recall)
Specificity = TN / (TN + FP); (SP)
Precision = TP / (TP + FP); (PR)
F-Measure = 2 (PR * SE) / (PR + SE)
Accuracy (ACC) = (TP + TN) /
(TP + TN + FP + FN)
MCC = (TP * TN –FP FN) /
√((TP + FP)(TP + FN)(TN + FN)(TN + FP));
Matthews Correlation Coefficient (Matthews, 1975).
All reported performance measures refer to the
average of 100-fold MCCV.
3 RESULTS AND DISCUSSION
The random forest classifier was used to establish
machine learned models using an 80/20 split from
random sampled and stratified training and testing
data during 100-fold MCCV.
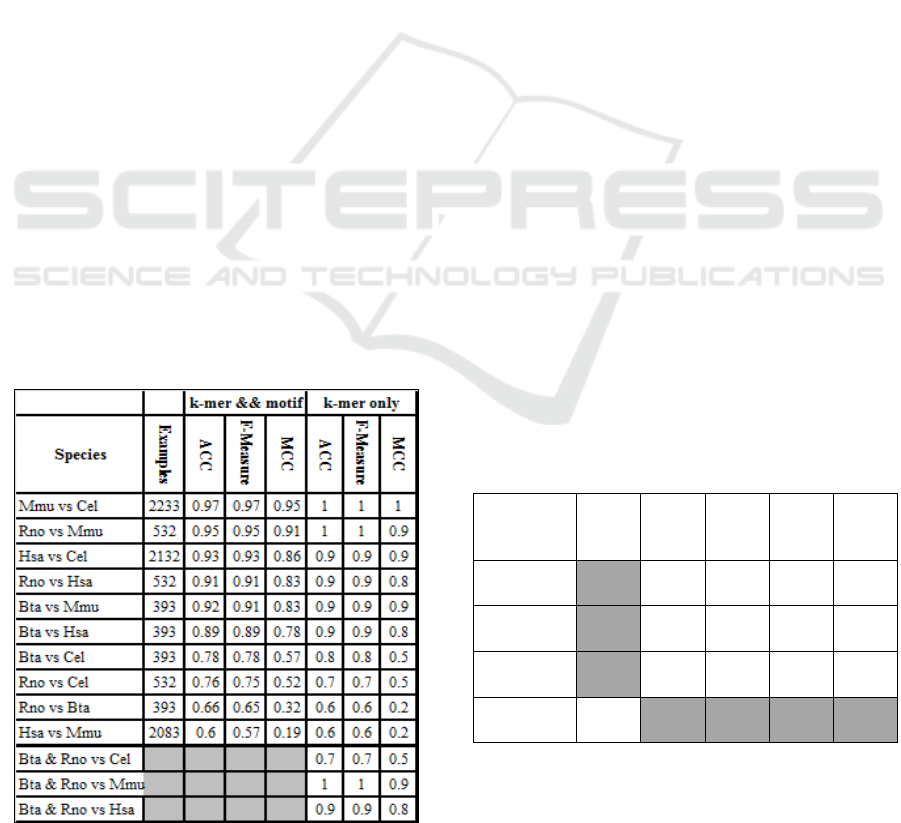
Table 2: Average performance of models trained for
miRNA 3’UTR target site classification against one or the
other species. Training/testing was performed with an
80/20 split at 100-fold MCCV for k-mers and motif
comparing to k-mers only (this study).
In general we used all the 85 k-mer features but
tested the number of features that should optimally
be used for classification (figure 1). For many tests
even low number of features led to relatively good
results. As seen from Figure 1 it is possible to
achieve similar results when using few features (1
vs. 2) and that after using more than 5 features not
much performance can be gained by adding further
features. The list of top k-mer features are listed in
Table 4 on a per experiment basis.
The feature sets consisting of 84 k-mer features
were then used to establish models to differentiate
between miRNA 3’UTR target sites between species
(Yousef, Khalifa, Acar, and Allmer, 2017)
Table 2 indicates that distantly related species
(Figure 3) are easier to differentiate using the trained
models. Examples are Mmu vs Cel, Hsa vs Cel, Bta
vs Cel, and Rno vs Cel. However, Rno vs Mmu
which are the perhaps most closely related species
(Figure 3) in this study achieved an unexpectedly
high accuracy whereas Hsa vs Mmu and Rno vs Bta
were according to expectations. We attribute the
high accuracy when distinguishing between Rno and
Mmu or Hsa to the comparably low number of
available examples for Rno.
Additionally we have tested multi-class
classification using KNIME (Berthold et al., 2008)
based on WEKA 3.7 (Hall et al., 2009) employing
the one-to-one method and balancing the data set
considering 700 examples for training and 200 for
testing from each dataset. By combining Bta and
Rno and Hsa and Mmu. The results are shown in
Table 3 showing an overall accuracy of 78%.
Table 3: multi-class classification results for Bta combined
with Rno (Bta and Rno) and Hsa combined with Mmu
(Hsa and Mmu). Since motifs were found to be sufficient
in our previous work (Malik Yousef, Khalifa, et al., 2017),
the computationally expensive motif calculations for the
new data were not performed in this study (gray cells).
ACC
F-
measure
SP
SE
PR
BtaandRno
0.68
0.87
0.65
0.72
HsaandMmu
0.92
0.95
0.93
0.91
Cel
0.73
0.84
0.76
0.71
Overall
0.78
According to the results in (Yousef, Khalifa,
Acar, and Allmer, 2017) both Rno and Mmu may
contain foreign examples in their datasets such that
Species Categorization via MicroRNAs - Based on 3’UTR Target Sites using Sequence Features
115
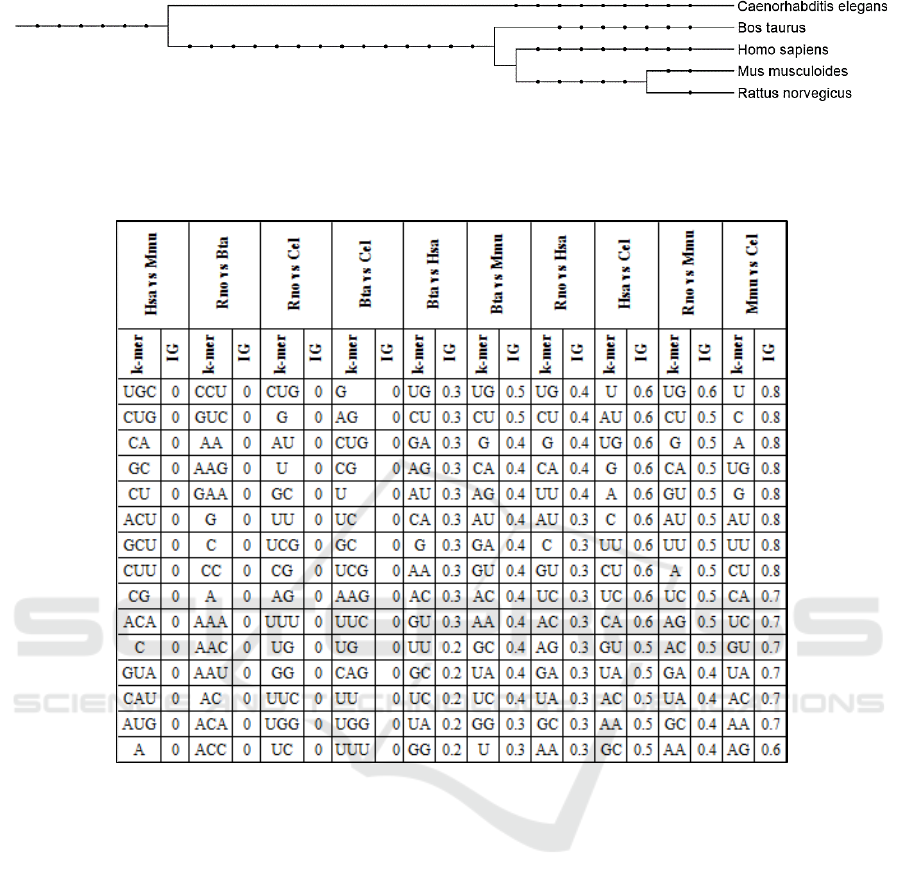
Figure 3: Phylogenetic relationship among organisms and groups used in this study was established using phyloT
(http://phylot.biobyte.de). Itol (http://itol2.embl.de/) was used to create this graph (Leutnic and Bork, 2011).
Table 4: Top 15 k-mer for each experiments. The top k-mer sorted by information gain (IG) for Mmu vs. Cel.
they 1) become different from each other and 2) do
not fit to the general expectation. For Mmu we
previously discovered that filtering their pre-
miRNAs by a very simple measure (RPM > 100)
leads to a 10% increase in average model accuracy
for pre-miRNA detection (Saçar Demirci, Baumbach
and Allmer, 2017). It seems likely, that the effect of
this may be even more pronounced in dependent
datasets like miRNA targets since pre-miRNAs that
are not likely true lead to targets which are
impossibly true. Furthermore, each miRNA can have
many similar but not identical target sites which may
further increase the effect thereby strongly affecting
classification accuracy.
3.1 Top K-mer Features
For each experiment we have used information gain
(IG) in order to rank the k-mer features. The top 15
k-mer are listed in Table 4 sorted by IG values for
Mmu vs. Cel. It is interesting to observe that for
distant species like Mmu and Cel high IG values can
be achieved whereas for closely related species like
Hsa vs. Mmu this is not possible.
Table 5 shows the similarity between the 6
experiments top 15 k-mer features (excluding 4
experiments that the feature are not relevant and
considered as random with IG value close to zero). It
can be observed that for similar combination of
species like Bta vs. Mmu and Hsa, respectively,
similar features are selected. For Hsa vs. Cel and Bta
vs. Mmu this is not the case and the similarity
among top 15 features is much lower.
BIOINFORMATICS 2018 - 9th International Conference on Bioinformatics Models, Methods and Algorithms
116

Table 5: Similarity of the top 15 k-mer among the
different experiments. The similarity is the number of
common features divided by 15.
Mmu
vs
Cel
Rno
vs
Mmu
Hsa
vs
Cel
Rno
vs
Hsa
Bta
vs
Mmu
Bta
vs
Hsa
Mmu
vs
Cel
0.85
0.95
0.90
0.80
0.85
Rno
vs
Mmu
0.80
0.90
0.90
0.85
Hsa
vs
Cel
0.80
0.75
0.80
Rno
vs
Hsa
0.80
0.90
Bta
vs
Mmu
0.90
4 CONCLUSIONS
MicroRNAs are recognized as important regulatory
agents. Their action allows fine-tuning of gene
expression with a many to many relationship
between miRNAs and their targets. Machine
learning has become an important tool for miRNA
and miRNA target detection despite missing quality
guarantee for negative data (Allmer and Yousef,
2012). MicroRNA targets often fall within the
3’UTRs of known genes. The focus of this study is
on performing species categorization employing
only k-mer features and considering only 3’UTR
microRNA target sites. In our previous study (M
Yousef et al., 2017) we have shown that using k-mer
and motif features was successful for model
establishment considering the 3’UTR target sites
only. Here we compare our previous approach of
using just k-mer against motif combined with k-mer
in order to allow for development of future
automated systems which need easy to calculate
features. The results show that the current approach
is successful and in most experiments even slightly
better. Moreover, the simplicity of the model that
based on just-k-mers is a promising approach for
future automatic categorization system and also
simple for interpretation. This work is especially
important when computationally detecting miRNAs
since it allows to add significance to predicted
targets which should fit the species specific model.
In addition, we have previously shown that pre-
miRNAs can be categorized into species (Malik
Yousef, Khalifa, et al., 2017; Malik Yousef, Nigatu,
et al., 2017). Together, these lines of evidence can
be used to add confidence to computationally
detected miRNAs. Additionally, alleged cross-
kingdom regulation via miRNAs should be checked
with this approach to avoid propagation of spurious
results (Bağcı and Allmer, 2016).
ACKNOWLEDGEMENTS
The work was supported by the Zefat academic
college for MY and DL.
REFERENCES
Allmer, J. (2014) ‘Computational and bioinformatics
methods for microRNA gene prediction.’, Methods in
molecular biology (Clifton, N.J.), 1107, pp. 157–75.
doi: 10.1007/978-1-62703-748-8_9.
Allmer, J. and Yousef, M. (2012) ‘Computational methods
for ab initio detection of microRNAs.’, Frontiers in
genetics, 3, p. 209. doi: 10.3389/fgene.2012.00209.
Bağcı, C. and Allmer, J. (2016) ‘One Step Forward, Two
Steps Back; Xeno-MicroRNAs Reported in Breast
Milk Are Artifacts’, PLOS ONE. Edited by V. Scaria,
11(1), p. e0145065. doi: 10.1371/journal.pone.
0145065.
Berthold, M. R. et al. (2008) ‘KNIME: The Konstanz
Information Miner’, in SIGKDD Explorations, pp.
319–326. doi: 10.1007/978-3-540-78246-9_38.
Cakir, M. V. and Allmer, J. (2010) ‘Systematic
computational analysis of potential RNAi regulation in
Toxoplasma gondii’, in Health Informatics and
Bioinformatics (HIBIT), 2010 5th International
Symposium on. Ankara, Turkey: IEEE, pp. 31–38. doi:
10.1109/HIBIT.2010.5478909.
Chen, K. and Rajewsky, N. (2006) ‘Deep conservation of
microRNA-target relationships and 3???UTR motifs in
vertebrates, flies, and nematodes’, in Cold Spring
Harbor Symposia on Quantitative Biology, pp. 149–
156. doi: 10.1101/sqb.2006.71.039.
Edgar, R. C. (2010) ‘Search and clustering orders of
magnitude faster than BLAST’, Bioinformatics,
26(19), pp. 2460–2461. doi: 10.1093/bioinformatics/
btq461.
Enright, A. J. et al. (2003) ‘MicroRNA targets in
Drosophila.’, Genome biology, 5(1), p. R1. doi:
10.1186/gb-2003-5-1-r1.
Erson-Bensan, A. E. (2014) ‘Introduction to microRNAs
in biological systems.’, Methods in molecular biology
(Clifton, N.J.), 1107, pp. 1–14. doi: 10.1007/978-1-
62703-748-8_1.
Grey, F. (2015) ‘Role of microRNAs in herpesvirus
Species Categorization via MicroRNAs - Based on 3’UTR Target Sites using Sequence Features
117

latency and persistence.’, The Journal of general
virology, 96 (Pt 4), pp. 739–51. doi: 10.1099/
vir.0.070862-0.
Griffiths-Jones, S. (2010) ‘miRBase: microRNA
sequences and annotation.’, Current protocols in
bioinformatics / editoral board, Andreas D. Baxevanis
... [et al.], Chapter 12, p. Unit 12.9.1-10. doi:
10.1002/0471250953.bi1209s29.
Hall, M. et al. (2009) ‘The WEKA data mining software’,
ACM SIGKDD Explorations Newsletter, 11(1), p. 10.
doi: 10.1145/1656274.1656278.
Hamzeiy, H., Allmer, J. and Yousef, M. (2014)
‘Computational methods for microRNA target
prediction.’, Methods in molecular biology (Clifton,
N.J.), 1107, pp. 207–21. doi: 10.1007/978-1-62703-
748-8_12.
Hsu, S.-D. et al. (2014) ‘miRTarBase update 2014: an
information resource for experimentally validated
miRNA-target interactions.’, Nucleic acids research,
42 (Database issue), pp. D78-85. doi: 10.1093/nar/
gkt1266.
Khalifa, W. et al. (2016) ‘The impact of feature selection
on one and two-class classification performance for
plant microRNAs.’, PeerJ. United States, 4, p. e2135.
doi: 10.7717/peerj.2135.
Letunic I, Bork P. Interactive Tree Of Life v2: online
annotation and display of phylogenetic trees made
easy. Nucleic Acids Res. 2011;39:W475–8.
Londin, E. et al. (2015) ‘Analysis of 13 cell types reveals
evidence for the expression of numerous novel
primate- and tissue-specific microRNAs’, Proceedings
of the National Academy of Sciences, 112(10), pp.
E1106–E1115. doi: 10.1073/pnas.1420955112.
Matthews, B. W. (1975) ‘Comparison of the predicted and
observed secondary structure of T4 phage lysozyme’,
BBA - Protein Structure, 405(2), pp. 442–451. doi:
10.1016/0005-2795(75)90109-9.
Mendoza, M. R. et al. (2013) ‘RFMirTarget: Predicting
Human MicroRNA Target Genes with a Random
Forest Classifier’, PLoS ONE, 8(7). doi: 10.1371/
journal.pone.0070153.
Peterson, S. M. et al. (2014) ‘Common features of
microRNA target prediction tools’, Frontiers in
Genetics. doi: 10.3389/fgene.2014.00023.
Saçar, M. and Allmer, J. (2014) ‘Machine Learning
Methods for MicroRNA Gene Prediction’, in Yousef,
M. and Allmer, J. (eds) miRNomics: MicroRNA
Biology and Computational Analysis SE - 10. Humana
Press (Methods in Molecular Biology), pp. 177–187.
doi: 10.1007/978-1-62703-748-8_10.
Sacar, M. D. and Allmer, J. (2013) ‘Data mining for
microrna gene prediction: On the impact of class
imbalance and feature number for microrna gene
prediction’, in 2013 8th International Symposium on
Health Informatics and Bioinformatics. IEEE, pp. 1–6.
doi: 10.1109/HIBIT.2013.6661685.
Saçar, M. D. and Allmer, J. (2013) ‘Current Limitations
for Computational Analysis of miRNAs in Cancer’,
Pakistan Journal of Clinical and Biomedical
Research, 1(2), pp. 3–5.
Saçar, M. D., Bağcı, C. and Allmer, J. (2014)
‘Computational Prediction of MicroRNAs from
Toxoplasma gondii Potentially Regulating the Hosts’
Gene Expression.’, Genomics, proteomics and
bioinformatics, 12(5), pp. 228–238. doi: 10.1016/
j.gpb.2014.09.002.
Saçar Demirci, M. D., Bağcı, C. and Allmer, J. (2016)
‘Differential Expression of T. gondii MicroRNAs in
Murine and Human Hosts’, in Non-coding RNAs and
inter-kingdom communication. Springer.
Saçar Demirci, M. D., Baumbach, J. and Allmer, J. (2017)
‘On the performance of pre-microRNA detection
algorithms’, Nature communications, 8(1), p. 330. doi:
10.1038/s41467-017-00403-z.
Vapnik, V. N. (1995) The nature of statistical learning
theory. New York, New York, USA: Springer-Verlag.
Vergoulis, T. et al. (2012) ‘TarBase 6.0: capturing the
exponential growth of miRNA targets with
experimental support.’, Nucleic acids research, 40
(Database issue), pp. D222-9. doi: 10.1093/nar/
gkr1161.
Xu, Q.-S. and Liang, Y.-Z. (2001) ‘Monte Carlo cross
validation’, Chemometrics and Intelligent Laboratory
Systems, 56(1), pp. 1–11. doi: 10.1016/S0169-
7439(00)00122-2.
Yousef, M. et al. (2007) ‘Naïve Bayes for microRNA
target predictions--machine learning for microRNA
targets.’, Bioinformatics (Oxford, England), 23(22),
pp. 2987–92. doi: 10.1093/bioinformatics/btm484.
Yousef, M., Nigatu, D., et al. (2017) ‘Categorization of
Species based on their MicroRNAs Employing
Sequence Motifs, Infor-mation-Theoretic Sequence
Feature Extraction, and k-mers’, EURASIP Journal on
Advances in Signal Processing.
Yousef, M. et al. (2017) ‘Distinguishing Between
MicroRNA Targets From Diverse Species Using
Sequence Motifs And K-Mers, Proceedings of
BIOSTEC 2017, 10th International Joint Conference
on Biomedical Engineering Systems and
Technologies’, Porto., 3.
Yousef, M., Khalifa, W., et al. (2017) ‘MicroRNA
categorization using sequence motifs and k-mers’,
BMC Bioinformatics, 18(1), p. 170. doi: 10.1186/
s12859-017-1584-1.
Yousef, M., Allmer, J. and Khalifa, W. (2016a) ‘Accurate
Plant MicroRNA Prediction Can Be Achieved Using
Sequence Motif Features’, Journal of Intelligent
Learning Systems and Applications, 8(1), pp. 9–22.
doi: 10.4236/jilsa.2016.81002.
Yousef, M., Allmer, J. and Khalifa, W. (2016b) ‘Feature
Selection for MicroRNA Target Prediction – Compari-
son of One-Class Feature Selection Methodologies’, in
Proceedings of the 9th International Joint Conference
on Biomedical Engineering Systems and Technologies,
pp. 216–225. doi: 10.5220/0005701602160225.
BIOINFORMATICS 2018 - 9th International Conference on Bioinformatics Models, Methods and Algorithms
118
