
Do Professional Football Players Follow the Optimal Strategies
in Penalty Shootout?
Takaya Koizumi, Ryohei Orihara, Yuichi Sei, Yasuyuki Tahara and Akihiko Ohsuga
Graduate School of Informatics and Engineering, The University of Electro-Communications, Tokyo, Japan
Keywords:
Penalty Shootout, Optimal Strategy, Big Data.
Abstract:
Do people and companies choose optimal strategies under various situations? If not so, why not? Pursuing
the reason for this helps to understand individuals and companies. In addition, game theory has been heavily
involved in the understanding of sports, economics and other social sciences. In this study, we focused on
football’s penalty shootout where data is relatively easy to collect, mixed strategy can be applied and making
a pay-off matrix considering our own probability is possible. Using the pay-off matrix, we obtained optimal
strategy of the kicker in the penalty shootout and revealed the gap between the optimal strategy and actual
action taken by players. We compared the probability distribution for each data attribute in the dataset in
order to obtain the cause of the gap. We use 100 professional penalty shootouts (total 1032 kicks) which
were collected from internet video site during the period from 2001-2016. Experimental results showed that
there was a gap between the optimal strategy and the actual action taken by players and that it also suggested
the position and team attributes and temporary scores of the shootout and kicking order involved in the gap.
Considering them we made the hypothesis and estimated the cause of the gap. We hope this method can apply
to other fields than sports.
1 INTRODUCTION
‘Optimal strategy’ is defined the strategy which is
played to maximize their own profit by the subject
without cooperation with others. The study has been
done to find optimal strategies in various fields such as
optimal investment behavior (Anderson et al., 2008)
in the economic fields and optimal strategy of serve
in tennis (Gale, 1971) in sports fields.
However, it is another question whether the op-
timal strategy matches the actual strategy taken by
players. Because even if people and companies are
aware of the optimal strategy for the things, they have
the possibility not to follow the strategy because of
the environmental or psychological factors. In other
words, there is a gap between optimal strategy and
actual strategy taken by players. Identifying the cause
of the gap helps to understand the psychological state
in the decision making of people and companies.
This study deals with football’s penalty shootout.
The penalty shootout takes place when there is no
score difference after the specified game time has
gone. Five kickers from each team alternately play
penalty kick(IFBA, 2016) (hereinafter, this is called
‘PK’) and compete for their number of success. Only
when it can not be determined at the end of 10 people,
they take the sudden death system.
The reasons for focusing on football PK game in
this paper are as follows.
• Relatively easy to collect data.
• Since player’s decision is made before the kicker’s
kick (Peiyong and Inomata, 2012), we can play
game theoretic approach using mixed strategy.
• In the penalty shootout, the optimal strategy may
differ from the actual strategy taken by players
because the environmental or psychological influ-
ence greatly affects the performance (Jordet et al.,
2007).
The flow of this study is divided into three steps:
Firstly we got an optimal strategy in the penalty
shootout. We created a goalkeeper (hereinafter, this is
called ‘GK’)’s pay-off matrix considering failure rate
f k
i
, f g
j
, and clarified the kicker’s optimal strategy by
using Minimax. Next, we examined there was a gap
between the actual data and the optimal strategy. Fi-
nally, we extracted the data attributes which are con-
sidered to affect the gap. By referring this attribute,
we made the hypothesis and estimated the cause of
the gap.
454
Koizumi, T., Orihara, R., Sei, Y., Tahara, Y. and Ohsuga, A.
Do Professional Football Players Follow the Optimal Strategies in Penalty Shootout?.
DOI: 10.5220/0006591704540461
In Proceedings of the 10th International Conference on Agents and Artificial Intelligence (ICAART 2018) - Volume 2, pages 454-461
ISBN: 978-989-758-275-2
Copyright © 2018 by SCITEPRESS – Science and Technology Publications, Lda. All rights reserved

2 KICKER’S OPTIMAL STRATEGY
In this section, we describe how to make GK’s pay-off
matrix and to get kicker’s optimal strategy.
2.1 GK’s Pay-off Matrix
In this paper, we consider the direction of the player’s
strategy in the penalty shootout to three directions :
left, center, right, which tear the goal into three equal
parts as seen from the kicker like Fig.1. Let π
i j
be the
GK’s pay-off. i and j represent kicker’s strategy and
GK’s strategy each other. i,j∈{L (left),C (center),R
(right)} is player’s strategy.
Figure 1: Definition of direction.
Now, we consider that GK’s pay-off is ‘1’ when
GK’s action matches the kicker’s action because GK
can block the score, and GK’s pay-off is ‘0’ when
GK’s action is different from kicker’s action because
GK can not block the score. Then GK’s pay-off is π
i j
=1 (i=j) and π
i j
=0 (i6=j). However, this GK’s pay-off
ignores the situation that GK fails to block the score
even if GK’s action matches the kicker’s action and
kicker fails to score even if GK’s action is different
from kicker’s action.
In this study, we use the failure rate f g
j
, f k
i
.Let
N
g
j
be the number of i=j and n
g
j
be the number of situ-
ation that GK can not block score even if GK’s action
matches the kicker’s action (i=j). Similarly, Let N
k
i
be
the number of i6=j and n
k
i
be the number of situation
that kicker can not score even if GK’s action is differ-
ent from the kicker’s action (i6=j). At this time, failure
rate f g
j
, f k
i
are defined as follows.
f g
j
=
n
g
j
N
g
j
(1)
f k
i
=
n
k
i
N
k
i
(2)
A pay-off matrix considering the failure rate is
shown in Table 1.
2.2 Kicker’s Optimal Strategy
By using GK’s pay-off matrix, we calculate kicker’s
optimal strategy. First, we calculate expected value µ
j
Table 1: GK’s pay-off matrix considered failure rate.
i \j L C R
L 1- f g
L
f k
L
f k
L
C f k
C
1- f g
C
f k
C
R f k
R
f k
R
1 − f g
R
of the pay-off in order to get the GK’s optimal strat-
egy. Let p
i
be the probability that the kicker choose
the action i. Then we calculate the expected value µ
j
of the pay-off at each of j∈ L, R, CWe compare mu
j
in each j = L, R, C and make the strategy with the
highest pay-off the GK’s optimal strategy. In addi-
tion, We also visualized this by mapping to the three-
dimensional space of p
R
on the x axis, p
L
on the y
axis and µ
j
on the z axis. Let this three-dimensional
space be .
By applying the Minimax method to GK’s optimal
strategy, we got the kicker’s optimal strategy. The
Minimax is a method by which a subject selects a
strategy so that the opponent’s pay-off is minimized.
3 THE GAP
Firstly, we found the center of gravity of the kicker’s
optimal strategy in space in order to obtain the gap
between the optimal strategy and actual strategy taken
by players. After that, we calculate the gap by com-
paring the probability distribution of the comparison
object with the center of gravity.
3.1 Center of Gravity
In this section, we obtain the center of gravity of the
kicker’s optimal strategy on the GK’s optimal strat-
egy. By finding the center of gravity of the area with
the smallest pay-off of the GK, we can reveal the op-
timal strategy within . Firstly, the GK’s optimal strat-
egy which is expressed in three-dimensional space is
projected into a two dimensional plane of p
R
on the
x-axis and p
L
on the y-axis. In order to calculate the
center of gravity a grid of 0.01 × 0.01 is placed on the
area corresponds to GK’s optimal strategy. The point
(u,v) is the center of gravity of the area if and only if:
(1) the number of grids for x < u is equal to the
number of grids for x > u, and
(2) the number of grids for y < v is equal to the
number of grids for y > v.
3.2 Calculating the Gap
Now, we describe how to find a gap between the opti-
mal strategy and the actual strategy taken by players.
Do Professional Football Players Follow the Optimal Strategies in Penalty Shootout?
455

Let a
z
be a number of the kicker who satisfies a condi-
tion z (eg defender) and a
z
i
be the number of the kick-
ers who choose the action i and satisfy z. Then, the
condition z is represented by the following coordinate
in the X-Y plane of the :
(
a
z
R
a
z
,
a
z
L
a
z
) (3)
In addition, let d be the distance between center of
gravity and (
a
z
R
a
z
,
a
z
L
a
z
). The d represents the gap from
the optimal strategy and is used as an evaluation met-
ric in this study.
4 EXAMINATION AND RESULTS
4.1 Dataset
The dataset used is 100 professional penalty shootouts
(total 1032 kicks) which are collected from internet
video sites
1
during the period from 2001-2016. The
data includes 17 attributes, specifically date, num-
ber of spectators, team name, opponent team name,
kicking order, choice of the first kick or the second
kick
2
, the country where the game took place, direc-
tion kicked, direction to which GK flew, PK kicker
information (player name, position, nationality, dom-
inant foot), and GK information (player name, nation-
ality, height).
4.2 Calculating GK’s Pay-off Matrix
We make a GK’s pay-off matrix by the method ex-
plained in 2.1. In this study, the probabilistic model is
created for each of the dominant feet of the PK kick-
ers. In previous work, varying psychological charac-
ters were observed among right-footed and left-footed
players (Dane and S¸ekertekin, 2005), and statistically,
it was identified that there is a clear difference in
the strategic decision of penalty shootout (Palacios-
Huerta, 2003). Actually, different trends were also
seen in the preliminary experiments in the dataset of
this study, thus we consider that it is natural to divide
probability models with respect to the dominant foot.
Firstly, we calculate failure rate f g
j
, f k
i
in each
dominant foot. The result is shown in Table 2. The
GK’s pay-off matrix for right-footed using this is
shown in Table 3, for left-footed is shown in Table
4.
1
https://www.youtube.com/
2
The referee tosses a coin and the team whose captain
wins the toss decides whether to take the first or the second
kick. (IFBA, 2016)
Table 2: Failure Rate.
f g
R
f g
L
f g
C
f k
R
f k
L
f k
C
right 0.523 0.610 0 0.097 0.070 0.170
left 0.575 0440 0 0.121 0.018 0.342
Table 3: GK’s pay-off matrix (right-footed).
i \j L C R
L 0.391 0.070 0.070
C 0.170 1 0.017
R 0.097 0.097 0.477
Table 4: GK’s pay-off matrix (left-footed).
i \j L C R
L 0.561 0.018 0.018
C 0.342 1 0.342
R 0.121 0.121 0.425
4.3 Calculating Kicker’s Optimal
Strategy and Center of Gravity
We calculate the kicker’s optimal strategy and center
of gravity from the results in Section 4.2. Fig.2 and
Fig.3 show the kicker’s optimal strategy and center
of gravity for each dominant foot respectively, calcu-
lated by the method described in Section 2.2 and 3.1.
The x axis represents the probability of kicker kick-
ing to the right p
R
. The y axis represents the proba-
bility of kicker kicking to the left p
L
, and the z axis
is GK’s expected pay-off µ
j
. We get the kicker’s opti-
mal strategy by applying these GK’s optimal strategy
to Minimax.
From Fig.2 and Fig.3, we can see that the closer
p
R
and p
L
get to 0, the more GK’s expected pay-off
gets for both right-footed and left-footed. From this
result, it is found that the kicker should avoid to aim
to the center, and on the contrary, GK’s the pay-off is
low in the area µ
j
: 0.25-0.3 in each dominant foot,
thus this area is considered kicker’s optimal strategy.
In order to know the more accurate optimal strat-
egy, we obtain the center of gravity in the pay-off area
of µ
j
: 0.25-0.3. By determining the center of gravity
it becomes possible to represent the kicker’s optimal
strategy by one coordinate. As a result, the center of
gravity is (0.51, 0.41) and (0.33, 0.60) respectively in
right-footed left-footed as visualized by cross mark.
There is also a difference depending on the dominant
foot. We find that right-footed and left-footed kicker’s
optimal strategy is right and left, respectively, which
means that the optimal strategy is different depending
on the dominant foot.
ICAART 2018 - 10th International Conference on Agents and Artificial Intelligence
456

Figure 2: Center of gravity in kicker’s optimal strategy area
(right-footed).
Figure 3: Center of gravity in kicker’s optimal strategy area
(left-footed).
4.4 Calculating the Gap
Here, we verify whether the actual professional foot-
ball player’s penalty shootout follow the optimal strat-
egy. After that, we examine the probability distribu-
tion in each attribute and search for the cause of the
gap.
4.4.1 Comparing with Actual Data
As a result of examining the probability distribution
for each dominant foot in the data set, right-footed
player’s probability distribution is (p
R
, p
L
) = (0.37,
0.48) and left-footed player’s probability distribution
is (p
R
, p
L
) = (0.44, 0.40). The distance d from the
center of gravity was d = 0.162 in the case of right-
footed kickers and d = 0.230 in the case of left-footed
kickers. They also did not fit within the area of the ex-
pected pay-off of 0.25 - 0.3 which is regarded as the
optimal strategy area, therefore it is found that pro-
fessional football players do not follow the optimal
strategy.
4.4.2 The Cause of the Gap
In Section 4.5.1, we found that the kicker’s optimal
strategy derived by the Minimax is different from
the behavior of professional football players. There-
fore we have a question why the professional athletes
tends to depart from a strategy that follows the opti-
mal strategy. In this section, we hypothesize the rea-
son.
First, we calculate the probability distribution (p
R
,
p
L
) for each attribute in the data set and got the gap d
0
from the center of gravity. Next, the attributes respon-
sible for the gap are identified based on the difference
between the gap d of the actual data obtained in Sec-
tion 4.5.1 and the gap d
0
. The results are shown in the
Table 5. The following nine attributes are analyzed :
position, nationality, the country where the game took
place, players in the side taking the first/second kick,
temporary scores of the shootout difference, team at-
tributes, kicking order, the number of audiences, and
GK’s height. The score difference represents the su-
periority or inferiority at the moment when kicking
carries out. Nationality is classified into four regions
: Europe, Africa, East Asia, and South America be-
cause the amount of data for each nationality is too
small. For the same reason, we regard 6th, 7th and
8th kickers as one case in the kicking order.
When d −d
0
> 0, it indicates that it is closer to the
optimal strategy than the actual data, and conversely
when it is d − d
0
< 0, it indicates that it is farther.
The Table 5 shows d − d
0
for each attribute. We
consider that the cases with d − d
0
> 0 for each dom-
inant foot is related to factors that follow the opti-
mal strategy, and conversely, the cases with d − d
0
<
0 is related to factors that tends to depart from the
optimal strategy. We regard the cases with different
plus and minus values of d − d
0
due to the domi-
nant foot as having low relevance because the influ-
ence of attribute is independent with respect to each
dominant foot. There are seven cases with d − d
0
>
0 for each dominant foot: position is defender (right-
footed: 0.063, left-footed: 0.011), team attribute is
club team (right-footed: 0.001, left-footed: 0.015),
first/second kick is second kick (right-footed: 0.004,
left-footed: 0.005), order is 4 (right-footed:0.033,
left-footed: 0.076), order is 5 (right-footed: 0.007,
left-footed: 0.056), order is 6 or later (right-footed:
0.002, left-footed: 0.148), score difference is tie
(right-footed: 0.009, and left-footed: 0.010) kicker.
On the other hand, there are two cases with d − d
0
<
0 for each dominant foot: team attribute is national
team (right handed: -0.002, left handed: -0.044), and
order is 3 (right handed: -0.062, left handed: -0.100).
Do Professional Football Players Follow the Optimal Strategies in Penalty Shootout?
457

Table 5: The result of analysis.
Data attribute type
right-footed left-footed
N (p
R
, p
L
) d
0
d − d
0
N (p
R
, p
L
) d
0
d − d
0
Position
Striker 221 (0.31,0.54) 0.240 -0.078 52 (0.44,0.40) 0.230 0.071
Midfielder 388 (0.38,0.47) 0.144 0.058 106 (0.43,0.42) 0.230 -0.018
Defender 176 (0.42,0.44) 0.099 0.063 81 (0.41,0.40) 0.219 0.011
Nationality
Europe 365 (0.35,0.51) 0.240 -0.078 118 (0.47,0.42) 0.229 0.001
Africa 47 (0.40,0.49) 0.132 0.030 10 - - -
East Asia 167 (0.34,0.48) 0.189 -0.027 49 (0.37,0.43) 0.176 0.054
South America 147 (0.40,0.44) 0.113 0.049 34 (0.50,0.32) 0.325 -0.095
Place
Home 196 (0.33,0.51) 0.205 -0.043 60 (0.37,0.48) 0.122 0.108
Away 197 (0.37,0.47) 0.113 0.049 67 (0.48,0.37) 0.271 -0.041
Neutral 397 (0.38,0.49) 0.145 0.017 114 (0.46,0.37) 0.264 -0.034
first/second kick
first 405 (0.36,0.48) 0.166 -0.004 127 (0.45,0.41) 0.225 0.005
second 385 (0.37,0.49) 0.158 0.004 114 (0.45,0.41) 0.225 0.005
Score difference
Superior 173 (0.35,0.48) 0.173 -0.011 42 (0.36,0.38) 0.221 0.009
Inferior 328 (0.38,0.50) 0.164 -0.002 90 (0.42,0.41) 0.210 0.020-
Tie 331 (0.36,0.45) 0.153 0.009 109 (0.46,0.42) 0.220 0.010
Team attributes
National 229 (0.37,0.50) 0.164 -0.002 62 (0.45,0.35) 0.274 -0.044
Club 561 (0.36,0.48) 0.161 0.001 179 (0.44,0.41) 0.215 0.015
Order
1 147 (0.35,0.45) 0.161 0.001 53 (0.50,0.40) 0.272 -0.042
2 153 (0.38,0.49) 0.153 0.009 47 (0.49,0.36) 0.287 -0.057
3 157 (0.35,0.53) 0.220 -0.062 43 (0.51,0.33) 0.330 -0.100
4 143 (0.38,0.44) 0.129 0.033 47 (0.34,0.45) 0.154 0.076
5 95 (0.37,0.47) 0.155 0.007 28 (0.36,0.43) 0.174 0.056
6,7,8 95 (0.40,0.53) 0.160 0.002 23 (0.30,0.52) 0.082 0.148
Audience
50000 to 80000 250 (0.36,0.50) 0.173 -0.011 76 (0.42,0.43) 0.189 0.041
15000 to 50000 369 (0.40,0.46) 0.123 0.039 125 (0.46,0.38) 0.257 -0.027
to 15000 171 (0.31,0.53) 0.231 -0.069 40 (0.43,0.40) 0.221 0.009
GK’s height
height185cm 560 (0.37,0.49) 0.163 -0.001 156 (0.44,0.42) 0.206 0.024
height<185cm 230 (0.37,0.47) 0.158 0.004 85 (0.45,0.35) 0.273 -0.043
‘N’:The number of observation
‘-’:There are only 10 players who corresponds to this case, thus it is not specified.
5 DISCUSSION
From the pay-off matrix, it is shown that the opti-
mal strategies for right-footed and left-footed player
are to kick to right and to left respectively. From
4.5.1, right-footed player’s probability distribution
is (pR, pL) = (0.37,0.48) and left-footed player’s
probability distributionis (pR, pL) = (0.44, 0.40),
therefore it find that the optimal strategy is dif-
ferent from the actual strategy. The left direc-
tion for the right-footed players and the right direc-
tion for the left-footed players are assumed to be
‘natural direction’. It is suggested that GK had a
high pay-off against the ‘natural direction’ kicks be-
cause GK know the actual kicker’s ‘natural direction’
in advance, and conversely, GK had a low pay-
off against the ‘unnatural direction’ kicks because
GK consider that it is rare kicker choose the
‘unnatural direction’. From the kicker’s view, kick-
ing to the ‘unnatural direction’ is the kicker’s optimal
strategy.
Why kicker’s actual action disagree with their op-
timal strategy? We hypothesize that there are two rea-
sons: one is to have a unique strategy derived from
their original theory while being aware of the optimal
strategy, and another is to choose a different strategy
considering environmental or psychological factors.
In order to identify them, we build the hypotheses
based on the d − d
0
in Table 5. First, we explain as-
sumptions on which the hypotheses are based, then
we build hypotheses for the factors.
5.1 The Premise on which the
Hypotheses are Based
The analytics staff is people who contribute to the
team by analyzing various data and providing the re-
sults to the players. Each professional football team
usually has analytics staff, and it is assumed that the
players obtain various information from the analytics
staff beforehand. The player who has a unique strat-
egy derived from their unique experience is a player
who ignores the analytics staff’s prior information,
thus it was excluded from this section. Therefore,
we consider the players who are willing to follow the
prior information in this section.
In teams whose precision of analytics is high and
whose precision of analytics is low, the reliability of
ICAART 2018 - 10th International Conference on Agents and Artificial Intelligence
458

prior information changes, therefore the players in the
team with high precision of analytics follow the opti-
mal strategy more often. Furthermore, a player whose
skill of kicking the PK is low often follows the opti-
mal strategy based on prior information in order to
make the PK successful. Since a lot of stress also has
a large influence on the PK kicker, it becomes diffi-
cult to make an accurate kick, (Jordet et al., 2007),
thus the kicker who has a lot of stress tends to depart
from the optimal strategy. In summary, the premise
basing on the hypothesis identified as follows:
Prem.1 We consider the players who are willing to
follow the prior information.
Prem.2 The players in the team with high preci-
sion of analytics follow the optimal strat-
egy more often.
Prem.3 The players whose skill of kicking the PK
is low often follows the optimal strategy
Prem.4 The kicker who has a lot of stress tends to
depart from the optimal strategy.
5.2 Predicting the Cause of Following
Optimal Strategy
Here we make a hypothesis as to why players follow
the optimal strategy for each cases that have become
d − d
0
> 0 in Table 5. The cases are as follows
Case.1 position is defender
Case.2 team attribute is club team
Case.3 the kicking order is 4 or later.
Case.4 Score difference is tie
Case.5 first/second kick is the second kick
Case.1 The number of players in each posi-
tion in the dataset is (StrikerMidfielderDefender) =
(273493257). Compared with the number of defend-
ers occupied by the formation : 4-4-2, 4-5-1, 4-3-3, 3-
5-2
3
which are used frequently in football, it is found
that there are few opportunities for the defender to
kick the PK
4
. It suggests that the skill of the defender
is low. Thus from Prem.3, the hypothesis ‘Since de-
fenders’ PK kicking skill is relatively low, they tend
to obey the optimal strategy.’ is built.
3
These numbers indicate the number of players in each
position : defender, midfielder, striker from the left
4
The players who participate in a penalty shootout are
only ones who are in the field at the last moment of a match.
Case.2 There are two major differences between
club team and national team. They are the amount
of stored data and the availability of opponents’ data.
Compared with a national team, which is assembled
occasionally, a club team who has been analytics for
many years has more data. Data analysis generally
increases its precision in proportion to the amount of
data. In addition, it seems that the data used by the an-
alytics staff of a national team, especially for penalty
shootout, is mostly the data from the clubs to which
each player belong because a national team lacks data
which includes the particular situations of the penalty
shootout at a national team. Therefore, the national
team precision of analytics is lower than one of club
team. Thus from Prem.2, the hypothesis ‘Since club
teams gives the high precision of analytics, they de-
cide action according to the optimal strategy.’ is built.
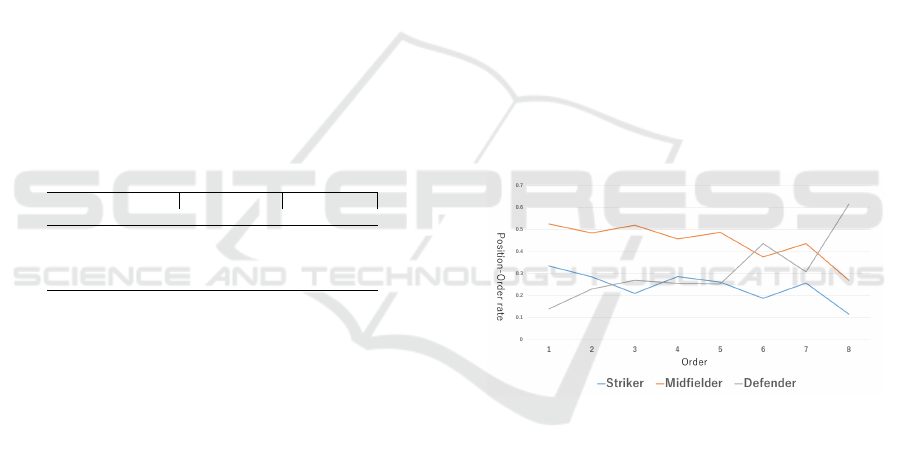
Case.3 Fig.4 shows the occupancy of each position
in each kicking order. It can be seen that the ratio
of the defender in this order is increasing. Since the
defender follow the optimal strategy as described in
Case.1, the hypothesis ‘Since there are a lot of de-
fenders in the order which is 4 or later, they decide
action according to the optimal strategy.’ is built.
Case.4 The reason why the tendency of d − d
0
did
not appear at the time of superiority or inferiority is
that the degree of stress changes by another factor (eg,
first/second kick). On the other hand, at the situa-
tion of the tie without temporary score difference, it
is considered that there is relatively little stress for the
kicker. Thus from Prem.4, the hypothesis ‘Since the
situation of tie gives relatively little stress, they decide
action according to the optimal strategy.’ is built.
Case.5 The Table 6 shows the value of d −d
0
where
the type of a kicker is classified into four categories :
first kick& FH
5
, first kick& SH
6
, second kick& FH,
second kick& SH. From the table, the first kick ap-
proached the center of gravity in the SH and the sec-
ond kick approached the center of gravity in the FH,
which suggests that second kick in the FH has less
stress and the kicker second kick in the SH has a lot
of stress. As the number of people is about 1.5 times
higher in the FH, the influence of second kick in the
FH kicker comes out to the entire the kicker second
kick and it is found that it approached the center of
gravity. Thus the hypothesis ‘Since the kicker sec-
ond kick was influenced by FH the kicker second kick
5
FH represents kicking order is 1 to 3.
6
SH represents kicking order is 4 or later.
Do Professional Football Players Follow the Optimal Strategies in Penalty Shootout?
459
with less stress, they decide action according to the
optimal strategy.’ is built.
In summary, the factors that characterize kickers
who tend to follow the optimal strategy were esti-
mated as follows
Hyp.1 ‘Since defenders’ PK kicking skill is rel-
atively low, they tend to obey the optimal
strategy.’
Hyp.2 ‘Since club teams have the high precision
of analytics, they decide action according
to the optimal strategy.’
Hyp.3 ‘Since there are a lot of defenders in the
order which is 4 or later, they decide action
according to the optimal strategy.’
Hyp.4 ‘Since the situation of tie gives relatively
little stress, they decide action according
to the optimal strategy.’
Hyp.5 ‘Since the kicker second kick was influ-
enced by FH the kicker second kick with
less stress, they decide action according to
the optimal strategy.’
Table 6: d − d
0
where the type of a kicker is classified into
four categories.
type
right-footed left-footed
N d − d
0
N d − d
0
first kick& FH 223 -0.007 77 -0.081
first kick& SH 182 0.012 50 0.109
second kick& FH 234 0.015 66 0.010
second kick& SH 151 -0.041 48 -0.009
5.3 Predicting the Cause of not
Following Optimal Strategy
Here we make a hypothesis as to why players tends
to depart from the optimal strategy for each cases that
have become d − d
0
< 0 in Table 5. The cases are as
follows national team, third kicking order players.
Case.6 national team
Case.7 the kicking order is 3.
Case.6 From Section 5.2, a national team is consid-
ered to have lower precision of analytics than a club
team. Thus from Prem.2, the hypothesis ‘Since a na-
tional team has low precision of analytics, they decide
action which does not follow the optimal strategy.’ is
built.
Case.7 From the Fig.4, the ratio of midfielder oc-
cupies is larger than other position, which is consid-
ered to indicate that the midfielder has a high skill
of kicking the PK. In addition, the third kicking or-
der occupancy rate of midfielder is 52%, which is the
second largest proportion. The situation of defeat if
you do not score come after the third kicking order,
however, it is rare to become such situation at third
kicking order : it only happened3 times out of 157
times. Therefore, we consider that midfielder players
who are technically stronger but not better at handling
stress than the fourth kicking order are placed. There-
fore they feel more stress than other players, thus from
Prem.4, the hypothesis ‘Since the third kicking order
kicker has no technical problems, however weak play-
ers on the stress are placed, they decide action which
does not follow the optimal strategy.’ is built.
In summary, the factors that characterize kickers
who tends to depart from the optimal strategy were
estimated as follows
Hyp.6 ‘Since a national team has low precision
of analytics, they decide action which does
not follow the optimal strategy.’
Hyp.7 ‘Since the third kicking order kicker has no
technical problems, however weak players
on the stress are placed, they decide action
which does not follow the optimal strat-
egy.’
Figure 4: Position-Order rate.
6 RELATED WORK
6.1 Study Related to Penalty Shootout
Studies on penalty shootout have been done from var-
ious viewpoints. Geir Jordet et al (Jordet et al., 2007)
categorizes 403 penalty kicks in the three most impor-
tant international football tournaments : World Cup,
UEFA Champions League, and Copa America by the
type of event, kicking order, position, participation
time, and age and determines the success rate of each
type, they estimated factors that are influencing the
success of the PK. They concluded that psychological
effect is the most important factor.
The study also has been done to identify what kind
ICAART 2018 - 10th International Conference on Agents and Artificial Intelligence
460

of information GK uses to predict the kicker’s action.
Zhou Peiyong et al. (Peiyong and Inomata, 2012) ex-
amined the difference in predicted actions for profes-
sional football player’s PK video performed by ex-
perienced GKs and laymen. The results suggested
that experienced GKs do not rely on visual informa-
tion in front of them, therefore GK decides actions
with prior information (positions, dominant foot, etc.)
regardless of kicker’s behavior. Our study was also
done based on this assumption. However, Savels-
bergh (Savelsbergh et al., 2002) argued that visual in-
formation is also necessary. They also made a direc-
tion prediction for the experienced GKs and laymen
using the PK video kicked by the youth player of the
Netherlands league’s professional team. As a result,
it was concluded that some visual information : head,
kicking leg, non-kicking leg, ball, is the most impor-
tant element because they gazed at the head at an early
time and foot and ball at other times. However, since
this experiment only gathers gaze at these place, it
does not prove that GK is making it as the most im-
portant attributes to decide the action, thus we doubt
that these are the place that GK naturally sees in PK’s
sequence of flows.
6.2 Game Theoretic Approach
Ignacio Palacios - Huerta (Palacios-Huerta, 2003)
concluded that the kicker’s optimal strategy derived
from the mixed Nash equilibrium agreed with the ac-
tual strategy taken by players by examining 1417 PK
in the professional football games. This is a differ-
ent conclusion from the one in this paper. In Ignacio
Palacios-Huerta’s study, he only deals with PKs dur-
ing the match including extra time, with the assump-
tion that each event of PK is the independent decision-
making without being affected by each other. How-
ever, it is difficult for the assumption to deal with
penalty shootout because PK events are done con-
tinuously and environmental or psychological factors
such as the superiority of temporary scores must in-
fluence the strategy. In his research, he also con-
sidered the strategy with only two types of direc-
tions which are summed up as ‘natural direction’ and
‘unnatural direction’, that is, i, j = C are collectively
considered by ‘unnatural direction’. On the other
hand, this paper considered three directions, there-
fore we can deal with more accurate strategy and our
study’s precision is higher.
7 CONCLUSION
In this study, we made a GK’s pay-off matrix that con-
siders the failure ratio and revealed the kicker’s opti-
mal strategy by Minimax method. Next, the presence
or absence of the gap between the actual data and the
optimal strategy was verified, and the probability dis-
tribution of each data attribute was calculated, then at-
tributes considered to be attributable to the gap were
extracted. From the attribute, we estimated the cause
of the gap between the optimal strategy and the ac-
tual strategy taken by players in the penalty shootout.
As a result of the verification, it was suggested that
the position, team attribute, temporary scores of the
shootout and kicking order were involved in the gap.
This method can be applied to the optimal strategy in
other fields such as investment activities. In the fu-
ture, we increase the amount of the data and would
like to obtain more insight on the optimal strategy for
penalty shootout by combining the data attributes.
ACKNOWLEDGEMENTS
This work was supported by JSPS KAKENHI Grant
Numbers JP16K12411, JP17H04705.
REFERENCES
Anderson, C. M., Park, Y.-A., Chang, Y.-T., Yang, C.-H.,
Lee, T.-W., and Luo, M. (2008). A game-theoretic
analysis of competition among container port hubs:
the case of busan and shanghai. Maritime Policy &
Management, 35(1):5–26.
Dane, S¸. and S¸ ekertekin, M. A. (2005). Differences in
handedness and scores of aggressiveness and interper-
sonal relations of soccer players. Perceptual and mo-
tor skills, 100(3):743–746.
Gale, D. (1971). Optimal strategy for serving in tennis.
Mathematics Magazine, 44(4):197–199.
IFBA (2016). Laws of the game 2016/17.
Jordet, G., Hartman, E., Visscher, C., and Lemmink, K. A.
(2007). Kicks from the penalty mark in soccer: The
roles of stress, skill, and fatigue for kick outcomes.
Journal of Sports Sciences, 25(2):121–129.
Palacios-Huerta, I. (2003). Professionals play minimax.
The Review of Economic Studies, 70(2):395–415.
Peiyong, Z. and Inomata, K. (2012). Cognitive strategies for
goalkeeper responding to soccer penalty kick. Percep-
tual and motor skills, 115(3):969–983.
Savelsbergh, G. J., Williams, A. M., Kamp, J. V. D., and
Ward, P. (2002). Visual search, anticipation and exper-
tise in soccer goalkeepers. Journal of sports sciences,
20(3):279–287.
Do Professional Football Players Follow the Optimal Strategies in Penalty Shootout?
461
