
Studies on Rat Brain Phantoms for the Development of
Near-Infrared Spectroscopy (NIRS) System
Gaurav Sharma
*
, Yashika Arora
*
and Shubhajit Roy Chowdhury
School of Computing and Electrical Engineering, Indian Institute of Technology, Mandi, Himachal Pradesh, India
*
Equal contribution
Keywords: Agarose, Intralipid, Near-Infrared Spectroscopy, Phantom, Rat Brain.
Abstract: The present work aims at developing static phantom for rat brain to model the inhomogeneities in the brain
tissues. The inhomogeneities have been modelled by varying the concentration of the fluids that mimic
those inhomogeneities. The local variations in various parts of brain can be considered as different
concentration of substances and accordingly having different optical attributes. Near-infrared spectroscopy
(NIRS) has been used to detect and estimate these local changes that indicate different brain activities. The
paper presents the development of static rat brain tissue phantoms and its analysis using a single channel
near-infrared spectroscopy (NIRS) system. Homogeneous phantoms have been prepared with different
concentrations of agarose and intralipid. For different concentrations, the NIRS signal has been acquired at
dual wavelengths (770 nm and 850 nm). With increase in the concentration of intralipid, an increase in the
amplitude of NIRS signal was noted. The response obtained due to 770 nm and 850 nm sources
corresponded to lower and upper amplitude respectively.
1 INTRODUCTION
Near-infrared spectroscopy (NIRS) is increasingly
becoming popular for monitoring cerebral
oxygenation level by measuring the time variations
in the concentrations of oxygenated haemoglobin
(HbO
2
) and deoxygenated haemoglobin. Cross-
sectional studies on cerebrovascular artery reveal
that impaired cerebral hemodynamics precede
transient ischemic attack and ipsilateral stroke
(Markus and Cullinane, 2001). The NIRS is a non-
invasive analytical tool that uses the electromagnetic
spectrum of wavelength range 700 nm to 2500 nm.
This spectroscopy technique involves both vibration
and electronic transitions. The basic instrumentation
consists of light sources, photo detectors and
dispersive component. This technology is widely
used in functional mapping of cerebral cortex. The
basic idea behind this technique is the fact that
absorption spectra of oxy- and deoxy- hemoglobin
are different in the optical window of 700 nm to 900
nm (Jobsis, 1977). Hence, these absorption spectra
are used as biomarkers in the analyses that relates to
the changes in hemoglobin concentration.
NIR light range is capable of penetrating a few
centimetres deep into the human brain tissue because
the absorption by the tissues is rather low in the NIR
window (Lin et al. 2002). The most favourable
choice of the dual wavelengths in the NIR range is
crucial for signal sensitivity and minimal crosstalk
(Villringer and Chance 1997). Typically, it is
required to choose one wavelength from greater than
NIR light window and other from lower than NIR
light window (Biswal et al. 2011). The selection of
pair of wavelength is used to measure oxy-
hemoglobin (HbO
2
) and deoxy-hemoglobin (Hb)
(Reynolds, 1988). Electrical stimulus response can
also be analyzed using NIRS. This is emerging as a
powerful non invasive diagnostic technique for
monitoring cerebral micro vessels (Sharma et al.
2016). The analyses with NIRS provide an aid in
studying various neural disorders (Dutta et al. 2015;
Arora et al. 2016).
In order to develop and evaluate the performance
of a spectroscopic system, a test on a suitable
phantom is required. The phantom should be a
replica of biological tissue and mimic the optical
properties as desirable for a NIRS system (Jindal et
al. 2015). The most popular phantom used in
research is a mixture of intralipid and agarose
solution (Cubeddu et al 1997; Lindquist et al 1996).
Sharma, G., Arora, Y. and Chowdhury, S.
Studies on Rat Brain Phantoms for the Development of Near-Infrared Spectroscopy (NIRS) System.
DOI: 10.5220/0006589801570163
In Proceedings of the 11th International Joint Conference on Biomedical Engineering Systems and Technologies (BIOSTEC 2018) - Volume 1: BIODEVICES, pages 157-163
ISBN: 978-989-758-277-6
Copyright © 2018 by SCITEPRESS – Science and Technology Publications, Lda. All rights reserved
157
Some research groups also use gelatine for the
phantom preparations (Madsen et al 1992; Vitkin et
al 1995; Hielscher et al 1996).
In this paper we present an approach of
designing and implementing static phantom of rat
brain with varying concentration of intralipid in
agarose solution. A static phantom is the one whose
properties are almost constant throughout the
experiment whereas in case of dynamic phantom,
the experiment is done by varying the properties of
the phantom. Agarose solution allows more
hardening of the sample in comparison to ink or
gelatine solution and is therefore easy to handle. The
phantoms are placed on NIRS setup that constitutes
of two light emitting diodes and a photodiode. Our
work demonstrates the use of NIRS system on rat
brain phantoms which helps in quantifying the
performance of the NIRS system that can be used for
testing brain structures.
The paper is divided into four sections. Section I
presents the introduction to the study. Section II
describes the various materials used and procedures
followed up in the study. The description of NIRS
signal acquired by a single channel setup is given in
section III. Various issues related to phantom design
and NIRS functionality are discussed in section IV.
2 METHODS & PREPARATIONS
2.1 Phantom Preparation
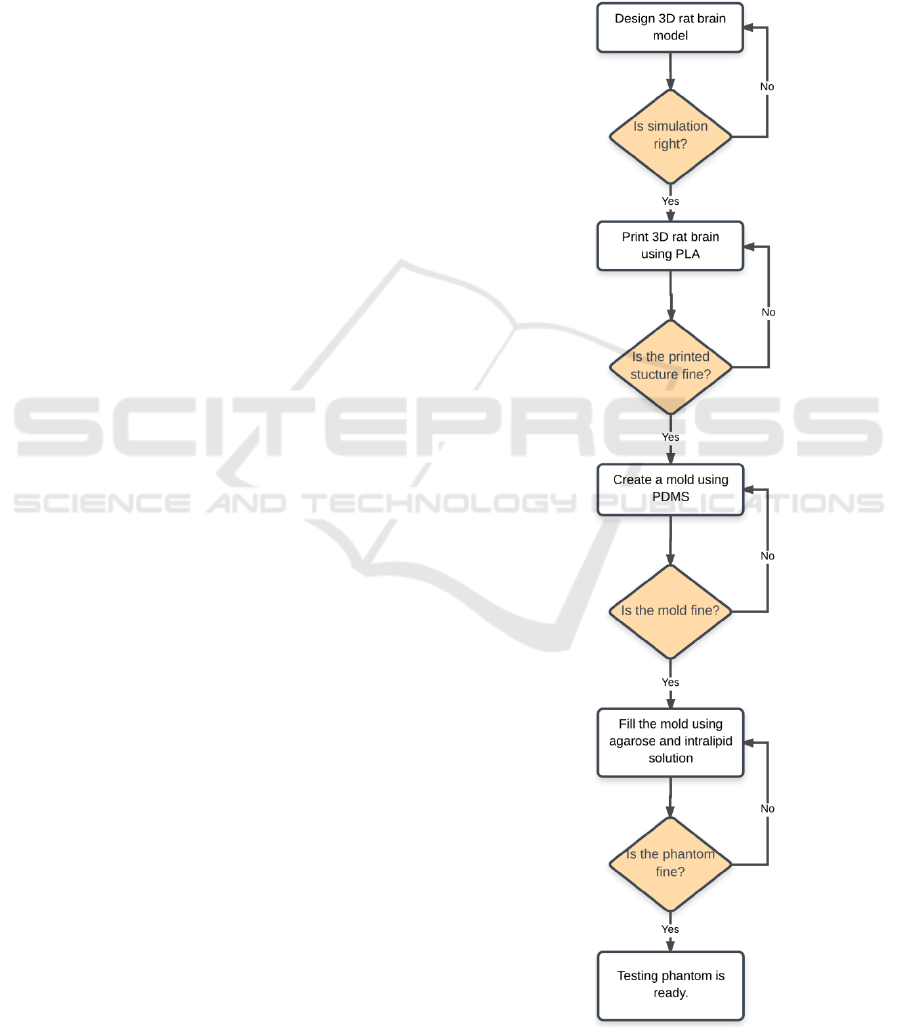
The flowchart for preparing a static rat brain tissue
phantom model is shown in Figure1. The
development of static phantom of a rat brain follows
a four step process.
In the first step, a 3-dimensional rat brain
structure was simulated in Siemens PLM Software
SOLID EDGE ST9. Generally, model designs are
based on length, width, height and volume of
specific rat brain. The final simulation rat brain
model is stored in the “.par” format. This format is
compatible with 3D printer.
The second step involves positioning the rat
brain. In order to minimise the amount of supporting
material, best settings and position of rat brain
model was selected. The various processing
methods, take different amounts of time mainly
depending upon selected material. Polylactic Acid
(PLA) material is used in our experiment. It took
around thirty minutes to print the structure. Acetone
solution was used for surface finish and removal of
the supporting material.
In the third step, PDMS (Polydimethylsiloxane)
was used to make the mould around the printed rat
brain structure. The mould was prepared in two
halves using clay as a separating agent. For curing,
the mould structure was heated in microwave oven
for an hour at 90° C. After curing both the sides, a
cavity is formed in two moulds by removing the
PLA structure.
Figure 1: Flowchart to prepare a static phantom.
BIODEVICES 2018 - 11th International Conference on Biomedical Electronics and Devices
158
In the final step, a solution of 1% of agarose in
distilled water was prepared by heating in the
microwave oven at 90°C. This solution has very low
absorption and therefore intralipid is used as a
scattering agent to get the preferred optical
properties. The important concern in designing a
phantom that closely resembles rat brain is the
amount of scattering and absorption agents. Agarose
powder (A9539, Sigma, and Life Science) was used
to make a solution in distilled water. Samples of the
solution were prepared by adding different
concentrations of intralipid in 1% of agarose
solution. The amount of intralipid in different
samples was: 0.625%, 1.25% and 2.5%. The
solution was stirred continuously to get the
uniformity in the sample. The mixing of intralipid in
agarose solution was done at 53°C and the mould
was filled using this solution at about 40°C. It was
then kept for some time to get proper hardening and
shape. It can be immersed in cold water for some
time for hardening. Later, the mould was removed.
The phantoms were stored in a moist petri dish
sealed with parafilm in refrigerator. Figure 2 depicts
the steps followed in preparing the phantoms.
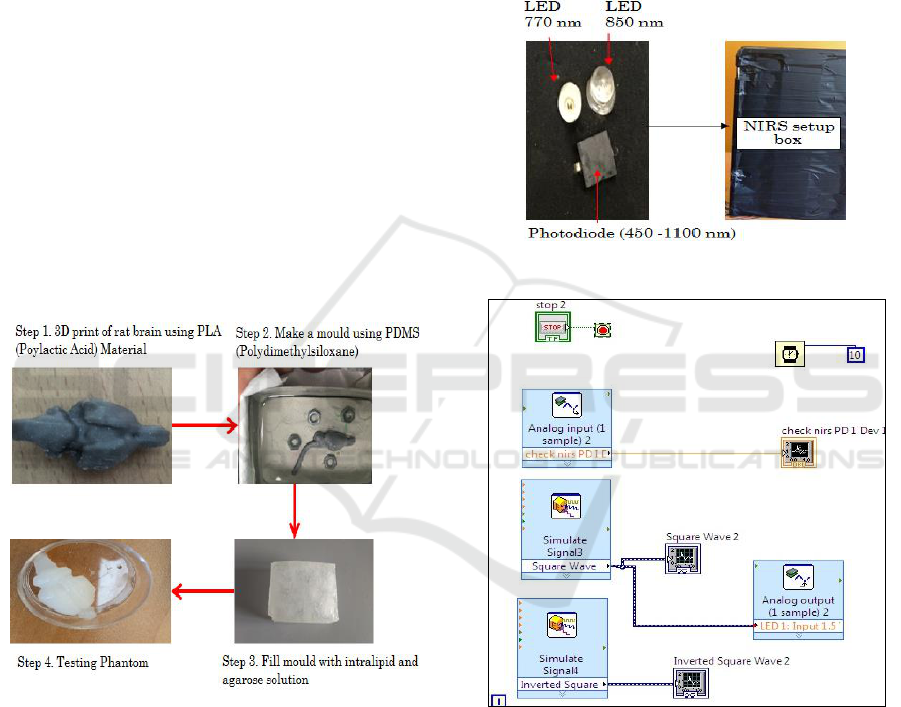
Figure 2: Steps involved in preparing phantom.
2.2 Near Infrared Spectroscopy System
Set-up
Our NIRS system is shown in Figure 3. The NIRS
system consists of two light emitting diodes of 770
nm and 850 nm, one photodiode on neoprene fabric
base and NI myRIO board. NI myRIO board is used
as a controller for LEDs and signal acquiring unit for
the photodetector. The two wavelengths of 770 nm
and 850 nm are chosen because they are on the
opposite sides of the point: ~810 nm where oxy-
hemoglobin and deoxy- hemoglobin have identical
absorption coefficients (Villringer et al. 1993). The
two LEDS are placed together and photo diode is at
a distance of 1cm from the LEDs.
NI LabVIEW system design software has been
used for signal analysis. The simulate LabVIEW VI
was used to provide alternate analog input to both
LEDs and also for acquiring signal in the waveform
chart. This VI is compatible with NI myRIO board
as shown in Figure 4.
Figure 3: One channel NIRS setup.
Figure 4: LabVIEW VI for one channel NIRS system
setup.
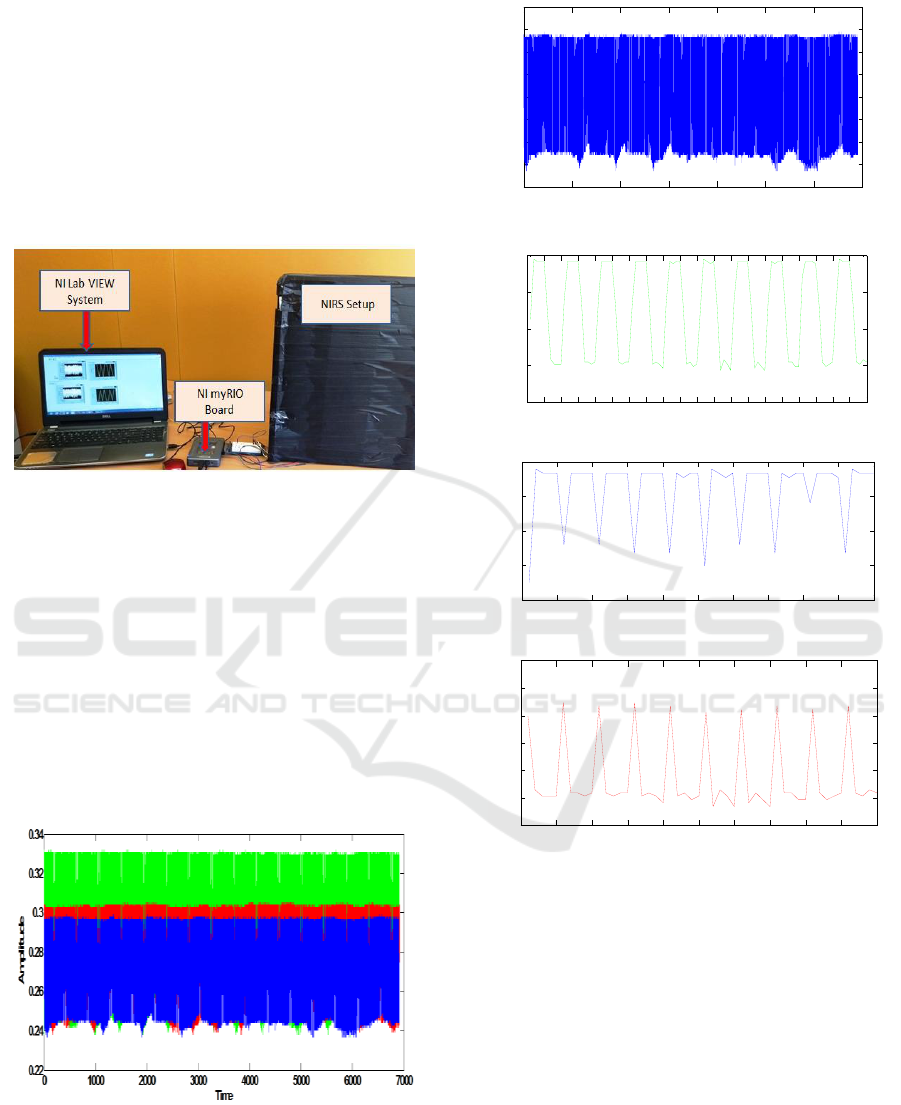
2.3 Experimental Set-up
The phantom has been placed on NIRS set-up and it
has been covered with a black box to avoid ambient
light interference in the experiment as depicted in
Figure 5. The two LEDs were alternately made on
and off. The test is done for three phantoms: 0.625%
of intralipid in 1% agarose solution, 1.25% of
intralipid in 1% agarose solution and 2.5% of
Studies on Rat Brain Phantoms for the Development of Near-Infrared Spectroscopy (NIRS) System
159
intralipid in 1% agarose solution.
The duration of experiment for each phantom is
10 minutes. The signal sample points are recorded
from each phantom using NI myRIO board. In this
experimental approach dual wavelength LEDs were
alternately made on and off. The signal samples
have been recorded at the rate of eleven samples per
second. The first five sample points corresponded to
first LED (850 nm) and last five sample points
corresponded to second LED (770 nm).
Figure 5: Experimental set-up for testing phantoms.
3 RESULTS & DISCUSSION
The experimental measurements are taken on three
phantom samples: 0.625% of intralipid in 1%
agarose solution, 1.25% of intralipid in 1% agarose
solution and 2.5% of intralipid in 1% agarose
solution. The photo diode voltage output for the
samples is shown in Figure 6. Figure 7 illustrates the
photodiode output variation in the first testing
phantom sample 0.625% of intralipid in 1% agarose
solution.
Figure 6: Photodetector output voltage for three test
phantoms.
(a)
(b)
(c)
(d)
Figure 7: (a) Photodiode output signal in the first testing
phantom: 0.625% of intralipid in 1% agarose solution, (b)
First 100 sample points of recorded signal, (c) Upper
amplitude variation in the signal which corresponded to on
time period of LED source 850 nm, (d) Lower amplitude
variation in the signal which corresponded to on time
period of LED source 770 nm.
The output signal behaviour observed in the
second testing phantom sample: 1.25% of intralipid
in 1% agarose solution is shown in Figure 8. In the
second phantom, sample percentage concentration of
intralipid was increased twice as compared to the
first testing phantom sample. The photodiode output
signal performance detected in the third testing
0 1000 2000 3000 4000 5000 6000 7000
0.23
0.24
0.25
0.26
0.27
0.28
0.29
0.3
0.31
Time
Amplitude
0 5 10 15 20 25 30 35 40 45 50 55 60 65 70 75 80 85 90 95 100
0.22
0.24
0.26
0.28
0.3
Time
Amplitude
0 5 10 15 20 25 30 35 40 45 50
0.26
0.27
0.28
0.29
0.3
Time
Amplitude
0 5 10 15 20 25 30 35 40 45 50
0.23
0.24
0.25
0.26
0.27
0.28
0.29
Time
Amplitude
BIODEVICES 2018 - 11th International Conference on Biomedical Electronics and Devices
160
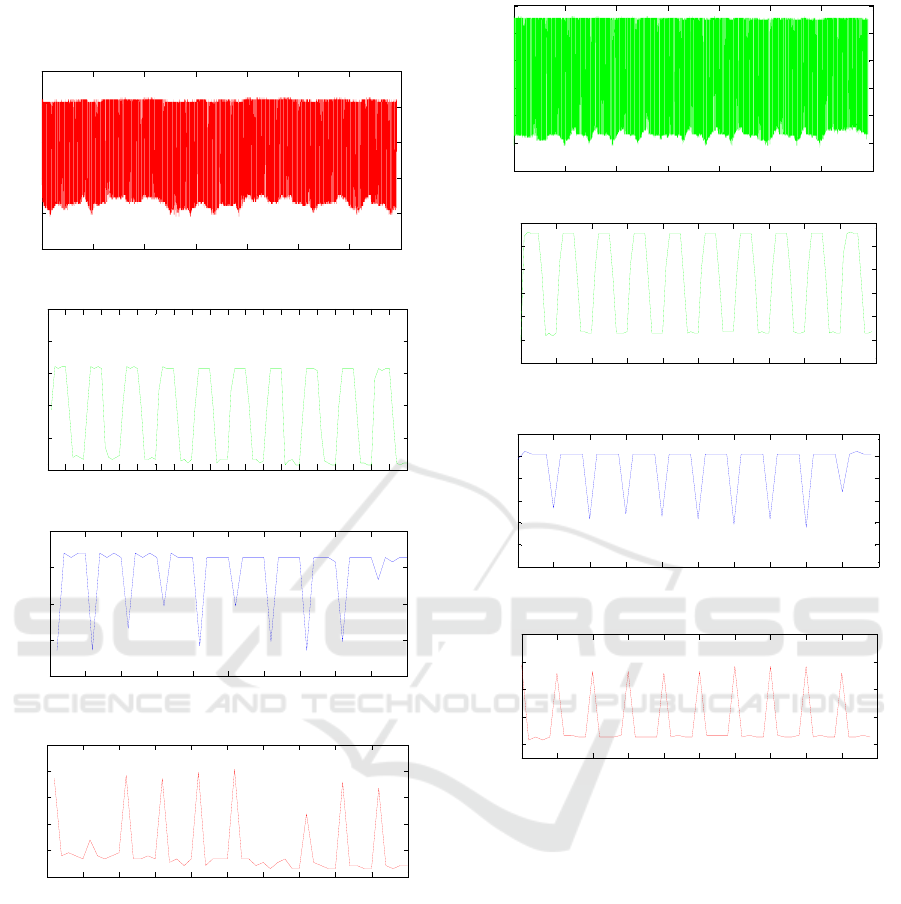
phantom sample: 2.50% of intralipid in 1% agarose
solution is shown in Figure 9.
(a)
(b)
(c)
(d)
Figure 8: (a) Photodiode output signal in thesecond testing
phantom: 1.25% of intralipid in 1% agarose solution, (b)
First 100 sample points of recorded signal, (c) Upper
amplitude variation in the signal which corresponded to on
time period of LED source 850 nm, (d) Lower amplitude
variation in the signal which corresponded to on time
period of LED source 770 nm.
(a)
(b)
(c)
(d)
Figure 9: (a) Photodiode output signal in the third testing
phantom: 2.5% of intralipid in 1% agarose solution, (b)
First 100 sample points of recorded signal, (c) Upper
amplitude variation in the signal which corresponded to on
time period of LED source 850 nm, (d) Lower amplitude
variation in the signal which corresponded to on time
period of LED source 770 nm.
The increase in photo diode voltage with
increase in concentration of intralipid is clearly
visible. Intralipid is a scattering agent. Therefore
more is the concentration of intralipid in the sample,
more is the back scattering, and hence more will be
the output voltage of photo diode. The effect is
clearly visible on higher amplitude of NIRS acquired
signal that corresponds to higher wavelength of 850
nm as depicted in Figure 10. This effect is less
prominent in case of lower wavelength of 770 nm.
The intensities profile due to the phenomenon of
0 1000 2000 3000 4000 5000 6000 7000
0.22
0.24
0.26
0.28
0.3
0.32
Time
Amplitude
0 5 10 15 20 25 30 35 40 45 50 55 60 65 70 75 80 85 90 95 100
0.24
0.26
0.28
0.3
0.32
0.34
Time
Amplitude
0 5 10 15 20 25 30 35 40 45 50
0.27
0.28
0.29
0.3
0.31
Time
Amplitude
0 5 10 15 20 25 30 35 40 45 50
0.24
0.25
0.26
0.27
0.28
0.29
T ime
Amplitude
0 1000 2000 3000 4000 5000 6000 7000
0.22
0.24
0.26
0.28
0.3
0.32
0.34
Time
Amplitude
0 10 20 30 40 50 60 70 80 90 100
0.22
0.24
0.26
0.28
0.3
0.32
0.34
Time
Amplitude
0 5 10 15 20 25 30 35 40 45 50
0.29
0.3
0.31
0.32
0.33
0.34
Time
Amplitude
0 5 10 15 20 25 30 35 40 45 50
0.24
0.26
0.28
0.3
0.32
Time
Amplitude
Studies on Rat Brain Phantoms for the Development of Near-Infrared Spectroscopy (NIRS) System
161
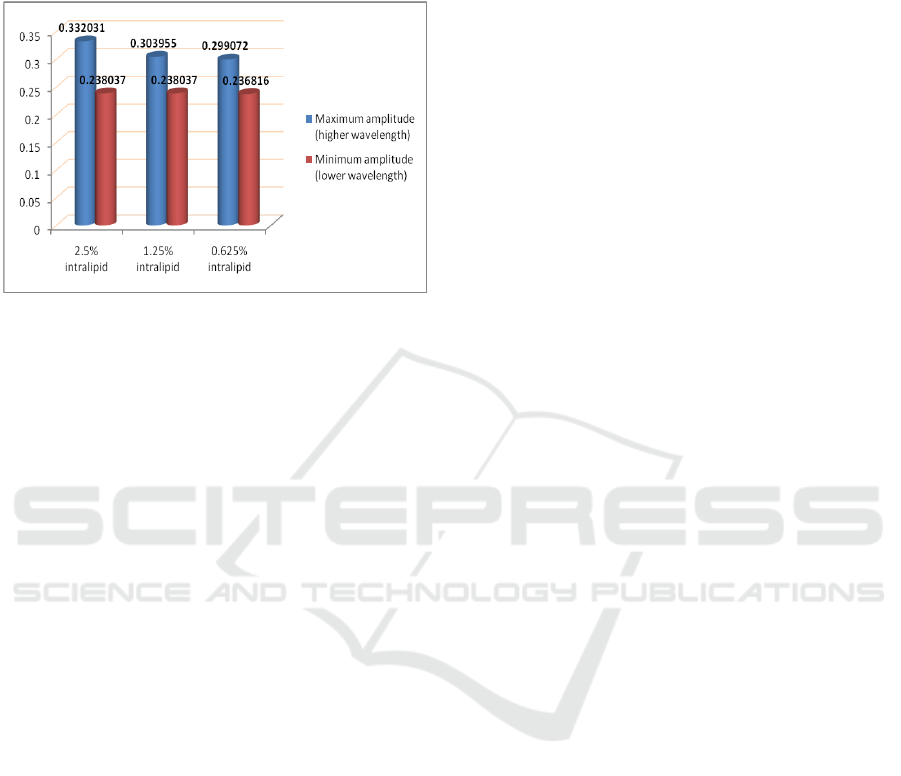
backscattering is linked to the structural and
functional parameters of tissues. These analyses are
required for characterization of optical phantoms in
medical applications.
Figure 10: Amplitude profile for the three phantoms.
4 CONCLUSIONS
The work presented here describes the preparation of
solid static phantoms of agarose and intralipid. They
are tested using single-channel time domain NIRS
system. The phantom design presented is easy to
prepare and can be used to get inhomogeneous
samples with preferred optical properties. Using
similar procedures, it is possible to get multi-layered
structure with varying optical properties so as to
mimic real brain tissues. The NIRS system design is
based on a dual‐core ARM Cortex‐A9 processor
(myRIO Student Embedded Device) and have high
speed NIRS data acquisition rate. For this study, we
attempted to see the affect of scattering agent in the
medium on photo detector output. Similar attempts
can be made on sophisticated designed phantoms
that replicate the real brain. Such experiments
provide an insight in analysis of in vitro complex
structures.
ACKNOWLEDGEMENTS
This work was supported by DST-DAAD project
(POCT-NIRS), Indian Institute of Technology
Mandi, MeitY, Govt of India and University
Medical Center Freiburg. The authors would like to
thank Prof. Dr. Ulrich G. Hofmann, Rand K.
Almajidy for their significant suggestions and help
regarding this work.
REFERENCES
Arora, Y., Sharma, G., Jindal, U., Sood, M., Dutta, A.,
Das, A. and Chowdhury, S.R., 2016, October. A low
cost non invasive hardware for anodal transcranial
direct current stimulation to screen stroke patients
using continuous wave functional near infrared
spectroscopy. In international journal of stroke (Vol.
11, no. Supp 3, pp. 275-275). 1 Olivers yard, 55 City
road, London EC1Y 1sp, England: sage publications
ltd.
Biswal, N.C., Xu, Y. and Zhu, Q., 2011. Imaging tumor
oxyhemoglobin and deoxyhemoglobin concentrations
with ultrasound-guided diffuse optical
tomography. Technology in cancer research &
treatment, 10(5), pp.417-429.
Cubeddu, R., Pifferi, A., Taroni, P., Torricelli, A. and
Valentini, G., 1997. A solid tissue phantom for photon
migration studies. Physics in medicine and
biology, 42(10), p.1971.
Dutta, A., Jacob, A., Chowdhury, S.R., Das, A. and
Nitsche, M.A., 2015. EEG-NIRS based assessment of
neurovascular coupling during anodal transcranial
direct current stimulation-a stroke case series. Journal
of medical systems, 39(4), p.36.
Hielscher, A.H., Liu, H., Chance, B., Tittel, F.K. and
Jacques, S.L., 1996. Time-resolved photon emission
from layered turbid media. Applied optics, 35(4),
pp.719-728.
Jindal, U., Sood, M., Dutta, A. and Chowdhury, S.R.,
2015. Development of point of care testing device for
neurovascular coupling from simultaneous recording
of EEG and NIRS during anodal transcranial direct
current stimulation. IEEE journal of translational
engineering in health and medicine, 3, pp.1-12.
Jobsis, F.F., 1977. Noninvasive, infrared monitoring of
cerebral and myocardial oxygen sufficiency and
circulatory parameters. Science, 198(4323), pp.1264-
1267.
Lin, Y., Lech, G., Nioka, S., Intes, X. and Chance, B.,
2002. Noninvasive, low-noise, fast imaging of blood
volume and deoxygenation changes in muscles using
light-emitting diode continuous-wave imager. Review
of Scientific Instruments, 73(8), pp.3065-3074.
Lindquist, C., Pifferi, A., Berg, R., Andersson‐Engels, S.
and Svanberg, S., 1996. Reconstruction of diffuse
photon‐density wave interference in turbid media from
time‐resolved transmittance measurements. Applied
physics letters, 69(12), pp.1674-1676.
Madsen, S.J., Wilson, B.C., Patterson, M.S., Park, Y.D.,
Jacques, S.L. and Hefetz, Y., 1992. Experimental tests
of a simple diffusion model for the estimation of
scattering and absorption coefficients of turbid media
from time-resolved diffuse reflectance
measurements. Applied optics, 31(18), pp.3509-3517.
Markus, H. and Cullinane, M., 2001. Severely impaired
cerebrovascular reactivity predicts stroke and TIA risk
in patients with carotid artery stenosis and
occlusion. Brain, 124(3), pp.457-467.
BIODEVICES 2018 - 11th International Conference on Biomedical Electronics and Devices
162

Reynolds, E.O.R., Wyatt, J.S., Azzopardi, D., Delpy, D.T.,
Cady, E.B., Cope, M. and Wray, S., 1988. New non-
invasive methods for assessing brain oxygenation and
haemodynamics. British Medical Bulletin, 44(4),
pp.1052-1075.
Sharma, G., Arora, Y. and Chowdhury, S.R., 2016,
December. A 4X1 High-Definition Transcranial Direct
Current Stimulation Device for Targeting Cerebral
Micro Vessels and Functionality Using NIRS.
In Nanoelectronic and Information Systems (iNIS),
2016 IEEE International Symposium on (pp. 47-51).
IEEE.
Villringer, A. and Chance, B., 1997. Non-invasive optical
spectroscopy and imaging of human brain
function. Trends in neurosciences, 20(10), pp.435-
442.
Villringer, A., Planck, J., Hock, C., Schleinkofer, L. and
Dirnagl, U., 1993. Near infrared spectroscopy (NIRS):
a new tool to study hemodynamic changes during
activation of brain function in human
adults. Neuroscience letters, 154(1), pp.101-104.
Vitkin, I.A., Wilson, B.C. and Anderson, R.R., 1995.
Analysis of layered scattering materials by pulsed
photothermal radiometry: application to photon
propagation in tissue. Applied optics, 34(16), pp.2973-
2982.
Studies on Rat Brain Phantoms for the Development of Near-Infrared Spectroscopy (NIRS) System
163
