
Automated Measurement of Adherence to Traumatic Brain Injury
(TBI) Guidelines using Neurological ICU Data
Anthony Stell, Ian Piper and Laura Moss
Department of Clinical Physics, University of Glasgow, Glasgow, U.K.
Keywords: Guideline Adherence, Process Models, Similarity Calculations.
Abstract: Using a combination of physiological and treatment information from neurological ICU data-sets, adherence
to traumatic brain injury (TBI) guidelines on hypotension, intracranial pressure (ICP) and cerebral perfusion
pressure (CPP) is calculated automatically. The ICU output is evaluated to capture pressure events and
actions taken by clinical staff for patient management, and are then re-expressed as simplified process
models. The official TBI guidelines from the Brain Trauma Foundation are similarly evaluated, so the two
structures can be compared and a quantifiable distance between the two calculated (the measure of
adherence). The methods used include: the compilation of physiological and treatment information into
event logs and subsequently process models; the expression of the BTF guidelines in process models within
the real-time context of the ICU; a calculation of distance between the two processes using two algorithms
(“Direct” and “Weighted”) building on work conducted in the business process domain. Results are
presented across two categories each with clinical utility (minute-by-minute and single patient stays) using a
real ICU data-set. Results of two sample patients using a weighted algorithm show a non-adherence level of
6.25% for 42 mins and 56.25% for 708 mins and non-adherence of 18.75% for 17 minutes and 56.25% for
483 minutes. Expressed as two combinatorial metrics (duration/non-adherence (A) and duration * non-
adherence (B)), which together indicate the clinical importance of the non-adherence, one has a mean of
A=4.63 and B=10014.16 and the other a mean of A=0.43 and B=500.0.
1 INTRODUCTION
Across many fields of clinical medicine guidelines
are used to inform and develop best practice. In
order to make sure that these guidelines are being
followed correctly and effectively, there are a
variety of methods to monitor compliance. Common
current methods to do this include post-hoc surveys
that form the core data for research papers, or
regular meetings after a hospital shift (or similar) to
discuss different cases where perhaps the guideline
was not adhered to, or negative outcomes were
potentially avoidable.
Nearly all current methods have two features:
qualitative evaluation and a long time-lag where the
results of the surveys or discussion can find their
way back into either local best practice, or can be
submitted to multi-centre evaluations for the further
development of the guidelines themselves. Whilst
useful, it is very often the case that these features do
not make full use of the data and technology that is
now available to many fields of clinical medicine. A
potential advantage of using such data and
technology would be quantitative evaluations (e.g.
an adherence rate of 67%) and rapid feedback of
non-compliance to guidelines.
This work attempts to leverage those
advantages by providing a “near real-time” ability to
monitor clinical guideline adherence, as well as
providing measurable quantitative feedback. Using
data and technology currently available, the goal of
this research is to express the structure of
physiological and treatment patient data in such a
way that can be immediately compared against best-
practice text guidelines. The results are broadly
grouped into two categories, each representing a
real-life clinical scenario:
▪ Minute-by-minute data: where immediate
feedback would be provided indicating the level
of adherence in that moment
▪ Per pressure event: where retrospective
guidance on adherence could provide
information on the best way to manage
Stell, A., Piper, I. and Moss, L.
Automated Measurement of Adherence to Traumatic Brain Injury (TBI) Guidelines using Neurological ICU Data.
DOI: 10.5220/0006583801350146
In Proceedings of the 11th International Joint Conference on Biomedical Engineering Systems and Technologies (BIOSTEC 2018) - Volume 5: HEALTHINF, pages 135-146
ISBN: 978-989-758-281-3
Copyright © 2018 by SCITEPRESS – Science and Technology Publications, Lda. All rights reserved
135

individual pressure events given a patient’s
particular clinical context
The technical approach adopted to achieve these
goals is a combination of the following: the
expression of the two data types (physiological and
treatment) into a simplified process model; the
expression of the relevant text guidelines into a
comparable structure; a distance between these two
models is then evaluated using similarity
calculations taken from the domain of business
process model comparisons (Dijkman et al. 2009).
2 MOTIVATION
There are two main areas that provide the relevant
background to this work: the nature of data within
critical care – traumatic brain injury (TBI) in
particular – and the detail of the technology chosen
to support the solution of automated guideline
adherence.
2.1 Critical Care Data
In the fields of medicine that involve critical care –
traumatic brain injury (TBI) as an example –
technology has advanced throughout the late 20
th
and early 21
st
centuries to the point where nearly
every modern intensive care unit (ICU) in the
developed world has a multitude of high frequency
data streams available, which can closely capture the
actual application of clinical interventions and the
time-varying physiological response of patients.
The technologies that enable this output of raw
data are well established, and the economics of data
storage make retention of large volumes for
extended periods a feasible option. However, the key
to establishing the integrity of that data for a specific
purpose – whether it is a study as large as a multi-
centre randomised controlled trial (RCT) or
something more modest such as an audit of local
clinical practices – is to monitor that raw data and
understand the relationships between clinical
treatments and physiological output.
This involves understanding that relationship at a
level “above” the numbers that are output from
bedside machines (other terminology may similarly
describe this idea as observing data at a higher
“layer of abstraction”). The actual physiological
output shows a series of numbers, which without
proper context can mean very little, but which, with
appropriate surrounding information, could be
formed into structures that do have clinical meaning
(e.g. an “adverse event” such as a sudden spike in
blood pressure would be represented by a particular
combination of systolic and diastolic blood pressure
numbers). When this is combined with clinical
treatment information (e.g. the time and dose of a
bolus of Noradrenaline) then patterns of clinical
behaviour and patient response can be built up.
If the algorithms used to represent these patterns
of information are valid, then – due to the proximity
of this data representation to the source – it is likely
that it will be a highly accurate description of what
happens in an ICU. And therefore in theory, it would
be possible for a system to work out – empirically
from source – whether a specific clinical process in
the ICU has been followed or not.
Very often, the most important and highly-
valued process within any clinical field is that of the
official guidelines compiled and peer-reviewed by
domain experts. Therefore an automated process to
measure adherence to these guidelines would very
likely be welcome due to the information it could
provide on procedure, compliance and base-line
information for studies to either build upon or
challenge those guidelines. For instance, questions
that could be asked of the system could be:
1) “Has a particular protocol or guideline been
applied correctly?” (to audit local compliance)
2) “Does a particular guideline recommendation
actually work?” (use outcome versus
compliance data to provide information to a
wider study)
Whilst it is hoped that solutions to this type of
guideline adherence measurement could be applied
to critical care generally, the area of traumatic brain
injury (TBI) – and within TBI specifically the
management of intra-cranial pressure (ICP) and
cerebral perfusion pressure (CPP) - has many
features that make it a good candidate for study: the
condition is complex and therefore suffers from
large uncertainties in official guideline compilation
and compliance (Bullock et al. 1996); it is also an
environment that heavily uses modern technology to
provide high-resolution neuro-ICU physiological
and clinical treatment data streams (Piper et al.
2009); and the seriousness and prevalence of the
condition (www.headway.org.uk) means that any
advances in the field have the potential to make a
large and positive impact on the population.
HEALTHINF 2018 - 11th International Conference on Health Informatics
136

2.2 Applied Technology
Based on the considerations above concerning
critical care data, the general technical data
requirements to achieve this can be identified as
follows:
▪ High resolution physiological patient data
▪ Accurate and comprehensive treatment data
▪ The ability to combine these into a formalised
process expression
▪ The ability to compare this formalised
expression with other similar entities (such as
guidelines, study protocols, institutional
procedure, etc)
Whilst the pool of potential technological
solutions for this type of problem space is large, the
following criteria – after accuracy and validity –
were deemed the most important when choosing a
solution:
▪ Simplicity of implementation
▪ Minimising points of “assumed knowledge”
▪ Correspondence of solution output with real
clinical situations
▪ The ability to inhabit a real clinical work-flow
“invisibly”
After researching different technologies that
potentially meet these criteria, the following
combination of processes was put together as a
framework:
▪ The classification of events in physiological
output known as EUSIG events (Edinburgh
University Secondary Insult Grade) (Jones et al.
1994), and compilation of an event log from this
▪ The expression of those event logs as process
models
▪ The extraction of clinical guideline texts into
process models
▪ The comparison of two process models using
complex similarity/distance algorithms
Together, these processes form the framework
through which the possibility of quantitative, real-
time guideline adherence monitoring can be
explored. Figure 1 shows a high-level schematic of
the framework steps to convert ICU data and
guideline text into comparable data-sets.
Examining these processes in more detail, event
detection and representation are common methods of
data analysis in medicine.
Figure 1: High-level schematic of guideline adherence
system design.
The classification of pressure events using
EUSIG parameters has a well-established precedent,
particularly in the field of TBI (Jones et al. 1994).
The central idea behind this step is that an event can
be classified as having several EUSIG “parameters”
– e.g. event hold-down, threshold, duration – then
this pattern is searched for in the physiological data.
Once an event is found, a time-window is laid over it
and clinical treatment events are searched for (figure
2 shows a schematic of a EUSIG event pattern). The
full detail of the conversion of the data-sets used in
this work from raw physiological and treatment
output to their corresponding event logs can be
found in (Stell et al. 2014).
Figure 2: Event definition for a given time-series
physiological output (in this case ICP). A threshold
crossed for a specific period (the hold-down) indicates that
an event has started. Clear hold-down indicates that the
event has finished. Also shown are a treatment at a
specific time-point and a time window overlaid for
association of that treatment with the event.
The other components of the framework concern
the use of process models, which are a construct
borrowed from the field of business process
management – most commonly used to describe
Automated Measurement of Adherence to Traumatic Brain Injury (TBI) Guidelines using Neurological ICU Data
137

real-world problems of project management and
corporate efficiency. There have been projects where
process models have been applied to medical
problems, but these appear to mainly concern the
administration and logistics of hospitals and other
large-scale corporate structures (where the fact that
these structures are medical in nature is largely
incidental).
Similar in nature to flow-charts, a process model
is a directed or undirected graph with a collection of
edges and nodes. They can be expressed using
various notations, each with slightly different
characteristics - e.g. UML (www.uml.org) or BPMN
(Chinosi & Trombetta 2012). Depending on the
notation used, the edges and nodes represent various
actions and states that can be generalised to the
specific context being described (in this case, the
medical output observed from a neurological ICU
bedside machine).
The translation to a process model in this work
comes from two sources: evaluation of an event log
for the physiological/treatment data and the
evaluation of semantic text from the guideline. This
latter source is a manual step in this work, and is
similar to the work of “semantic web”
interpretations of medical text information (Kaiser &
Miksch 2009). Comparison of the two resulting
process models builds on the work conducted in
(Dijkman et al. 2009), with the notions of similarity
encapsulated by the similarity of individual nodes
and edges combined with relevant weighting to
represent the significance of certain aspects.
To apply these business process analysis tools –
expression of medical output as process models and
the use of comparison and distance calculations in
this context – in this particular way are believed to
be a unique feature of this work.
3 RELATED LITERATURE
A review of related literature covers several areas:
issues of adherence to clinical guidelines in general
and specifically in the TBI domain, novel attempts
to improve adherence, and the relevance and utility
of the chosen technology.
3.1 Clinical/TBI Guideline Adherence
Issues of communication appear as a common thread
when evaluating adherence to clinical guidelines.
(Ansari et al. 2003) looked at beta-blocker use in
heart failure and showed various methods and
channels of disseminating the guideline information.
These were to use a nurse facilitator (direct
intervention by trained specialist), general education
(documents, leaflets, etc) and clinical reminders
(automated interventions). These all had different
effects on adherence, with the nurse facilitator being
the most successful. (Rood et al. 2005) indicated that
a study of glucose measurement and regulation
improves greatly when dissemination is provided
through computer-assisted means rather than
through paper-based means.
A systematic review of guideline dissemination
strategies (Prior et al. 2008) showed that the (non-)
effectiveness of passive dissemination is a
significant result. Similar to the (Ansari et al. 2003)
study, where direct intervention is taken by a person
or automated method, the adherence rate is markedly
better than if the guideline document and
information is published passively (e.g. using
conferences, websites or didactic lectures).
Other studies (Grol 2016) similarly show that
targeted and behaviourally “disruptive” methods are
best for disseminating information and influencing
clinical practice. Therefore, understanding the
effectiveness of these different methods of
dissemination is an important factor in developing
tools to improve awareness and therefore adherence.
When considering TBI specifically, the gold
standard in guidelines is the 1994 Brain Trauma
Foundation (BTF) initiative to formulate treatments
for brain injury, which have since become
standardised, internationally-recognised guidelines
(Bullock et al. 1996). Several studies have been
conducted that show dropping mortality rates and
improved long-term outcomes since the adoption
and spread of use of these guidelines (Bratton &
Chestnut 2006). In the last decade, this improvement
in TBI management has continued, leading to
studies indicating that overall improvements in
outcome due to adherence to the BTF guidelines
have also been apparent (Tarapore et al. 2016) and
in similar studies conducted four years apart (Ghajar
2000) and (Fakhry et al. 2004).
However, significantly, adherence to the BTF
guidelines is not universal – many studies outline
their potential deficiency in various aspects such as
hypothermia (Clifton et al. 2001) and the need for
ICP monitoring (Chesnut et al. 2012).
3.2 Novel Attempts to Improve
Adherence
Evident from this discussion is the fact that
guideline adherence is subject to great variation.
There are many reasons for non-adherence, but these
HEALTHINF 2018 - 11th International Conference on Health Informatics
138

can be broken down into two broad categories: being
unwilling to adhere to a guideline and being unable
to adhere. Whilst techniques to address the first
category include improved dissemination,
communication and various long-term social
methods, improvements in the second category,
which is usually functional in nature (e.g. lack of
resources/time), can be approached using
“behaviourally disruptive” methods.
Most attempts to improve adherence to
guidelines in the medical domain involve a direct
change or implementation of a care procedure. In
these cases, the evidence-base for a guideline comes
from a panel of experts in the field that have reached
a point of consensus for various treatments. The
novel attempts then concern the implementation of
that guideline in patient care in a standardised and
accountable way.
A campaign that exemplifies this approach is
“Surviving sepsis”, which has looked at targeted
improvement of patient care by specifically
supporting guideline adherence through the
identification of resuscitation and management
“bundles”. Part of this was an intensive data
collection arm, which – in real-time – forced
clinicians to systematically add data as part of
clinical routine (Levy et al. 2010). The results of this
have shown a marked improvement in adherence to
the guidelines, but an emergent complication was
the ability to stay current with the latest guidelines
and update procedures to reflect this. Feedback from
the first four years of this project back into the re-
development and improvement of sepsis guidelines
has been cautiously optimistic (Dellinger et al.
2013). Whilst not specifically providing a new type
of analysis it does provide a large canon of data for a
specific condition that is potentially useful for future
studies into sepsis as well (Lehman et al. 2011).
A study looking at the ability to change
behaviour where possible when implementing
guidelines (Grol & Grimshaw 2003), has shown that
only comprehensive interventions on all levels of
input and with specific targets and barriers identified
stand a chance of influencing behaviour. Several
categories were identified: educational strategies,
audit and feedback, use of reminders/computers,
substitution of tasks, multi-professional
collaboration, mass media campaigns, total quality
management, financial incentives, patient-mediated
interventions, and a combination of all of these
interventions. This was a broader conclusion than
that reached by (Ansari et al. 2003) on a similar
study (which described active rather than passive
interventions being more effective).
Improvements in mobile technology have also
further advanced the ability to implement guideline
adherence, as the proximity to the end user (be they
patient or clinician) allows immediate and real-time
intervention or consultation. Examples of patient
interventions include the development of the
MobiGuide project (Shalom et al. 2015), and other
quality of life applications that allow quick reference
in the form of either notifications (e.g. a message to
a patient to take their medication) or input (e.g. a
daily symptom diary that a patient can fill in) which
allows the direct consequences of adherence or non-
adherence to be measured. An example of adherence
improvement tools directed at clinicians include the
development of the SIGN apps
(www.sign.ac.uk/sign-apps.html), which provide
immediate triage information across many
emergency fields, allowing doctors to quickly
consult their actions with regard to the official
guidelines in this field.
3.3 Framework Technology
It can be seen that many novel technologies exist,
but for the purposes of choosing an applicable
technology to address the particular challenges in
this work, many of the characteristics appear to be
well represented by processes and work-flows, and
hence the slightly wider speciality of process
models.
(Perimal-lewis et al. 2012) claims that the
fundamental element required for the construction of
a process model is the historical event log of a
process, and this lends itself to the description of
actions and reactions in a medical context. This
research area is referred to “process mining” and is
usually applied to the logistical higher-level patient
care work-flows within a hospital. Studies, such as
(Mans & Schonenberg 2009), investigate the
different management processes using various
process mining views on control-flow structures, and
how these affect organisation and performance
within a hospital.
This area is also related to the more general
domain of business process management (BPM) not
usually realized as medical processes, but critical in
the use of event/reaction flow-diagrams to formally
describe processes that occur within complex
organisations. An example of this is (Werf et al.
2012), which looks at tools to automate the
compliance of an business to specific guidelines,
typically referred to as “audit”. The idea behind this
work is to develop an awareness of the context of a
process, which can often impact the perceived
Automated Measurement of Adherence to Traumatic Brain Injury (TBI) Guidelines using Neurological ICU Data
139

compliance to a guideline, without being sufficiently
accounted for in the evaluation. Work such as this
however, does tend to exist in abstract discussions,
and rarely gets implemented in a real hospital
setting.
There is also a discrepancy between the level of
pattern extraction and the focus on the level of
patterns. The process mining work referred to above
nearly always focuses on the clinician behaviour as
part of a corporate body, with a view to improving
those corporate processes such as (Perimal-lewis et
al. 2012). At a lower “micro” level, pattern
extraction science focuses on mathematical
techniques to detect individual events (again, similar
to and possibly driven by signal processing). The
connection between these two levels, which is where
the work proposed in this document is focused, is
rare, though it does exist. (Huang et al. 2012) looks
at the “clinical pathway” area, where a clinical event
log is analysed and common remedial medical
behaviours are extracted. The work was validated by
clinical experts as a true representation of some of
their behaviours, but it did conclude that the general
nature of the conclusions, meant that more specific
work was required, and that some critical behaviours
were missed.
This is where the focus on a specific condition
helps in identifying processes more exactly and in a
way that is immediately useful to clinicians working
in the ICU.
4 SYSTEM ARCHITECTURE
The highest level schematic of the proposed
technical solution in this work can be seen in figure
1 (section 2.2). This shows the broadest steps to
achieve a measure of guideline adherence:
1. Convert the raw physiological and treatment
data into an event log
2. Convert the event log into a process model
3. Convert the text guidelines into a similarly
structured process model
4. Compare the two and calculate the distance
between them (this is the measure of non-
compliance, the inverse of which is adherence,
the overall goal)
The architectural and design details are now
expanded upon in this section.
4.1 Process Model from
Physio/Treatment Data
The conversion of the physiological and treatment
data into a set of event logs has been conducted
using the EUSIG event parameter definitions. As
mentioned in section 2.2, the major detail of this
work for one of the data-sets used here can be found
in (Stell et al. 2014).
In summary, the work was an audit of pressure
events (specifically ICP and CPP) through-out the
Brain-IT data-set (Piper et al. 2010) (see section 5
for a summary description of this data), using pattern
matching techniques where the EUSIG definition of
ICP or CPP event was the target pattern within the
data-set (for all pattern definitions the structure was
the same – see figure 2 – but the parameter values,
such as threshold and hold-down time were varied).
Figure 3: E-R diagram of the standardised interface – the
“treatment profile” database – for compiling physiological
and treatment data from ICU data-sets, ready for
conversion to logical event logs.
The overall results of this conversion work
outlined some interesting clinical results, such as the
verification of an “unofficial” event threshold of 15
mmHg when clinicians feel they must intervene to
manage an escalating ICP (also known as an
intracranial hypertensive episode). But the practical
data output was a generalised accumulation of
information about ICP and CPP events, alongside
treatment information.
After this audit work had been concluded, the
next logical step was realised in storing this data
representation in a standardised interface, so that
future data-sets could be compared in a similar way.
Currently this standardised interface is implemented
in a MySQL database (known as the “treatment
HEALTHINF 2018 - 11th International Conference on Health Informatics
140
profile” database), the entity-relationship diagram
(and hence schema) can be seen in figure 3.
From this “treatment profile” database, a logical
representation of an event log can be drawn, which
will then be converted into a process model. (Note:
when considering the definition of an “event” in the
terms supporting the development of a process
model, the log actually encompasses both the
pressure events and the application of treatments).
The implementation of the process models
involved at this stage can be considered as a set of
elements indicating an “event” taken at any one time
(the most useful temporal measure deemed to be
minute-by-minute). So using a combination of the
event, any treatments falling within the time
window, a “guideline object” is created that
indicates what those elements are at a given minute
due to the actual actions that have occurred in the
ICU. In the next section a similar set of objects are
constructed, which form the ideal actions that would
have occurred if the guidelines had been followed
exactly.
4.2 Process Model from Guidelines
The conversion of BTF guidelines to a process
model requires more manual interpretation and
implementation than the conversion from the ICU
data. Some semantic processing technologies were
considered to achieve this, but were considered
unnecessary once the specific guidelines were listed,
as the conversion process turned out to be relatively
simple. There are 15 severe traumatic brain injury
guidelines (for severe in-hospital treatment)
covering various types of injury and treatment
(www.tbiguidelines.org). Of these, the four that
were specifically looked at (due to their relevance to
the management of ICP and CPP) were:
▪ #1 – Blood pressure and oxygenation
▪ #2 – Hyperosmolar therapy
▪ #8 – Intracranial pressure thresholds
▪ #9 – Cerebral perfusion thresholds
An example of text that required translation was
guideline #9 which had several conditions relating to
the threshold of CPP where treatment must be
applied, dependent on the presence (or not) of
cerebral autoregulation (the feedback mechanism
that protects the brain for a limited time when blood
flow is impaired). The guideline text reads:
▪ “Aggressive attempts to maintain cerebral
perfusion pressure (CPP) above 70 mm Hg with
fluids and pressors should be avoided because
of the risk of adult respiratory distress
syndrome (ARDS)”
▪ “CPP of <50 mm Hg should be avoided”
▪ “The CPP value to target lies within the range
of 50-70 mm Hg. Patients with intact pressure
autoregulation tolerate higher CPP values”
▪ “Ancillary monitoring of cerebral parameters
that include blood flow, oxygenation, or
metabolism facilitates CPP management”
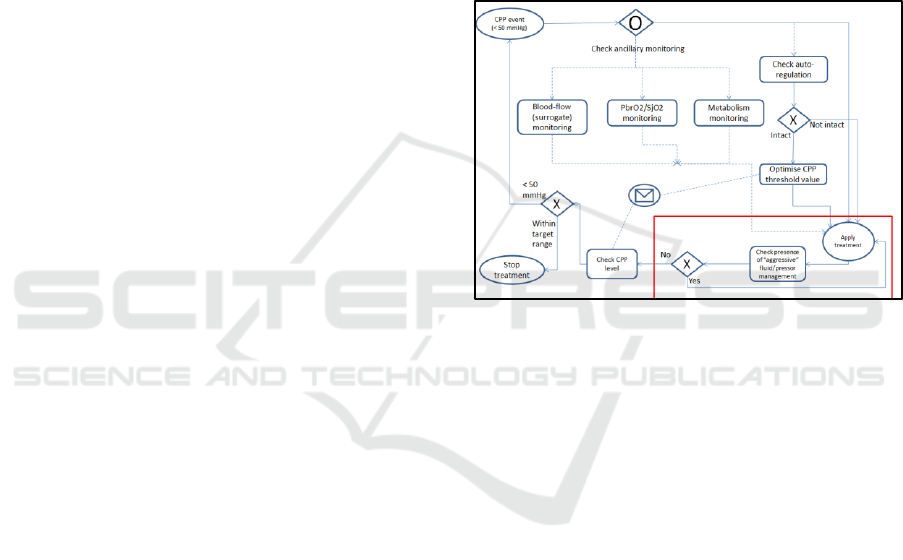
When converting this to a process model, the
model was chosen to be expressed in business
process model notation (BPMN). Figure 4 shows
how these text bullet points translate to this notation.
Figure 4: BPMN chart showing the representation of the
CPP guideline (BTF #9).
Similar BPMN diagrams were compiled for the
other guidelines (#9 being the most complex) and
then related to the process model drawn from the
raw ICU data.
In terms of how the information from the
physio/treatment stream relates to this example, the
most important information captured is the presence
of a threshold-crossing in the CPP read-out. This
indicates the beginning of a CPP pressure event and
the start of the cycle denoted in figure 4. Ancillary
monitoring and autoregulation status are stored in
other clinical monitoring parameters, with the
treatment applied stored in the treatment profile
database. The treatment profile database is searched
for this combination of event and treatment. The red
box in figure 4 denotes a detail about the type of
treatment: if the patient is highly loaded with
pressors already then a water treatment is mandated,
as well as vice versa. Therefore the process model
checks for the type as well as the presence of a
treatment.
The process models are therefore compiled by
listing the relevant nodes and graphs (e.g. treatment
presence, type, and response time and their sequence
Automated Measurement of Adherence to Traumatic Brain Injury (TBI) Guidelines using Neurological ICU Data
141

in time in relation to each other). To re-state again:
one is generated for the actual timeline from the
treatment profiles database, which is a model
representing what happened in the ICU. And the
other – drawn from the guideline - represents the
ideal timeline and shows what the ideal clinical
response would have been given the context of
events, patient situation, etc.
4.3 Similarity Calculations
These two process models can now be compared,
and the distance calculation chosen builds on the
work conducted by (Dijkman et al. 2009). In this
paper a distance between two business process
models is calculated using several different
algorithms and representations of the models
themselves. The fundamental calculation presented
comes down to a weighting attached to the different
nodes and edges, then a calculation of how many
transitions the first model needs to make in order to
reach the same state as the second model. The
different distances calculated include string-edit
distance (nodes only) and graph-edit distance (nodes
and edges). The distances between the process
models presented are calculated using four different
algorithms, each with different characteristics that
trade-off between completeness and efficiency:
“Greedy”, ”A-star”, ”Process heuristic”,
“Exhaustive”. The conclusion of the paper is that the
“Greedy” algorithm (searching for local optima) and
“A-star” (a well-known shortest distance algorithm)
were the best performing in terms of speed versus
acceptable completeness (“A-star” being slightly
slower but more accurate).
To build on and apply these methods to the
guideline adherence work in this paper, the simplest
methods were initially chosen, corresponding to the
“string-edit distance” used in (Dijkman et al. 2009).
These include two algorithms which have a simple
direct comparison with no weighting added to the
nodes (“Direct”) and one with node-weighting added
(“Weighted”).
4.4 Clinical Result Presentation
Using these distance calculations, the final number
of adherence is generated. They are presented in two
categories: level of non-adherence (expressed as a
percentage) and the duration of these levels of non-
adherence (in minutes). However, to apply real
clinical relevance to these numbers, the factors must
be considered in combination. Figure 5 shows a
square with four quadrants indicating severity when
considering non-adherence level against duration,
similar to those used for risk analysis. In the bottom
left quadrant, we have deviations that are of a low
level for a short time (the least significant clinical
scenario). In the top right, are deviations that are of a
high level for a long time (the highest significance).
The opposing quadrants indicate a mid-range of
significance. Therefore two combinatorial metrics
indicate approximately where on this quadrant the
output sits:
▪ Duration / Non-adherence (A)
▪ Duration * Non-adherence (B)
The clinical analogue of these combinations is
that if A is very high or very low, the severity
occupies either of the two mid-range quadrants. If A
tends to 1, then it is either in the least or most
significant quadrants. To ascertain which of these
latter quadrants the output occupies, B indicates
either high (most significant) or low (least
significant). Testing where the thresholds of these
limits occur will be follow-up work (see discussion
section).
Figure 5: Quadrants of severity that provide a clinical
interpretation of the non-adherence and duration numbers.
5 RESULTS
The results in this section show the adherence output
when the system is run against a real neurological
ICU data-set. The data-set is the Brain-IT database
(Piper, Chambers, Citerio, Enblad, Gregson,
Howells, Kiening, Mattern, Nilsson & Ragauskas
2010): a compilation of 262 brain-injured patients
collected over a period of three years from 2003-
2006, across 22 specialist neurological ICU centres
in Europe.
HEALTHINF 2018 - 11th International Conference on Health Informatics
142

Output corresponding to the two clinically-
relevant categories is shown: non-adherence
measurements on a minute-by-minute basis over
single pressure events and aggregate information
about non-adherence and duration over all pressure
events occurring in individual patient stays.
The relative weightings used for non-adherence
factors are: 0.25 for repeat pattern treatment non-
adherence, 0.5 for a type non-adherence and 1.0 for
treatment outside the time window.
5.1 Minute-by-minute
The clinical analogue to measuring adherence on a
minute-by-minute basis would be that of a real-time
monitor, allowing a clinician to know immediately
where the patient’s clinical context lies in relation to
the official guideline. In the framework built for this
work an example of this output is shown in figure 6.
Figure 6: Minute-by-minute read-out of guideline
adherence for a single pressure event on one patient using
the direct algorithm.
In this example the time-window of response
mandated by the guideline is 15 minutes as an
acceptable clinical response time. In figure 6 the
blue line indicates the trace of physiological series
(in this case mean ICP), with flags indicating
treatments administered by the clinician during the
course of the event. The red line indicates the non-
adherence level at that immediate minute. It can be
seen that two non-adherence values dominate the red
line: 25% and 50%. The total output for this patient
– all events, therefore more than the single event
shown in figure 6 – is shown in tables 1 and 2
(corresponding to the use of the direct and weighted
algorithms respectively).
Table 1: Total duration and non-adherence levels for
patient 15026161, along with qualitative reasons for non-
adherence (“direct”).
Total
duration
(mins)
Non-
adherence
(%)
Reason(s)
42
25.0
- Treatment should be
part of repeat pattern
708
50.0
- Treatment not
administered within
time window
- Treatment should be
part of repeat pattern
In both tables, the reasons that make up these
non-adherence values are two-fold: “Treatment
should be part of a repeat pattern” and “Treatment
not administered within time window”. The
difference between the two tables relates entirely to
the numbers resulting from the different scales
assigned to each reason. Therefore with a factor 0.25
assigned to the repeat pattern treatment, the levels of
non-adherence skew in either direction (the lower
number decreases significantly from 25% to 6.25%,
whilst the higher number increases slightly from
50% to 56.25%). To develop this as a useful clinical
tool, would require a survey of domain experts to
find a common consensus on what weighting values
should be attached to each reason. Or expressed
another way: how important is each reason in
relation to each other?
Table 2: Total duration and non-adherence levels for
patient 15026161, with qualitative reasons for non-
adherence (“weighted”).
Total
duration
(mins)
Non-
adherence
(%)
Reason(s)
42
6.25
- Treatment should be
part of repeat pattern
708
56.25
- Treatment not
administered within
time window
- Treatment should be
part of repeat pattern
Also notable between tables 1 and 2 is that the
structural information output remains unchanged
(the duration size and the number/nature of the non-
adherence reasons). This intuitively makes sense as
the only difference between the two algorithms is
one of scale due to the differently weighted factors.
As the work develops to include distance
calculations between edge directions as well as node
Automated Measurement of Adherence to Traumatic Brain Injury (TBI) Guidelines using Neurological ICU Data
143

size, it is anticipated that there may be structural
differences to evaluate (see discussion section).
Table 3: Total duration and non-adherence levels for
patient 26138384, with qualitative reasons for non-
adherence (“weighted”) including contraindication due to
treatment type.
Total
duration
(mins)
Non-
adherence
(%)
Reason(s)
17
18.75
- Treatment type
contraindicates in
patient context
- Treatment should be
part of repeat pattern
483
56.25
- Treatment not
administered within
time window
- Treatment should be
part of repeat pattern
Table 3 shows another patient that has similar
non-adherence levels due to the dominant factors of
treatments outside of the time window and repeat
patterns. However, there is an additional factor of
“treatment type contraindicates in patient context”,
which adds a different number to the deviation
amount (in this case 18.75%, as treatment type has a
weighting of 0.5). This has come about as the patient
has been administered steroids when the load is
already high, which is an aspect that this guideline
(#9) mandates against.
5.2 Single Patient Stay
The second category to consider is the non-
adherence levels over an entire patient stay. The
clinical utility of this is to gain an understanding of
how non-adherence relates to the management of
individual pressure events given a patient’s clinical
context. To this end aggregated output is compiled
for the individual patients. Total information for
patients 15026161 and 26138384 are already shown
in tables 1, 2 and 3 but more detailed statistics on the
non-adherence and duration for each patient (using
the “weighted” algorithm) are shown in tables 4 and
5. For each of these patients, an inter-quartile range
is calculated to understand the range and spread of
the data. An obvious point of interest from the non-
adherence level is how much the non-adherence
level skews towards the maximum level of 56.25%
Table 4: Spread and central tendency calculations for non-
adherence level, duration, duration/non-adherence (A),
and duration * non-adherence (B) using the “weighted”
algorithm for patient 15026161.
The clinical interpretation of these results is
potentially broad, but a first step is to check the
mean values against the quadrants outlined in figure
5. For patient 15026161, the duration/non-adherence
(A) is 4.63 and the duration * non-adherence (B) is
10014.06. Assuming both of these figures to be
considered “large” – which in the case of A means
that the ratio is significantly higher than 1 – would
put the overall impact of these deviations into the
mid-range quadrant close to the border of “most
significant”. When looking at the detailed output of
individual deviations, this could be interpreted as the
analogue of many “small” deviations (due to the
non-administration of treatments in timely manner)
adding up to a significant impact on management of
ICP events. Table 5 shows a similar table for the
patient 26138384, where the mean value of (A) is
significantly lower than a ratio of 1 and the mean
value is an order of magnitude lower than 15026161
therefore the relative non-adherence potentially
indicates a lower impact.
Table 5: Spread and central tendency calculations for non-
adherence level, duration, duration/non-adherence (A),
and duration * non-adherence (B) using the “weighted”
algorithm for patient 26138384.
6 DISCUSSION
The output of the spread and central tendency
information in the interquartile range tables (4 and
5) indicate the dominance of a particular set of non-
adherence reasons (“treatment not administered
within time window” and “treatment not part of
repeat pattern”). This is very likely due to the low
annotation level of this data-set, which in turn is
linked to the age of the data-set (itself a pioneering
effort in neurological ICU data collection at the turn
of the millennium). The next step in this research is
to run the same validation test over several more
HEALTHINF 2018 - 11th International Conference on Health Informatics
144

modern data-sets, three of which have been
identified and will be available for further work very
shortly (the CSO project data for the identification
of artefactual data in neurological ICUs, the ICCA
system data from the Queen Elizabeth University
Hospital ICU, Glasgow, and MIMIC III (Saeed
2007)). These are similarly representative of
different aspects of the neurological ICU – CSO
indicates a physical check on treatment information
supplied by computer (an observer notes whether a
treatment was actually delivered at the time the
computer indicates), ICCA is one of the latest
software frameworks in neurological ICUs, and
MIMIC III is a compilation of data from 2008 to
2013 on non-specialist ICU information from around
the USA. Not only will the output of using these
data-sets provide further valuable information on the
validity of the approach in this paper, but will
provide accuracy checks of different steps along the
process of compilation.
Similarly, a consensus check against domain
experts will be performed in order to match the
output from this work against what is considered
“typical” reactions in a neurological ICU. From this
comparison, it would be hoped that the notion of
scaling of the weighted nodes would give an
indication of how important the different clinical
factors are and how this affects the quantitative
output when combined with other factors. An
indication of the thresholds on figure 5 indicating
the difference between different regions of severity
could be ascertained through a similar process. An
interesting study would be a real-time output of a
clinician (e.g. recording a verbal commentary of
actions taken as they are occurring) to compare
against the evaluation occurring in the work.
However the difficulties of achieving enough data
beyond a small sample for this type of study – due to
privacy and ethical concerns – may be too
challenging.
Another strand that will be expanded on shortly
will be the usage of the more sophisticated distance
comparison algorithms posited by (Dijkman et al.
2009). It is assumed that structural distance
calculations – “graph-edit similarity” in the language
of that work – will affect the structural output of the
non-adherence and duration, which would be visible
in the results for a single patient run over several
different algorithms. The statistical significance of
this difference will be calculated then verified
against the experience of domain experts.
Finally, whilst the output can guide real-time
immediate clinical reaction, and give information on
pressure event management, it is hoped that with the
same metrics taken over all patients in all data-sets,
and linked to clinical outcome, the quantitative
measures of non-adherence could inform studies that
contribute to official guideline development. This
work is currently underway and makes use of the
(highly unusual) aspect of the Brain-IT data-set
capturing patient outcome, measured using the
Glasgow Outcome Scale, at 6-months post-injury.
7 CONCLUSIONS
Presented in this work are the preliminary results
from an automated system constructed to use data
that is currently available in many high-dependency
neurological ICUs. The central framework uses
simple process model technology to interpret data
from two sources (bedside physio/treatment data and
text guidelines) and use these to compare and add
quantitative value. The output presents information
in a variety of ways to gain detailed insight into the
duration and nature of non-adherence to mandated
guidelines that has the potential to aid immediate
real-time clinical response, as well as aggregated
study information to provide feedback on pressure
event management.
ACKNOWLEDGEMENTS
The authors would like to acknowledge the work of
the Brain-IT group investigators and participating
centres to the Brain-IT data-set without whom this
work could not have been conducted.
REFERENCES
Ansari, M. et al., 2003. Improving guideline adherence: a
randomized trial evaluating strategies to increase beta-
blocker use in heart failure. Circulation, 107(22),
pp.2799–804.
Bratton, S. & Chestnut, R., 2006. Guidelines for the
management of severe traumatic brain injury. XII.
Nutrition. Journal of …, (212).
Bullock, R., Chesnut, R. & Clifton, G., 1996. Guidelines
for the management of severe head injury. European
Journal of ….
Chesnut, R.M. et al., 2012. A trial of intracranial-pressure
monitoring in traumatic brain injury. The New
England journal of medicine, 367(26), pp.2471–81.
Chinosi, M. & Trombetta, A., 2012. BPMN: An
introduction to the standard. Computer Standards and
Interfaces, 34(1), pp.124–134.
Automated Measurement of Adherence to Traumatic Brain Injury (TBI) Guidelines using Neurological ICU Data
145

Clifton, G.L. et al., 2001. Intercenter variance in clinical
trials of head trauma--experience of the National
Acute Brain Injury Study: Hypothermia. Journal of
neurosurgery, 95(5), pp.751–5.
Dawes, A.J. et al., 2016. Compliance With Evidence-
Based Guidelines and Interhospital Variation in
Mortality for Patients With Severe Traumatic Brain
Injury. , 90095(10), pp.965–972.
Dellinger, R.P. et al., 2013. Surviving sepsis campaign:
International guidelines for management of severe
sepsis and septic shock, 2012. Intensive Care
Medicine, 39(2), pp.165–228.
Dijkman, R., Dumas, M. & Garc, L., 2009. Graph
Matching Algorithms for Business Process Model
Similarity Search.
Fakhry, S.M. et al., 2004. Management of Brain-Injured
Patients by an Evidence-Based Medicine Protocol
Improves Outcomes and Decreases Hospital Charges.
The Journal of Trauma: Injury, Infection, and Critical
Care, 56(3), pp.492–500.
Ghajar, J., 2000. Traumatic brain injury. Lancet,
356(9233), pp.923–9.
Grol, R., 2016. Successes and Failures in the
Implementation of Evidence-Based Guidelines for
Clinical Practice. , 39(8).
Grol, R. & Grimshaw, J., 2003. From best evidence to best
practice: Effective implementation of change in
patients’ care. Lancet, 362(9391), pp.1225–1230.
Huang, Z., Lu, X. & Duan, H., 2012. On mining clinical
pathway patterns from medical behaviors. Artificial
intelligence in medicine, 56(1), pp.35–50.
Jones, P. a et al., 1994. Measuring the burden of secondary
insults in head-injured patients during intensive care.
Journal of neurosurgical anesthesiology, 6(1), pp.4–
14.
Kaiser, K. & Miksch, S., 2009. Versioning computer-
interpretable guidelines: semi-automatic modeling of
“Living Guidelines” using an information extraction
method. Artificial intelligence in medicine, 46(1),
pp.55–66.
Lee, J.C. et al., 2015. An analysis of Brain Trauma
Foundation traumatic brain injury guideline
compliance and patient outcome §. Injury, 46(5),
pp.854–858.
Lehman, L. et al., 2011. Multiparameter Intelligent
Monitoring in Intensive Care II (MIMIC-II): A public-
access intensive care unit database. , 39(February
2010), pp.952–960.
Levy, M.M. et al., 2010. The Surviving Sepsis Campaign:
results of an international guideline-based
performance improvement program targeting severe
sepsis. Intensive care medicine, 36(2), pp.222–31.
Mans, R. & Schonenberg, M., 2009. Application of
process mining in healthcare–a case study in a dutch
hospital. Biomedical Engineering …, pp.425–438.
Perimal-lewis, L. et al., 2012. Gaining Insight from Patient
Journey Data using Process-Oriented Analysis
Approach. , 129(Hikm).
Piper, I. et al., 2009. The brain monitoring with
information technology (BrainIT) collaborative
network: EC feasibility study results. Acta
Neurochirurgica, 102, pp.217–221.
Piper, I., Chambers, I., Citerio, G., Enblad, P., Gregson,
B., Howells, T., Kiening, K., Mattern, J., Nilsson, P. &
Ragauskas, A., 2010. The brain monitoring with
Information Technology (BrainIT) collaborative
network: EC feasibility study results and future
direction. Acta neurochirurgica, 152(11), pp.1859–
1871.
Piper, I., Chambers, I., Citerio, G., Enblad, P., Gregson,
B., Howells, T., Kiening, K., Mattern, J., Nilsson, P.,
Ragauskas, A., et al., 2010. The brain monitoring with
Information Technology (BrainIT) collaborative
network: EC feasibility study results and future
direction. Acta neurochirurgica, 152(11), pp.1859–71.
Prior, M., Guerin, M. & Grimmer-Somers, K., 2008. The
effectiveness of clinical guideline implementation
strategies - A synthesis of systematic review findings.
Journal of Evaluation in Clinical Practice, 14(5),
pp.888–897.
Rood, E. et al., 2005. Use of a computerized guideline for
glucose regulation in the intensive care unit improved
both guideline adherence and glucose regulation.
Journal of the American Medical Informatics
Association : JAMIA, 12(2), pp.172–80.
Saeed, M., 2007. Temporal Pattern Recognition in
Multiparameter ICU Data.
Shalom, E. et al., 2015. A multiple-scenario assessment of
the effect of a continuous-care, guideline-based
decision support system on clinicians’ compliance to
clinical guidelines. International Journal of Medical
Informatics, 84(4), pp.248–262.
STELL, A., MOSS, L. & Piper, I., 2014. Building an
Empirical Treatment Protocol from High-Resolution
Traumatic Brain Injury Data. , (Schteingart).
Tarapore, P.E. et al., 2016. Establishing a TBI Program of
Care – Benchmarking Outcomes after Institutional
Adoption of Evidence-based Guidelines. Journal of
Neurotrauma, 8, p.
Werf, J.M.E.M. Van Der, Verbeek, H.M.W. & Aalst,
W.M.P. Van Der, 2012. Context-Aware Compliance
Checking. , pp.98–113.
HEALTHINF 2018 - 11th International Conference on Health Informatics
146
