
The Role of Haptics in User Input for Simple 3D Interaction Tasks
An Analysis of Interaction Performance and User Experience
Mirjam Augstein
1
, Thomas Neumayr
2
, Stephan Vrecer
2
, Werner Kurschl
3
and Josef Altmann
1
1
Communication and Knowledge Media, University of Applied Sciences Upper Austria, Hagenberg, Austria
2
Research and Development, University of Applied Sciences Upper Austria, Hagenberg, Austria
3
Human-Centered Computing, University of Applied Sciences Upper Austria, Hagenberg, Austria
Keywords:
Haptic Interaction, Touchless Interaction, Comparative Study.
Abstract:
Traditionally, input devices allowed for at least a certain degree of haptic experience by involving direct phy-
sical contact between user and device. Recently, touchless interaction gained popularity through readily avai-
lable, cheap devices like the Leap motion controller or Microsoft Kinect. Usually, these devices support more
than two degrees of freedom and are thus especially suitable for interaction tasks in a three-dimensional space.
However, besides the high potential that lies within touchless input techniques, they also involve new challen-
ges (e.g., lack of borders and natural haptic guidance). In this paper, we aim at the identification of potentials
and limitations inherent to three different input techniques that involve a varying amount of haptics (i.e., tou-
chful, touchless and semi-touchless input). We present a study conducted with 25 users that focuses on simple
input tasks in a 3D interaction space and analyzes objective interaction performance metrics (e.g., regularity or
time) and subjective User Experience aspects (e.g., dependability or efficiency). It reveals parallels as well as
contrasts between the users’ actual interaction performance and perceived UX (e.g., several metrics suggested
haptic input to outperform touchless input while differences regarding UX were not significant). The results
are intended to inform other researchers when designing interactive environments.
1 INTRODUCTION
In the past decades, user input seemed to be cou-
pled with at least a certain haptic experience. The
most widely used input devices like mice, keybo-
ards, touch screens or game controllers have in com-
mon that they involve direct physical contact between
the user and the device. Touch-based or haptic in-
put techniques however often suffer from limited in-
teraction options through physical/technological con-
straints. For instance, most touchscreens only allow
for two-dimensional input because the physical de-
vice is a flat surface which makes movement along
the third axis mostly irrelevant (although this might
be up to changes since the advent of 3D touch capa-
bilities with the latest generations of smart phones).
Yet, these physical restrictions also provide a certain
amount of guidance and haptic input devices mostly
offer inherent haptic feedback mechanisms.
During the past few years, touchless input met-
hods and devices, e.g., Microsoft Kinect (further re-
ferred to as “Kinect”) or the Leap motion controller
(further referred to as “Leap”) that theoretically allow
for nearly unlimited input options (e.g., the human
hand theoretically has 27 degrees of freedom (Rehg
and Kanade, 1994)) became attractive, e.g., in game-
based scenarios that involve physical engagement like
sports applications or in therapeutic settings. Tou-
chless input surely offers high potential for a num-
ber of selected application fields where other input
approaches are difficult to apply (e.g., sports appli-
cations that involve whole body interaction). Howe-
ver, touchless input also bears potential shortcomings
that should be considered, e.g., connected to haptic
perception mentioned before or missing physical con-
straints that could provide orientation for the user du-
ring input. Although there are approaches to over-
come these risks (through haptic feedback for tou-
chless input scenarios, e.g., via focused ultrasound
(Carter et al., 2013)), most readily-available touchless
input devices do not yet support such mechanisms.
In this paper, we aim at investigating the actual
relevance of a haptic experience during user input.
This relevance might differ with varying complexity
of the input tasks. Here, we focus on simple input
tasks in a 3D interaction space. It presents a study
26
Augstein, M., Neumayr, T., Vrecer, S., Kurschl, W. and Altmann, J.
The Role of Haptics in User Input for Simple 3D Interaction Tasks - An Analysis of Interaction Performance and User Experience.
DOI: 10.5220/0006580500260037
In Proceedings of the 13th International Joint Conference on Computer Vision, Imaging and Computer Graphics Theory and Applications (VISIGRAPP 2018) - Volume 2: HUCAPP, pages
26-37
ISBN: 978-989-758-288-2
Copyright © 2018 by SCITEPRESS – Science and Technology Publications, Lda. All rights reserved

conducted with 25 participants to compare three input
techniques: i) touchless input, ii) “touchful” input (re-
lying on application of physical pressure to a surface),
and iii) semi-touchless input (combining characteris-
tics of the previous two). We use Leap as touchless in-
put device and two device prototypes (Augstein et al.,
2017a) that have been developed specifically to fit the
requirements of this and similar studies. The touchful
input device can be considered isometric, i.e., con-
necting the human limb and the device through force
(Zhai, 2008) while the other two can be considered
isotonic, i.e., connecting the interacting hand and the
device through movement (Zhai, 2008).
The study is targeted to analyze i) users’ inte-
raction performance and ii) User Experience (UX)
with each of the three input techniques. The main
aim behind is to study the actual relevance of haptics
during user input (and, secondarily, also the poten-
tials of isometric and isotonic input devices) for the
selected category of tasks. We believe that the com-
bined findings comprising objective criteria and sub-
jective ones are more conclusive than any of the two
in isolation. A good interaction performance does
not necessarily have to imply a good UX and vice
versa (which is confirmed by the results of our study
where we identified contradictions between perfor-
mance and UX). In our study we introduce so-called
interaction tests the users have to take. Based on the
raw input data we compute metrics indicative of in-
teraction performance (e.g., time or interaction regu-
larity). To measure UX, the standardized User Expe-
rience Questionnaire is used. We expect the results to
be interesting for researchers and practitioners con-
ceptualizing and designing interactive environments
or input devices.
2 RELATED WORK
This section presents grounding related work on 3D
input as well as studies comparing different input
techniques for 3D input tasks similar to ours by ana-
lyzing interaction performance and UX.
According to (Fr
¨
ohlich et al., 2006), 3D inte-
raction can be classified into i) navigation and travel,
ii) selection, iii) manipulation (e.g., of an object’s po-
sition) and iv) system control. We categorize the in-
teraction tasks described in this paper (see Section 4)
as manipulation tasks (specifically, positioning) and
selection tasks. Fr
¨
ohlich et al. divide devices and sen-
sors into isotonic (measuring movement), isometric
(measuring force) and elastic (allowing for movement
and providing a counterforce) sensors. (Zhai, 2008)
describe elastic input sensors as devices with varying
resistance “between the isometric (infinite resistance)
and the isotonic (zero or constant resistance)”. The
devices we use for our study can be considered iso-
metric (see “touchful input” in Section 3.2) and isoto-
nic (see touchless and semi-touchless input in Secti-
ons 3.1 and 3.3). (Bowman et al., 2008) argue that
many input devices are actually a combination of dif-
ferent types of input sensors which they refer to as
“multisensory input”. While we agree on the value of
multisensory input for practical use we explicitly tried
to avoid combinations in our study to be better able to
compare.
(Zhai, 2008) presents an exhaustive compilation
of studies comparing isometric and isotonic input de-
vices. However, he concludes that the literature on
the relative advantages and disadvantages of isome-
tric vs. isotonic devices has not been very conclusive
and argues that the definite answer may depend on
(among others) the concrete interaction tasks. Thus,
we carefully selected tasks for our study and assured
that they are identical for all three input devices.
(Bowman et al., 2008) also argue that haptics is
“one of the most important types of sensory feed-
back” and distinguish between “active haptic feed-
back” and “passive” or “pseudo-haptics”. Our tou-
chful input technique can be considered passive hap-
tic input, our touchless input technique intentionally
does not involve any haptic experience and our semi-
touchless input technique can be classed somewhere
in between (see Section 3). The comparison of in-
put techniques involving a differing amount of haptics
was our main focus. (Zhai, 2008) further distinguis-
hes between position control, i.e., “control mecha-
nisms by which the human operator controls object
positions directly” and rate control, i.e., mapping “hu-
man input into the velocity of the object movement”.
In our study, all three input techniques and interaction
tasks are based on position control.
Recently, (Tscharn et al., 2016) have evalua-
ted two isotonic input devices (Leap and the 3D
mouse SpaceNavigator) for real world navigation
tasks (using Google Earth). Their study partici-
pants were asked to solve four different interaction
tasks (general movement, targeted movement, spe-
cified coordinate movement and specified trajectory
movement). They evaluated navigation efficiency
(measured based on the time needed for a task) and
UX (based on the analysis of facial expressions and
the AttrakDiff questionnaire). Their approach is simi-
lar to ours regarding the idea of comparing touchless
and touch-able input devices along interaction perfor-
mance metrics and UX. Although it differs regarding
domain and UX indicators, some of the interaction
tasks and performance metrics are similar. Tscharn et
The Role of Haptics in User Input for Simple 3D Interaction Tasks - An Analysis of Interaction Performance and User Experience
27

al. found interaction with Leap to be less accurate for
complex tasks, compared to SpaceNavigator while it
had a good UX for simple tasks (which is in line with
our findings).
Another study on interaction performance and UX
related to touchless (using a ceiling-mounted gesture
recognition device prototype) and touch-able (using
SpaceNavigator) input has been conducted earlier by
(Stannus et al., 2011). They found that regarding in-
teraction performance and UX indicators as scored
by the participants (e.g., naturalness, strain, speed,
and accuracy), the touchless device could not keep
up with touch-able devices. Interestingly, similar to
our findings, for touchless input, UX-related metrics
(e.g., naturalness) were scored relatively better than
the pure performance indicators. Although study aims
were similar, the study design described by Stannus
et al. differs from ours drastically as we analyze ob-
jective interaction performance metrics automatically
while Stannus et al. asked the participants to rate these
metrics. We believe these “objective” results reported
by users subjectively might be easily biased by users’
UX-related impressions and are thus less reliable.
(Dangeti et al., 2016) discuss bare-hand in-air
gesture-based interaction vs. object-in-hand tangible
interaction for navigation of 3D objects. They pre-
sent the technological differences between the appro-
aches and announce a user study in which they plan
to compare three different interaction methods (tra-
ditional mouse/keyboard interaction, bare hand in-air
and object-in-hand interaction) along objective cri-
teria like interaction speed and accuracy and UX-
related aspects based on interviews. Thus, the plan-
ned methodology seems to be similar to ours, unfor-
tunately, they did not publish any results yet.
(Coelho and Verbeek, 2014) conducted a study
with a traditional mouse and Leap for pointing tasks
similar to ours in a 3D virtual environment. They des-
cribe two different tasks their participants had to per-
form. The first task consisted of simple pointing (start
point to target point) while the second task was more
complex (start point to first target point to second tar-
get point). For the simpler task, Leap outperformed
the mouse while for the more complex task, the out-
come was contrary. The authors state that the z-axis
can be controlled by the “roll of the mouse”, which
we assume to be the mouse wheel and can therefore
be manipulated isolated from the x- and y-axes. Our
assumption is that there is a major difference for 3D
pointing tasks when using Leap, where all axes are
controlled through the same mechanism (i.e., finger
or hand tracking). In our study, we tried to avoid such
general differences (not related to haptics) among the
input techniques. To measure usability (and UX),
Coelho and Verbeek used the System Usability Scale
(SUS) questionnaire where Leap scored better than
the mouse which is partly in line with our results.
(H
¨
urst and Helder, 2011) investigated navigation
and selection tasks in a 3D space using mobile de-
vices for moving around virtual objects. However,
while we varied the extent of haptics, H
¨
urst and Hel-
der varied the type of visualization. Thus, the results
are not directly related to our work but the study setup
is similar. They measured objective values from log
data and obtained information about UX.
Another similar approach was applied by (Atkins
et al., 2009) who compared three different interaction
techniques (i.e., mouse wheel, mouse dragging, and
a jog wheel) to navigate through a stack of medical
3D images, however the navigation itself was two-
dimensional. They also used interaction accuracy,
time, and navigation paths as objective measures and
qualitatively evaluated participants’ preferences.
Although we found several studies with aims si-
milar to ours, we did not find a comparison where
input activities with different devices have been alig-
ned in a way that the actual difference between set-
tings is the amount of haptics involved. Most stu-
dies compared Leap to a (3D) mouse, however, alt-
hough both isotonic, interaction with Leap inherently
differs from interaction with a mouse e.g., regarding
hand movement, interaction space and DoF. We ai-
med at comparing the input techniques using devices
that allow for almost identical input activities (with
the amount of haptics involved being the actual diffe-
rence). We expect the results to be better generaliza-
ble and more interesting for designers of interactive
environments.
3 INPUT TECHNIQUES
The three input techniques we used for our study have
several aspects in common. They all involve small
movements of the dominant hand in a 3D space and
are based on position control. The 3D manipulation
tasks used in the study (see Section 4) only require the
input devices to analyze the user’s hand position in a
predefined 3D space but allow for users to choose the
most comfortable hand orientation and posture. The
manipulation tasks require movement in the directi-
ons left/right, forward/backward and down/up, see Fi-
gure 1. The interaction space is identical for all set-
tings and the devices have been calibrated within pre-
tests (see Section 5). Differences (that are subject to
our study) can be seen in the amount of haptics invol-
ved. Further, our touchless and semi-touchless input
techniques and devices can be described as isotonic
HUCAPP 2018 - International Conference on Human Computer Interaction Theory and Applications
28
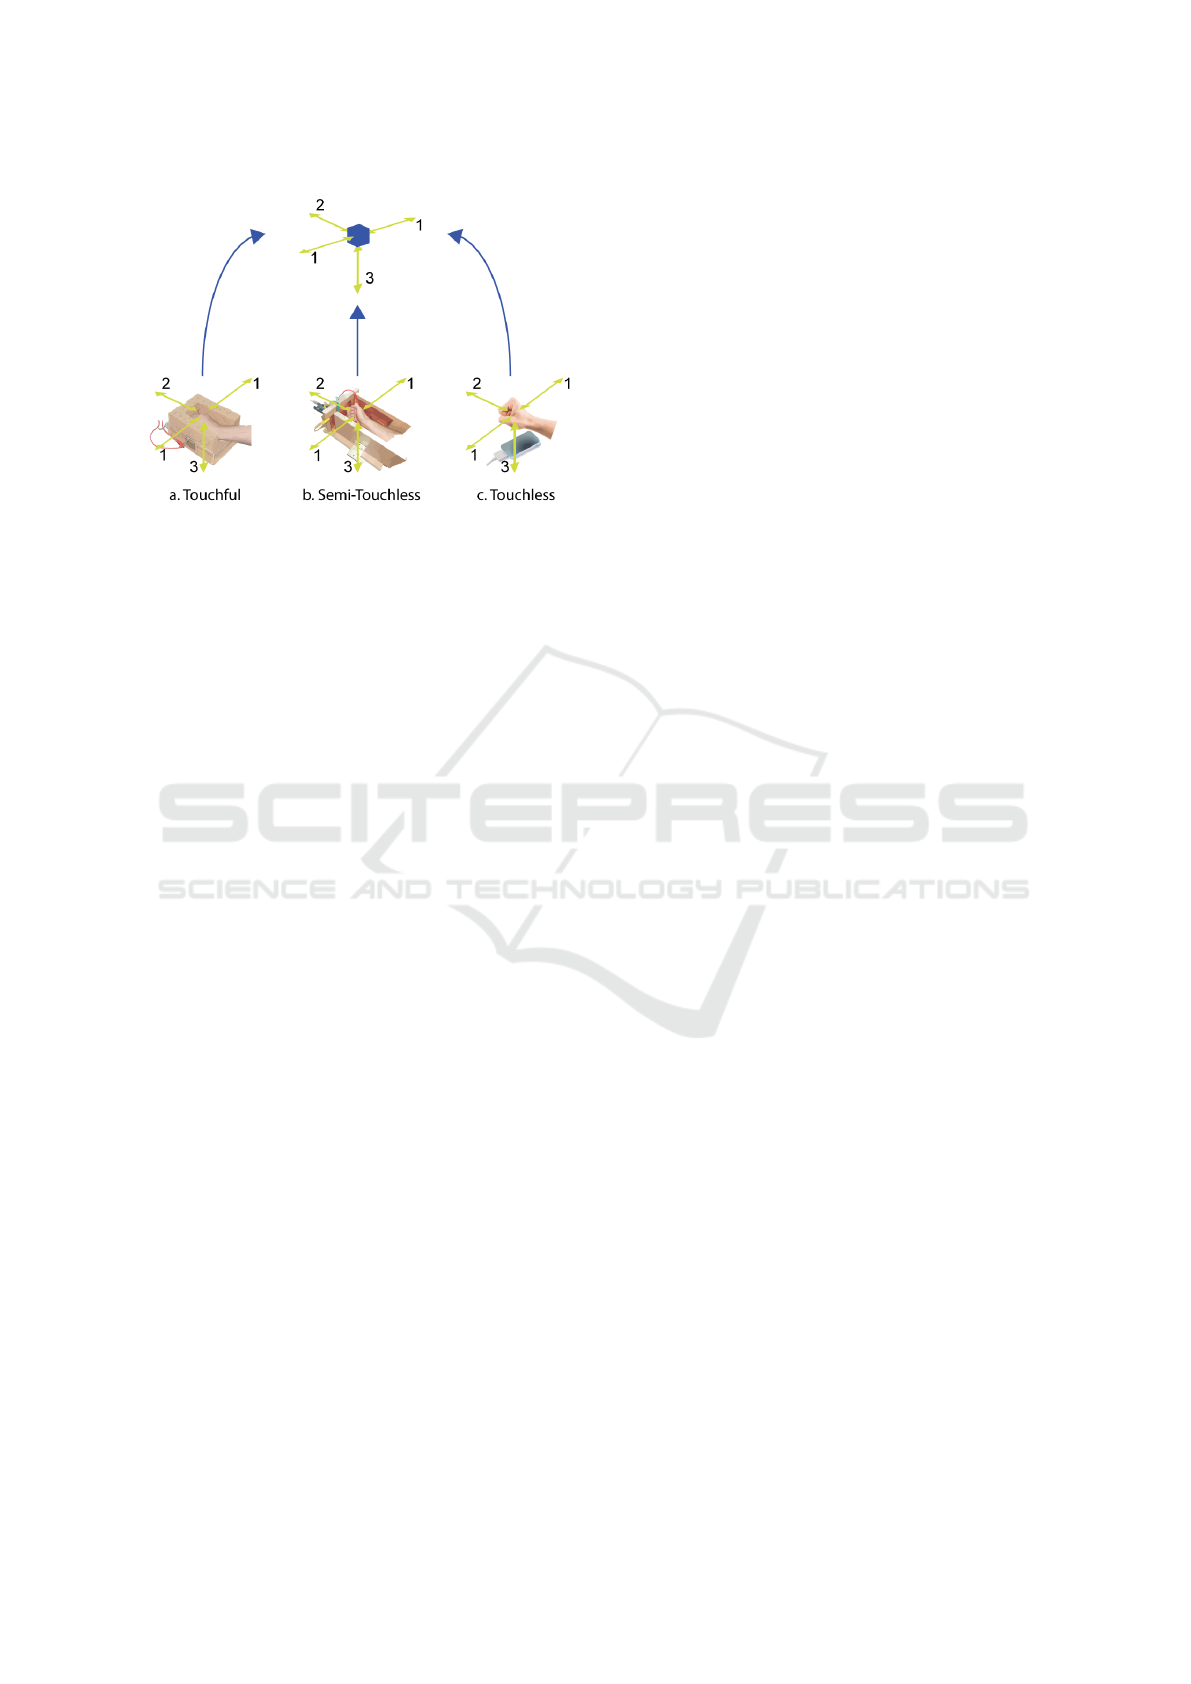
Figure 1: Input devices and techniques and the three DoF
as required by the manipulation tasks during the user study.
while touchful input is isometric.
3.1 Touchless Interaction
Touchless interaction is described as interaction that
“can take place without mechanical contact between
the human and any part of the artificial system” (de la
Barr
´
e et al., 2009). In many cases, a challenge rela-
ted to touchless input is the absence of direct haptic
guidance during the interaction which can also be the
cause of confusion or uncertainty regarding the space
sensitive to the user’s actions. Further, users are in-
formed about the effects of their actions only via the
system’s output (e.g., visually). This visual informa-
tion is present for the other two techniques as well,
for touchless input it is, however, the only source of
feedback. We implemented our touchless setting with
Leap which uses infrared sensors for measurement. It
has a size of 8x3x1cm and is usually placed on the
table in front of the user. In our study, it was used to
track the position of the wrist. Here, the user holds
his/her hand above the device (see Figure 1 (c)) and
moves it according to the tasks. The provision of a
hand rest was not possible as this would have i) inter-
fered with accurate tracking of the user’s hand and ii)
reduced the “touchless” impression for the users.
3.2 Touchful Interaction
We define touchful interaction as the opposite of tou-
chless interaction, i.e., interaction which involves tho-
rough mechanical contact between human and de-
vice. Thus, it generally includes the majority of the
most widely used input methods and devices such as
mice. Touchful interaction allows for a direct hap-
tic experience and can help the user to orientate and
correctly assess the interaction options and limitati-
ons (e.g., the physical resistance of a button indica-
tes that applying stronger pressure will make no dif-
ference). Yet, these generally helpful boundaries also
limit the interaction range. The concrete manifesta-
tion of touchful input used in our work can be descri-
bed as three-dimensional pressure-based interaction.
The technique aims to combine the advantages of 3D
interaction (as also enabled by touchless techniques)
and pressure-based interaction while reducing the re-
spective shortcomings. It ties in with previous appro-
aches to one-dimensional pressure-based interaction,
see (Augstein et al., 2015) and (Hwang et al., 2013).
This technique allows application of different pres-
sure intensities to a specified target area.
The device used for our study, “SpongeBox”
(Augstein et al., 2017a), extends this interaction
concept by adding several dimensions/directions:
left/right, forward/backward and down/up. Sponge-
Box has been developed specifically for purposes of
comparing touchful to touchless input techniques for
simple 3D manipulation tasks. It is based on an Ar-
duino microcontroller and several pressure sensors
and has the physical appearance of a box with open
upper and back walls. The inner walls are covered
with sponges. The user puts a hand in the middle
(see Figure 1 (a)) and can then press against four si-
des of the box (bottom, left, right, forward). The
material used for the walls provides a haptic expe-
rience and physical restriction. Placing the hand in-
side the box without actively applying pressure does
not lead to unintended input, thus a user’s arm can
rest on the sponge during and between interaction
activities. SpongeBox can theoretically distinguish
between 1024 pressure intensities in each direction
which were however reduced significantly during the
pre-tests (see Section 5). The configuration used for
the study measured and collected pressure intensities
on the percentage level (0-100%) but used only 13
levels to trigger activities (this was the configuration
perceived as most predictable and comfortable by the
pre-testers). As the interaction space was relatively
small, the movement of the digital object remained
smooth with this configuration.
3.3 Semi-Touchless Interaction
Semi-touchless interaction can be defined as a combi-
nation of the touchless and touchful interaction con-
cepts. It joins the following characteristics: i) phy-
sical constraints and ii) touchless position/movement
analysis. Again, input is done via small movements
of the interacting hand. The directions are equal to
those used for the other two techniques and physical
borders around the area sensitive to input are provi-
The Role of Haptics in User Input for Simple 3D Interaction Tasks - An Analysis of Interaction Performance and User Experience
29

ded. The input device used in our study is “Squa-
reSense” (Augstein et al., 2017a). Similar to Spon-
geBox, it has been developed specifically for purpo-
ses of comparing semi-touchless to touchless input
techniques for simple 3D manipulation tasks. It con-
sists of a box with highly sensitive capacitive side,
bottom and front walls the user can freely move the
hand within. The device can recognize touchless mo-
vements but also pressure intensities if the walls are
touched. Thus the device is isometric-isotonic gene-
rally, however, we did not use application of pressure
for the study described here as the devices were con-
figured in a way that the physical borders marked the
interactive area (which was also aligned to the digital
interaction space, see Section 5).
As with the touchful setting, the user’s arm can
rest on a sponge placed in the rear part of the box
which reduces the physical strain often involved with
touchless input. SquareSense is based on an Arduino
microcontroller and capacitive copper plates fixed to
the walls of the box. Similarly to SpongeBox, Squa-
reSense was configured in an iterative process during
the pre-tests and used an equal number of 13 distinct
proximity levels for each direction.
4 INTERACTION TESTS AND
PERFORMANCE METRICS
Our user study considers several objective metrics in-
dicative of interaction performance. These metrics
have been selected specifically to fit simple 3D mani-
pulation tasks. To be able to compute values for these
metrics, our users perform identical so-called “inte-
raction tests” with each input technique. We consider
the metrics to be interesting individually and do not
aim at computing an overall index of performance.
We thus utilize a user modeling framework (Augstein
et al., 2017b) which offers an infrastructure for de-
fining, maintaining and analyzing an arbitrary num-
ber of individual metrics. Each test (see the following
sections) requires the user to move a red cube (see
Figure 2) which acts as a cursor in a 3D space accor-
ding to a particular task. The devices were used for
absolute positioning of the cube in the digital space.
4.1 Reach and Regularity
The first test (and corresponding metric) is called Re-
ach. Here, the user has to move the red interactive
cube to the personal maximum comfortable position
in the directions left, right, forward and down (in
all cases starting from the same position in the cen-
ter of the interaction space). The metric Reach has
been selected because the mobility and strength of
a user’s dominant hand (which are decisive for the
values achieved for Reach) are highly individual and
could be significantly reduced for users with (tempo-
rary) motor impairments which again can strongly in-
fluence interaction performance. The test is similar to
the “straight navigation task” used by (Tscharn et al.,
2016) in their study on 3D map navigation.
At the touchful (isometric) setting, a user has
to apply the highest amount of pressure he/she can
(comfortably) achieve in all four directions to move
the cube in the respective direction. The maximum
values achieved for the four directions are stored as
ReachLeft, ReachRight, ReachDown, and ReachFor-
ward. At the (semi-)touchless (isotonic) settings, the
test requires a user to move the cube by moving the
hand. The values are stored in percent of the sy-
stem’s global maximum (the red cube cannot be mo-
ved out of the interaction space, if it has reached the
maximum position, the resulting Reach value is 100%
and the cube will stop there). The results could also
be used to individually adapt the ContinuousRegula-
rity test which was done within a similar study with
people with impairments where Reach was quite di-
verse.
Additionally, within the same test, the system ana-
lyzes deviations from the straight-most path between
initial and maximum position and uses it to compute
a Regularity metric (again, for all interaction directi-
ons and measured in percent). A straight path would
result in a Regularity of 100%. The path (including
the respective target and actual positions) is analy-
zed at every time stamp between initial and end po-
sition. The deviation from the straight path is avera-
ged over all time stamps and subtracted from an ini-
tial value of 100%. Regularity is computed for each
direction (RegularityLeft, RegularityRight, Regulari-
tyDown, RegularityForward).
4.2 Continuous Regularity
The second test ContinuousRegularity shares some
characteristics with the “rotation navigation task”
used by (Tscharn et al., 2016) and requires users to
follow a green target cube (see Figure 2) over a path
that reaches all relevant areas of the 3D interaction
space. The target path starts at the initial position in
the center of the interaction space, then moves around.
The computation algorithmically matches the one
of Regularity, which is, however, tested for each of
the four directions individually only while Continu-
ousRegularity requires a user to perform a coordina-
ted, continuous and interruption-free movement that
covers all directions. To be able to identify pre-
HUCAPP 2018 - International Conference on Human Computer Interaction Theory and Applications
30

Figure 2: Visualization users see during interaction.
ferred directions (e.g., left or right) or dimensions
(e.g., left/right or down/up), we compute individual
metrics (ContinuousRegularityLeftForward, Continu-
ousRegularityLeftDown, ContinuousRegularityRight-
Forward and ContinuousRegularityRightDown) in
addition to the general ContinuousRegularity metric
which considers the whole path.
4.3 Time
Finally, the third test called Time requires users to re-
ach target cubes that consecutively appear in each of
the four directions after a certain delay as quickly as
possible. Again, the red interactive cube is positio-
ned in the center of the interactive space initially and
is moved back there after a target cube has been re-
ached. The target cubes are big enough to be easily
reached as it was not the aim to find out the optimum
size of the target area but the interaction speed in case
the target is of sufficient size. The metrics are called
TimeLeft, TimeRight, TimeForward, and TimeDown.
5 USER STUDY
A two-fold user study was conducted in summer
of 2016 to compare touchful, touchless and semi-
touchless input for pre-specified manipulation tasks
in a 3D interaction space. As mentioned earlier, the
three devices used have been thoroughly tested and
adjusted prior to the actual study. The pre-tests took
place with three test users that did not participate in
the actual study and aimed at i) ensuring compara-
bility among the three devices related to spatial re-
solution, reactivity, interaction space and movement
range, and ii) identification of device configurations
convenient for the user. Thus, we e.g., tested for all
devices whether they reacted to user input in the ex-
pected way (e.g., without delays and with the physical
effort involved being within a comfortable range). As
the sensation of physical demand or fatigue is indivi-
dual it was important to not only test with one pre-test
user. Thus we tested with three users (including also a
user without previous experience with alternative in-
put methods and devices) and chose a setting that was
described as comfortable by all of them. Further, the
pre-tests involved an iterative adjustment of the devi-
ces’ configuration (e.g., regarding interaction space,
reactivity and sensitivity to user input) in order to en-
sure comparability. For instance, we adjusted the mi-
nimum pressure intensity required to trigger an input
activity for the touchful setting and smoothed the va-
lues delivered by the semi-touchless device. Also, we
aligned the physical with the digital interaction space
and made sure that the physical space was equal also
for the touchless setting (which inherently did not in-
volve physical constraints).
5.1 Research Questions
The user study was tailored to evaluate two aspects re-
lated to the three input techniques and devices. First,
it should identify strengths and weaknesses of the in-
dividual devices/techniques, based on the interaction
performance indicators Reach, Regularity, Continu-
ousRegularity and Time. In the second part, UX re-
lated to each of the input devices/techniques should
be evaluated, using the categories Efficiency, Perspi-
cuity, Dependability, Stimulation and Novelty defined
by the standardized User Experience Questionnaire
(UEQ)
1
and described later. As i) the interaction tests
were identical for all devices, ii) the users’ required
interaction activities were comparable for all techni-
ques and iii) the users had enough time to get familiar
with the input techniques prior to the actual tests, the
main difference between the three input techniques is
the degree of haptics involved. Additionally, a diffe-
rence can be seen between touchful and the other two
techniques as it relies on force application (isometric)
whereas the other two rely on movements (isotonic).
Based on our expectations and findings of related stu-
dies, we formulated seven hypotheses:
• H1: We expect users to be able to interact fastest
with touchless input.
• H2: We expect Reach to be about equally high
with all three input techniques.
• H3: We expect interaction Regularity to be better
with input techniques that involve haptics.
• H4: We expect ContinuousRegularity to be better
with input techniques that involve haptics.
• H5: We expect UX to be generally better with in-
put techniques that involve haptics.
1
http://www.ueq-online.org
The Role of Haptics in User Input for Simple 3D Interaction Tasks - An Analysis of Interaction Performance and User Experience
31

• H6: We expect Stimulation to be better with input
techniques that involve haptics.
• H7: We expect Dependability to be better with
input techniques that involve haptics.
Regarding H1, we became aware that related studies
report divergent results, e.g., (Tscharn et al., 2016)
found users to be slower with Leap for navigation
tasks, compared to a 3D mouse whereas in the study
of (Coelho and Verbeek, 2014) who compared Leap to
a common mouse, users were faster with Leap at tasks
comparable to ours. Although (Zhai, 2008) concludes
that “human response with an isometric device is fas-
ter than with a comparable isotonic one since no trans-
port of limb or device is needed” we expected users to
be faster with touchless input in our study. First, they
did not have to overcome physical resistance to hit the
target and second, the distance users had to transport
limb (i.e., their hand) over was equal for all three in-
put techniques. Regarding H2, we expected Reach to
be about equally high with all input techniques as the
participants of the study did not have any known im-
pairments (reducing interaction range) and analyzed
it just to confirm this assumption. Regarding H3 and
H4, we expected (Continuous)Regularity to be better
with input techniques that provide physical restricti-
ons which constitute some form of guidance. Regar-
ding H5, H6 and H7, we expected general UX, and
Dependability and Stimulation in particular to be bet-
ter with input techniques that involve a haptic expe-
rience because prior research suggests that even sim-
ple haptic stimulation can contribute to the communi-
cation of emotional information, see, e.g., (Salminen
et al., 2008).
5.2 Procedure and Methodology
The within-subjects study took place in a controlled
lab setting. Participants were asked to do the three in-
teraction tests with all devices. We used a counterba-
lanced (latin square) order in which the devices were
presented to the them to prevent a bias due to practi-
cing effects and control other position effects like fati-
gue. Before the tests, users got an introduction by the
test supervisor, explaining device and input techni-
que, and could become familiar with it. When they
were ready, the tests started. The results were auto-
matically recorded and analyzed. In total, 25 users
did 27 interaction tasks each (9 tasks with three de-
vices), resulting in a total number of 675 tasks that
were analyzed. The interaction during the phase of
getting familiar with a setting was not recorded. Af-
ter the tests with a device, users answered the stan-
dardized UEQ, see e.g., (Laugwitz et al., 2008). The
UEQ aims at i) enabling quick assessment, ii) cap-
turing comprehensive impression of UX, and iii) en-
couraging simple and immediate feedback (Laugwitz
et al., 2008). It is available in 15 languages and com-
prises the following UX aspects (“scales”): attracti-
veness, perspicuity, efficiency, dependability, stimu-
lation, and novelty. Each scale is represented by a
number of “items” that have the form of a semantic
differential, using a seven-point scale between -3 and
3. For our study we excluded the scale attractiveness
as we considered the related items less important for
our objectives (after making sure that the UEQ allows
for reduction of categories). Our users answered 20
items related to the remaining five scales:
• Perspicuity: Is it easy to get familiar with the pro-
duct? Is it easy to learn how to use it? Exam-
ple items are not understandable/understandable
or easy/difficult to learn.
• Efficiency: Can users solve their tasks without un-
necessary effort? Example items for this category
are fast/slow or impractical/practical.
• Dependability: Does the user feel in control of
the interaction? Example items are unpredic-
table/predictable or meets expectations/does not
meet expectations.
• Stimulation: Is it motivating to use the product?
Example items for this category are not interes-
ting/interesting or motivating/demotivating.
• Novelty: Is the product innovative and creative?
Does the product catch users’ interests? Example
items are creative/dull or conservative/innovative.
The procedure was repeated for all input techniques.
Afterwards, we collected basic demographic informa-
tion. The tests took 15 to 30 minutes per person.
5.3 Participants
We could recruit 25 volunteers, aged between 19 and
49 (AV = 34.12, SD = 9.35), 8 male and 17 female.
All participants were right-handed and used the right
hand for interaction. Most participants were staff or
students of the university. The user group was excep-
tionally diverse regarding experiences with alternative
input techniques (reaching from a UX professor to an
office assistant without any previous experiences with
alternative input devices). About 24% of the users had
previous experience with Leap (only 3 users had used
it more thoroughly). Also 24% had used SpongeBox
once before (due to an earlier user test). In order not to
cause a bias based on previous experiences, we allo-
wed all participants to get familiar with the respective
device as long as they needed before the test.
HUCAPP 2018 - International Conference on Human Computer Interaction Theory and Applications
32

6 RESULTS
This section summarizes the results of the user study.
6.1 Interaction Performance
We will discuss the results based on the metrics des-
cribed earlier, distinguishing between the categories
Reach, Regularity, ContinuousRegularity and Time
(see details in Table 1 and Table 2). To statisti-
cally analyze the differences between the three input
techniques, we ran Friedman’s tests for these crite-
ria. The test was chosen due to the characteristics
of the data which partly violate the normal distribu-
tion prerequisite of ANOVA. However, to examine
the results’ stability, we repeated the analysis with a
repeated-measures ANOVA which confirmed all re-
sults.
The tests revealed significant
2
differences bet-
ween the three input techniques regarding Reach
(χ
2
(2) = 13.317, p = .001
∗
), Regularity (χ
2
(2) =
44.163, p = .000
∗∗
), and ContinuousRegularity
(χ
2
(2) = 13.520, p = .001
∗
) while the differences for
Time were not significant (χ
2
(2) = 5.040, p = .08).
Post-hoc analysis with Wilcoxon signed-rank tests
was conducted with a Bonferroni correction applied,
resulting in a significance level set at p < .017. More
detailed results are reported in the following sections.
6.1.1 Reach
We report the values for the four Reach metrics (see
Table 1) and their aggregation (see Table 2). Statis-
tically significant differences for Reach were found
only between the semi-touchless and touchful (Z =
−2.947, p = .003
3
) techniques. Differences between
touchful/touchless and semi-touchless/touchless were
not significant (Z = −2.130, p = .033 and Z =
−2.060, p = .039). The results generally suggest that
participants could reach the maximum positions well
in all directions and with all techniques.
6.1.2 Regularity
Regularity is measured related to four directions (see
Table 1). The results for these metrics are then avera-
ged for an overall result for Regularity as reported
in Table 2. Generally, the semi-touchless techni-
que clearly outperformed the other two. It resul-
ted in a mean value of 93.68% (SD = 11.04), while
2∗
denotes a significance level set at p < .05,
∗∗
a signi-
ficance level set at p < .001
3
As a significance level of p < .017 has been identified,
we do not use the standard APA notation (p < .05).
the touchful technique gained 82.13% (SD = 14.94)
and touchless input resulted in a mean of 43.91%
(SD = 16.9). 20 of the 25 participants gained their
individually best result with the semi-touchless input
technique, two with the touchful technique, and the
remaining three gained equally good results with the
semi-touchless and touchful techniques (none with
the touchless one). The differences between the in-
put techniques were significant for touchful and semi-
touchless (Z = −3.072, p = .002), touchful and tou-
chless (Z = −4.372, p = .000) and semi-touchless
and touchless (Z = −4.372, p = .000) input.
For three directions (left, right, forward), Regula-
rity was best with semi-touchless input (with means
between 95.15% and 100%, however with high varia-
tion in two cases, see Table 1). The touchful technique
scored best for RegularityDown (M = 85.87%, which
is slightly better than the average result with the semi-
touchless setting, M = 84.26%, both with high vari-
ation). The touchless technique scored worst for all
directions (with means between 24.25% and 62.11%
for forward and right). This trend is confirmed by the
participants’ individual results: no user gained any of
their individually best results with touchless input.
6.1.3 Continuous Regularity
Continuous regularity is measured for all four directi-
ons individually (see Table 1) and further aggregated
to ContinuousRegularity (see Table 2). For touchful
input, the mean values for the different directions
were between 76.47% (right forward) and 87.67%
(left down). For semi-touchless input, the results
were between 72.89% (right forward) and 86.41%
(left down). For touchless input, the results ranged
from 79.61% (right forward) to 82.50% (left down).
Interestingly, even if the differences were in most ca-
ses not too high, the coordinated movement was most
difficult in the direction right/forward with all devi-
ces and least difficult in the direction left/down for
all 25 participants. We attribute this to the fact that
for right-handed people a movement (or force ap-
plication) of the right hand to the left (i.e., towards
the body) is easier than to the right (away from the
body). For the aggregated ContinuousRegularity me-
tric, touchful input scored best on average, resulting in
a mean of 82.34% (SD = 3.84). The touchless techni-
que was slightly worse (M = 81.41%, SD = 16.49)
and semi-touchless was ranked third (M = 79.64%,
SD = 4.1). The statistical analysis showed that the
differences between touchful and semi-touchless in-
put were significant (Z = −2.4082, p = .016). The
other comparisons revealed no significant differen-
ces (Z = −1.574, p = .115 for touchful/touchless and
Z = −2.301, p = .021 for semi-touchless/touchless).
The Role of Haptics in User Input for Simple 3D Interaction Tasks - An Analysis of Interaction Performance and User Experience
33
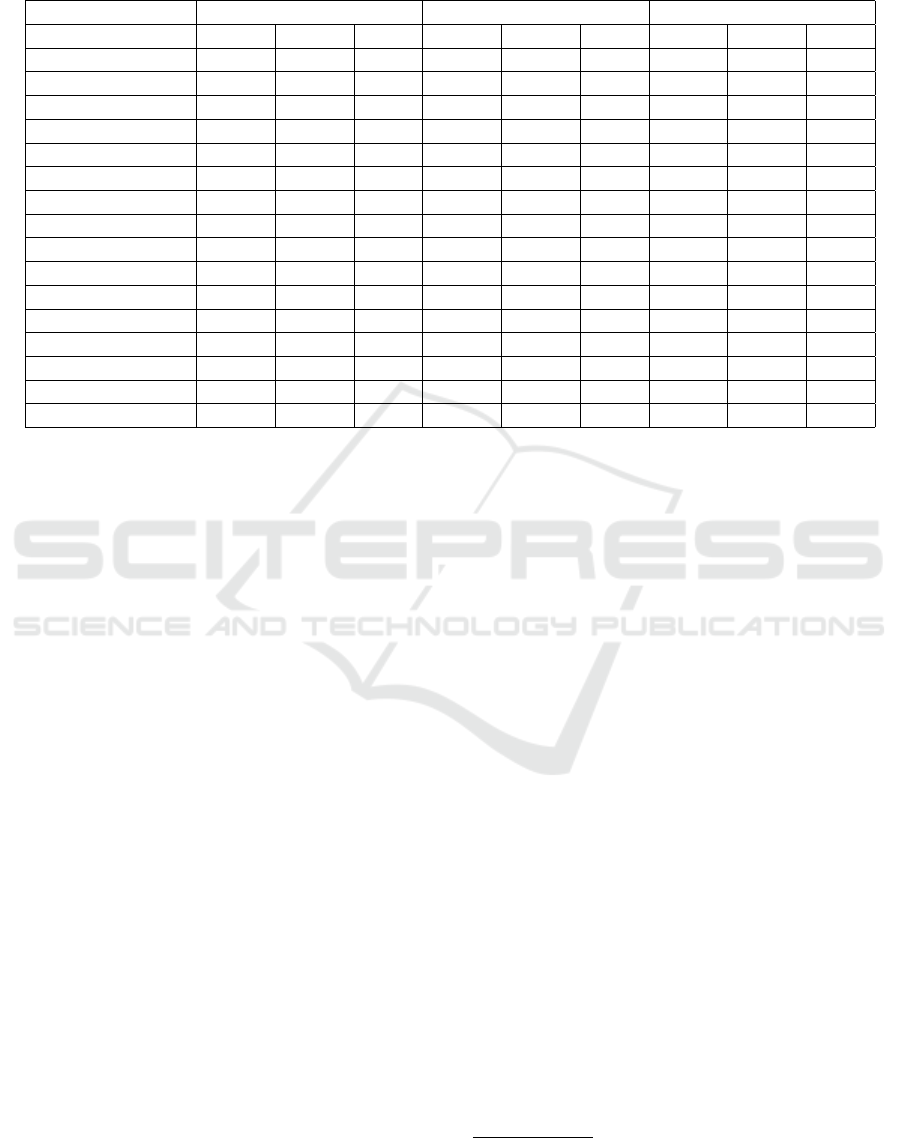
Table 1: The computed values for mean, median and standard deviation of all metrics averaged for 25 participants. All metrics
except for the ones for Time (which are measured in milliseconds), are measured in percent. LF stands for left forward, LD
for left down, RF for right forward and RD for right down respectively.
Metric Touchful Semi-Touchless Touchless
M Mdn SD M Mdn SD M Mdn SD
ReachDown 100.00 100.00 0.00 100.00 100.00 0.00 98.33 100.00 4.08
ReachLeft 95.33 100.00 19.73 100.00 100.00 0.00 99.00 100.00 4.90
ReachRight 91.33 100.00 12.80 100.00 100.00 0.00 99.67 100.00 1.63
ReachForward 100.00 100.00 0.00 100.00 100.00 0.00 100.00 100.00 0.00
RegularityDown 86.87 100.00 21.70 84.26 100.00 34.28 28.78 28.24 21.97
RegularityLeft 91.85 100.00 22.00 100.00 100.00 0.00 60.48 66.97 26.61
RegularityRight 72.30 93.13 34.31 95.30 100.00 14.81 62.11 72.50 32.21
RegularityForward 77.49 100.00 30.20 95.15 100.00 19.87 24.25 19.89 22.74
Cont.RegularityLF 82.18 83.84 6.12 83.58 84.46 3.40 81.43 85.10 14.02
Cont.RegularityLD 87.67 88.30 3.57 86.41 87.95 4.67 82.50 91.40 23.05
Cont.RegularityRF 76.47 75.92 4.44 72.89 73.38 3.75 79.61 82.20 6.56
Cont.RegularityRD 83.05 82.84 4.61 75.68 80.26 13.02 82.08 91.13 24.36
TimeDown 1272 1002 901 1391 1156 856 1832 1251 1681
TimeLeft 795 653 353 940 801 458 1679 1100 2729
TimeRight 1114 1107 466 978 900 380 1797 950 3862
TimeForward 1356 1014 1032 1451 1151 783 2819 1401 3024
6.1.4 Time
We measure the average time a user took to reach each
of the target cubes in the Time test. Interestingly and
in opposition to our expectation (but consistent with
the findings of (Tscharn et al., 2016) or (Stannus et al.,
2011)), users were not fastest with touchless input;
the statistical analysis did actually not reveal any sig-
nificant differences. We initially expected users to be
faster with touchless input due to the absence of phy-
sical resistance. Based on the results we assume that
this missing resistance led to an uncertainty regarding
whether the goal had already been reached or not (alt-
hough we visualized this). Due to the high variation
we searched for outliers and found a user who had
troubles with touchless input in general. Removing
this user from the data set reduces the variation con-
siderably but does not affect statistical significance.
6.2 User Experience
UEQ includes a customized data analysis tool and
methodology which we primarily used for the analy-
sis of our results reported in this section. Although
usually analyzed on the descriptive level (which is
sufficient for the evaluation of one condition), we ad-
ditionally ran a statistical analysis of the UEQ data,
in order to be better able to judge the actual differen-
ces between the settings on a statistical level. For this
analysis we used a repeated-measures ANOVA (as the
UEQ data met the ANOVA’s prerequisites).
6.2.1 UEQ Summary
The results for the UEQ are summarized in Figure 3
and Table 3. The scale ranges from −3.0 (conside-
red “horribly bad”) to 3.0 (“extremely good”). Ho-
wever, the authors of the UEQ consider it “extremely
unlikely” to observe answers < −2.0 or > 2.0 in real
applications. Values between −0.8 and 0.8 represent
a neutral evaluation (visualized yellow in Figure 3),
values > 0.8 represent a positive (green) and values
< −0.8 a negative one (red). Touchful input was eva-
luated positively for Perspicuity, Stimulation and No-
velty and neutrally for Efficiency and Dependability.
For semi-touchless input, the results were neutral for
Dependability and positive for all other categories (es-
pecially for Stimulation and Novelty). For touchless
input, all categories were evaluated positively.
6.2.2 Statistical Analysis
The ANOVA revealed significant differences for De-
pendability (p = .022
∗4
) and Novelty (p = .036
∗
).
The pairwise comparison showed significant differen-
ces only between the touchful and the touchless in-
put technique (p = .031
∗
). The differences for No-
velty were significant only at the group level (pairwise
comparisons did not show significant differences with
e.g., p = .059 for of semi-touchless vs. touchless in-
put). The statistical results seem to lower the weight
4
Greenhouse-Geisser correction was applied because
Dependability data violated the sphericity prerequisite.
HUCAPP 2018 - International Conference on Human Computer Interaction Theory and Applications
34
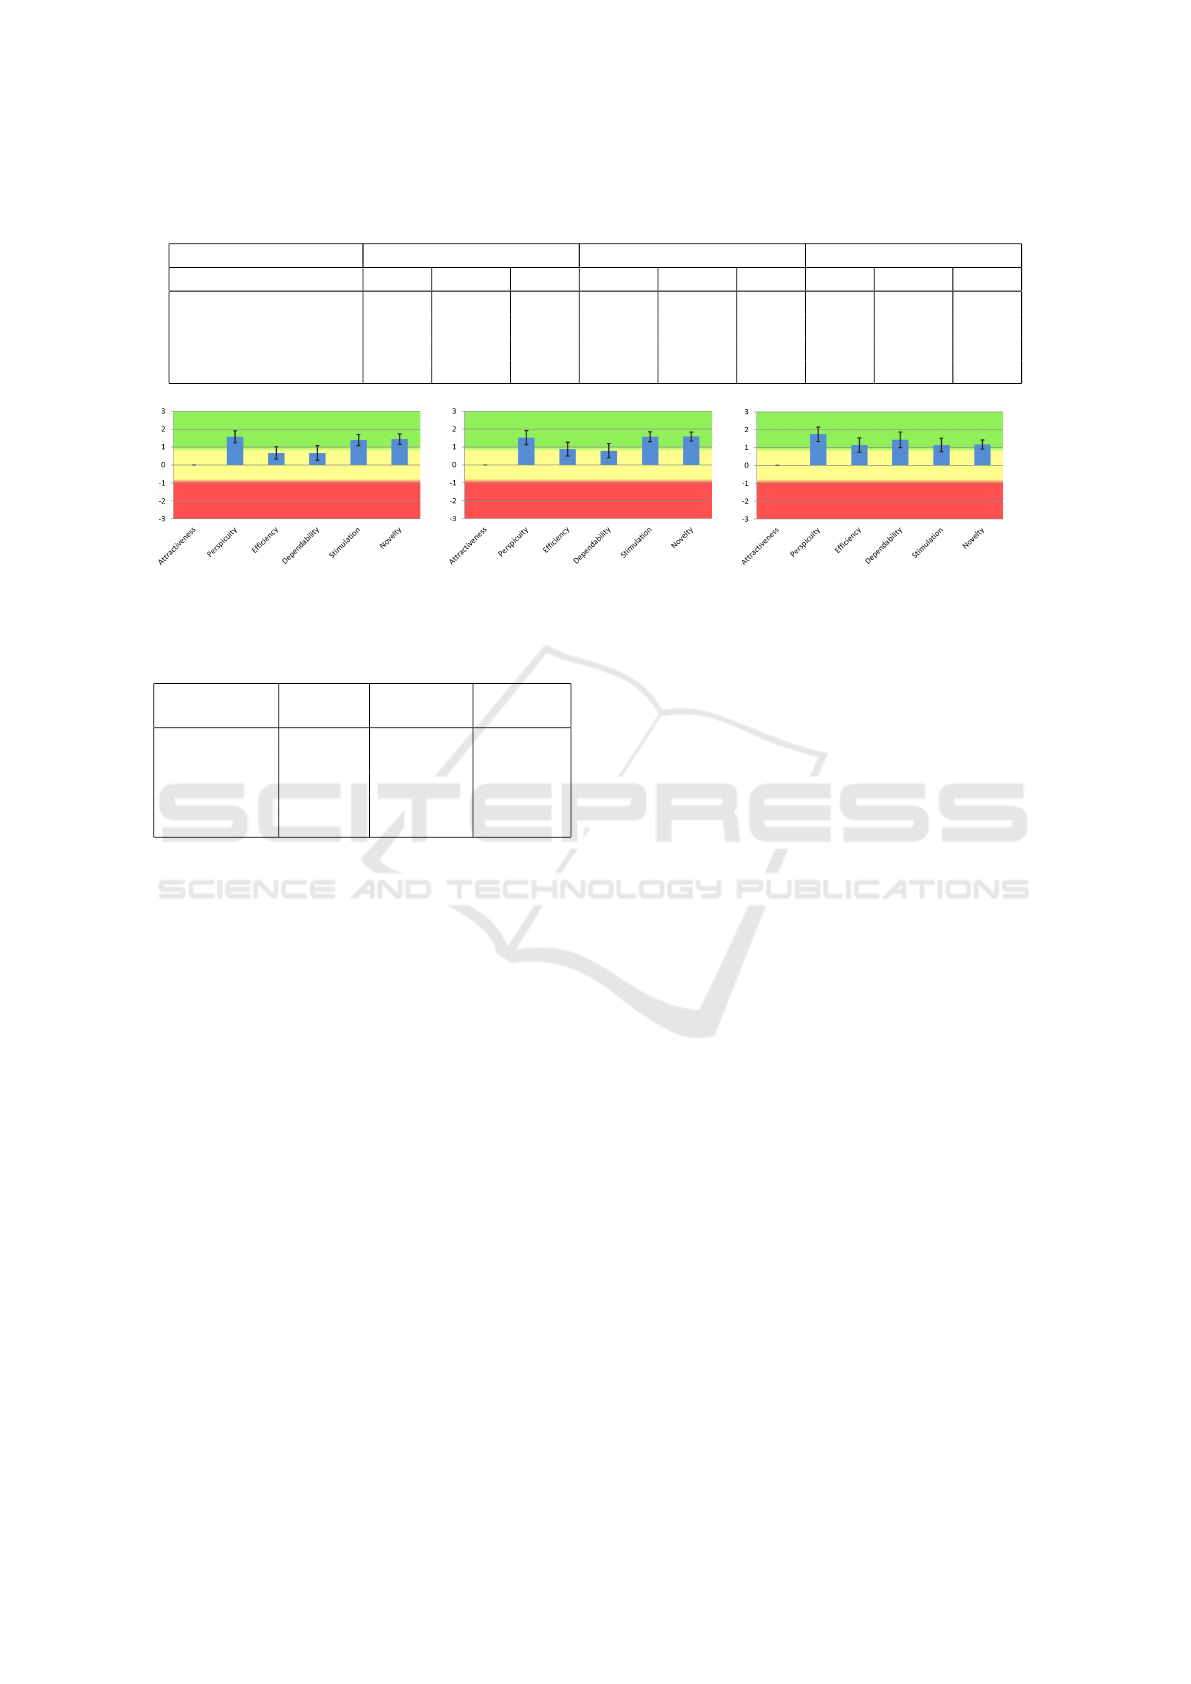
Table 2: Aggregated results for mean, median and standard deviation of Reach, Regularity, ContinuousRegularity and Time
averaged for the 25 participants, measured in percent (or milliseconds, for Time).
Aggregated Metric Touchful Semi-Touchless Touchless
M Mdn SD M Mdn SD M Mdn SD
Reach 96.67 100.00 6.36 100.00 100.00 0.00 99.25 100.00 1.85
Regularity 82.13 86.76 14.94 93.68 100.00 11.04 43.91 47.30 16.90
ContinuousRegularity 82.34 82.41 3.84 79.64 80.45 4.10 81.41 86.68 16.49
Time 1134 1026 466 1190 1081 484 2032 1250 2442
(a) Touchful (b) Semi-Touchless (c) Touchless
Figure 3: The UEQ results for all input techniques. The error bars represent the 95% confidence intervals of the scale means.
Table 3: UEQ results averaged for the 25 participants.
UEQ-
Category
Touchful Semi-
Touchless
Touchless
Perspicuity 1.560 1.520 1.740
Efficiency 0.670 0.873 1.140
Dependability 0.670 0.790 1.430
Stimulation 1.390 1.570 1.140
Novelty 1.440 1.580 1.170
of the UEQ results drastically at first glance. Yet it is
surprising that the scores for three of five categories
are best for touchless input (even if this effect was not
statistically significant for Perspicuity and Efficiency).
We had initially expected a contradictory result with
a strong tendency towards haptic scoring better than
touchless input. The results could indicate that UX
was influenced less than other factors by performance.
6.2.3 Comparison to UEQ Benchmarks
The UEQ data analysis tool also provides a bench-
mark data set that compares the evaluated system
against the responses of 9905 individuals from 246
studies on interactive products. The benchmark data
set helps to draw conclusions about the relative (UX)
quality of the evaluated product in comparison to ot-
hers. This was especially interesting to us as the sta-
tistical analysis revealed less conclusive insights than
expected. The results classify each of the evaluated
categories as excellent, good, above average, below
average, or bad (e.g., “good” means that 10% of the
results are better, 75% are worse). Figure 4 shows that
except for Dependability for touchful input (which is
rated “bad” in comparison), all UX aspects are at least
in an “okay” area. All aspects apart from Dependa-
bility and Efficiency for touchful and semi-touchless
input range from “good” to “excellent”. For touchless
input, the results for all categories are at least “above
average” (“good” for Perspicuity and Novelty).
6.3 Findings Related to the Hypotheses
We summarize the results regarding our hypotheses
as follows. We had to reject H1 as we did not find a
significant difference in Time. H2 was partially con-
firmed. Although the results showed unexpected sig-
nificant differences between touchful (isometric) and
semi-touchless (isotonic) input, the differences bet-
ween the techniques that involve a haptic experience
and touchless input were not significant. We could
confirm H3 as touchful and semi-touchless were sig-
nificantly better than touchless input regarding Regu-
larity. H4 had to be rejected as we did not find signi-
ficant differences between touchful and touchless as
well as semi-touchless and touchless input regarding
ContinuousRegularity. H5 and H7 also had to be re-
jected as the UX part of the evaluation revealed that
while two categories were actually better with tou-
chful and semi-touchless input, the remaining three
(including Dependability) were better with touchless
input. H6 could only partially be confirmed. Sti-
mulation actually tended to be better for both input
techniques that involve a haptic experience which was
however relativized by the statistical analysis. We do
not reject H6 because the comparison with the UEQ
benchmarks categorized touchful and semi-touchless
as “excellent” while touchless input was only “good”.
The Role of Haptics in User Input for Simple 3D Interaction Tasks - An Analysis of Interaction Performance and User Experience
35

(a) Touchful (b) Semi-Touchless (c) Touchless
Figure 4: Comparison with the benchmark data set.
7 CONCLUSIONS
This section summarizes the work presented in this
paper and discusses its impact and limitations.
7.1 Summary
In this paper we have described and compared three
input techniques that rely on a different degree of hap-
tics. Aiming at analyzing the impact of a haptic ex-
perience on objective and subjective factors related
to interaction, we conducted a two-fold user study.
The first part focused on objective interaction per-
formance metrics, the second emphasized perceived
UX. It was quite surprising that the results for the two
parts were relatively contradictory. While the semi-
touchless and touchful input techniques both outper-
formed touchless input regarding selected interaction
performance metrics (and touchless input was not sig-
nificantly better than any of the other two at any me-
tric), three of five UX categories were evaluated bet-
ter in tendency for touchless input. Some factors that
can contribute to the ambivalence between objective
and subjective results are discussed as follows. (Ma-
cLean, 2008) describes that for humans “precision re-
quires resistance”, i.e., absolute position control is
difficult and humans need something solid to push
against when we want to accomplish fine position
control. Touchless input lacks this kind of supporting
guidance, which could have led to the inferior per-
formance. However, a lot of research has dealt with
the emotional quality of haptics in human-technology
interaction (Salminen et al., 2008) and showed that
there is an impact on human perception of interaction
when haptics is involved. This would support the
fact that the more emotion-leaning categories (grou-
ped under “hedonic quality” by UEQ) Stimulation and
Novelty were rated better for the techniques involving
a haptic experience, whereas the rather analytic ca-
tegories (“pragmatic quality”) Perspicuity, Efficiency,
and Dependability received a contrary result.
Based on our observations we draw the following
conclusions related to simple 3D manipulation tasks:
i) haptics does play an important role, especially in
terms of Regularity, ii) it however seems to be more
important for interaction performance than for UX,
and iii) a lower-performing technique can still retain
a good UX. It seems that in our study even the well-
known issue of missing physical constraints with tou-
chless input influenced interaction performance more
strongly than UX. Although in several cases our par-
ticipants did actually leave the sensitive area acci-
dentally (which negatively affected interaction per-
formance), they e.g., rated “good” 1.5 for the items
predictable/unpredictable and “excellent” 1.8 for un-
derstandable/not understandable. The only UX as-
pects that might have been affected negatively can be
found at fast/slow which got a score of 0.8 and mo-
tivating/demotivating (0.4). Although the UX scores
for touchful and semi-touchless input were in most
cases below the ones for touchless, most participants
verbally expressed that they liked the prototypes a lot.
Regarding the comparison of isometric and isotonic
devices, our study did not reveal significant insights.
7.2 Impact and Limitations
Regarding the results of our study, these generally al-
low for conclusions that apply to other input settings
as well. The metrics chosen for the user study are re-
latively general and should be applicable for other in-
put settings, although their significance might differ.
Reach, Time, and Regularity are metrics that are e.g.,
also relevant for interaction based on full-body mo-
vement with considerable more DoF or for conven-
tional mouse/keyboard or touch-based input (2DoF).
ContinuousRegularity is only important for settings
that allow for continuous movement-based input.
One limitation related to the interaction tasks is
that except for left/right, they focused on one di-
rection per dimension (i.e., forward and down). This
was on purpose as for touchful input it would have
been impossible to offer an upper wall without de-
priving users of the visual control of their hand. Re-
garding the direction back, adding another pressable
wall in the back would have been possible but dras-
tically changed the user’s interaction activity. In or-
der to ensure comparability of the input techniques
and prevent a bias based on the devices rather than
the input techniques, we focused on the directions
where activities were of sufficient similarity for all de-
vices. Regarding UX, the good results for touchless
HUCAPP 2018 - International Conference on Human Computer Interaction Theory and Applications
36

input suggest that a missing haptic experience does
not necessarily have to lead to a bad overall UX. To
the contrary, the study has shown that a worse per-
forming device/input technique can still have a good
perceived UX. The good UX results for both touchful
and semi-touchless input in the category Perspicuity
have shown that users understood the input technique
quickly. Also, the good results for touchful and es-
pecially semi-touchless input in the category Stimu-
lation are conclusive (e.g., scores of 1.1 and 1.0 for
motivating/demotivating for semi-touchless and tou-
chful, 0.4 for touchless input). Some results (e.g., the
good results for semi-touchless and touchful input for
Novelty) might be less significant as they might have
been biased by the prototypic nature of the devices
and the resulting “novel” impression. Yet, this poten-
tial bias is only present in a small part of the results.
Most semantic differentials suggest a clear focus on
the interaction with the device, not its appearance.
7.3 Subsequent Work
We expect our results to generalize to interaction tasks
in a similar complexity category while they might dif-
fer with varying complexity and DoF, which should
be analyzed in consecutive studies. We believe that
such studies will reveal interesting findings on the
dependence of need for haptics on task complexity
and expect that with increasing complexity of the in-
teraction tasks, the importance of haptics increases
as well. We already conducted a qualitative study
with users with motor and cognitive impairments, see
(Augstein et al., 2017a), which revealed a much stron-
ger dependence on haptic guidance, compared to non-
impaired users: almost all participants gained their
best results for Regularity, ContinuousRegularity and
Time with touchful input. Regarding subjective im-
pressions, results were relatively balanced.
REFERENCES
Atkins, M. S., Fernquist, J., Kirkpatrick, A. E., and For-
ster, B. B. (2009). Evaluating Interaction Techniques
for Stack Mode Viewing. Journal of Digital Imaging,
22(4).
Augstein, M., Kern, D., Neumayr, T., Kurschl, W., and
Altmann, J. (2015). Measuring Physical Pressure in
Smart Phone Interaction for People with Impairments.
In Mensch und Computer 2015, Workshopband, Stutt-
gart. Oldenbourg Wissenschaftsverlag.
Augstein, M., Neumayr, T., and Burger, T. (2017a). The
Role of Haptics in User Input for People with Motor
and Cognitive Impairments. In Proc. of AAATE 2017.
Augstein, M., Neumayr, T., Kern, D., Kurschl, W., Alt-
mann, J., and Burger, T. (2017b). An Analysis and
Modeling Framework for Personalized Interaction. In
IUI 2017 Companion: Proc. of the 22nd Int. Conf. on
Intelligent User Interfaces, Limassol, Cyprus.
Bowman, D., Coquillart, S., Fr
¨
ohlich, B., Hirose, M., Kita-
mura, Y., Kiyokawa, K., and St
¨
urzlinger, W. (2008).
3d user interfaces: New directions and perspectives.
IEEE Computer Graphics and Applications, 28(6).
Carter, T., Seah, S. A., Long, B., Drinkwater, B., and Subra-
mania, S. (2013). Urtra haptics: Multi-point mid-air
haptic feedback for touch surfacces. In Proceedings
of the 26th Annual ACM UIST Symposium. ACM.
Coelho, J. C. and Verbeek, F. (2014). Pointing Task Eva-
luation of Leap Motion Controller in 3D Virtual Envi-
ronment. In Proceedings of the ChiSparks 2014 Con-
ference, The Hague, Netherlands.
Dangeti, S., Chen, Y. V., and Zheng, C. (2016). Comparing
Bare-Hand-in-Air Gesture and Object-in-Hand Tangi-
ble User Interaction for Navigation of 3D Objects in
Modeling. In Proceedings of the TEI ’16. ACM.
de la Barr
´
e, R., Chojecki, P., Leiner, U., M
¨
uhlbach, L., and
Ruschin, D. (2009). Touchless Interaction – Novel
Chances and Challenges. Springer Berlin Heidelberg.
Fr
¨
ohlich, B., Hochstrate, J., Kulik, A., and Huckauf, A.
(2006). On 3d input devices. IEEE Computer
Graphics and Applications, 26(2).
H
¨
urst, W. and Helder, M. (2011). Mobile 3D Graphics and
Virtual Reality Interaction. In Proceedings of the 8th
International Conference on Advances in Computer
Entertainment Technology, page 28. ACM.
Hwang, S., Bianchi, A., Ahn, M., and Wohn, K. (2013).
MagPen: Magnetically Driven Pen Interaction On and
Around Conventional Smartphones. In Proc. of the
15th Int. Conf. on Human-Computer Interaction with
Mobile Devices and Services, Munich, Germany.
Laugwitz, B., Held, T., and Schrepp, M. (2008). Con-
struction and evaluation of a user experience question-
naire. In Holzinger, A., editor, Proceedings of USAB
2008.
MacLean, K. E. (2008). Haptic Interaction Design for Ever-
yday Interfaces. Reviews of Human Factors and Ergo-
nomics, 4(1).
Rehg, J. and Kanade, T. (1994). Visual tracking of High
DOF Articulated Structures: an Application to Human
Hand Tracking. In Proc. of the 3rd European Confe-
rence on Computer Vision, Stockholm, Sweden.
Salminen, K., Surakka, V., Lylykangas, J., Raisamo, J.,
Saarinen, R., Raisamo, R., Rantala, J., and Evreinov,
G. (2008). Emotional and Behavioral Responses to
Haptic Stimulation. In Proc. of CHI’08. ACM.
Stannus, S., Rolf, D., Lucieer, A., and Chinthammit, W.
(2011). Gestural Navigation in Google Earth. In Pro-
ceedings of the 23rd Australian Computer-Human In-
teraction Conference.
Tscharn, R., Schaper, P., Sauerstein, J., Steinke, S., Stiers-
dorfer, S., Scheller, C., and Huynh, H. T. (2016). User
Experience of 3D Map Navigation – Bare-Hand Inte-
raction or Touchable Device? In Mensch und Compu-
ter 2016. GI.
Zhai, S. (2008). Human Performance in Six Degree of Free-
dom Input Control. PhD thesis, University of Toronto.
The Role of Haptics in User Input for Simple 3D Interaction Tasks - An Analysis of Interaction Performance and User Experience
37
