
Rheography and Spirography Signal Analysis by Method of
Nonlinear Dynamics
Anna Кiseleva
1
, Peter Luzhnov
1
, Alexander Dyachenko
2
and Yuriy Semenov
2
1
Department of Biomedical Techniques, Bauman Moscow State Technical University, Moscow, Russian Federation
2
Russian Academy of Sciences, Moscow, Russian Federation
Keywords: Rheocardiographic Signal, Spirography, Nonlinear Filtering, Nonlinear Dynamics.
Abstract: The method for identifying rheocardiographic signal reference points was considered by means of nonlinear
dynamics. Its application was shown for the analysis with the spirographic signals together. Seven male
volunteers participated in the study as test subjects. Comparative analysis and efficiency of the developed
algorithm were demonstrated.
1 INTRODUCTION
Biological signals have supplied vital information
for diagnosis of disease for many years. Traditional
algorithms of analysis are based on a priori
information about the structure of the biosignals.
Therefore, the main disadvantages of such methods
are their complexity and poor adaptation for signals
having an atypical structure. Also, such methods
cannot remove the noise without signal damage.
In recent years, researchers have discovered that
biosignals show nonlinear dynamical behaviour and
chaos phenomenon. This discovery made it possible
to apply methods of nonlinear dynamics to living
systems (Cohen M.E., Hudson D.L., 2004). At
present, methods of nonlinear dynamics are used in
various fields of medicine. First of all, it is the
processing of the most commonly diagnostic
biosignals such as the electrocardiogram (ECG)
(Ming-rong Ren, Pu Wang, Hui-qing Zhang, 2008),
the electromyogram (EMG) (Diab A., Falou O.,
Hassan M. 2015; Padmanabhan P., Puthusserypady
S., 2004), the electroencephalogram (EEG) (Akar
S.A., Kara S., Agambayev S., Bilgic V., 2015).
Also, these methods are used in processing
biomedical images (Mendonca A. M., Campilho A.,
2006). One of the main advantages of methods of
nonlinear dynamics is the ability to process signals
in real time (Dhivya R., Premkumar R., Nithyaa,
A.N., 2015).
In this paper, we consider methods of nonlinear
dynamics with respect to signals of the rheography
and the spirography. An algorithm for signal
processing was considered based on the analysis of
attractors of phase trajectories. The proposed
algorithm allows without destroying and losing
useful information about the signal to filter these
signals.
2 MATERIALS AND METHODS
Nonlinear dynamics offers the following methods of
analysis: calculation of Lyapunov's exponents and
determination of the time for forgetting the initial
conditions, evolution of phase volume, analysis of
attractors of phase trajectories (Morgavi G., et al.,
2002).
The analysis of attractors is one of the simplest
and most obvious ways of analyzing a nonlinear
system. This method is one of the most common in
the analysis of biosignals (Charlton P.H., Bonnici T.,
Tarassenko L., 2015; Aston P.J., Manasi N., Christie
M.I., Huang Y.I., 2014; Velez A.H., Gonzalez-
Hernandez H.G., Reyes Guerra, B., 2014). It
determines the dependence of each subsequent value
on the previous one with a temporary delay. Blurring
of the pseudo-phase portrait occurs after forgetting
the initial conditions by a nonlinear system. The
non-linear system parameters represents the
dynamics of the cardiovascular system.
Kiseleva A., Luzhnov P., Dyachenko A. and Semenov Y.
Rheography and Spirography Signal Analysis by Method of Nonlinear Dynamics.
DOI: 10.5220/0006579301360140
In Proceedings of the 11th International Joint Conference on Biomedical Engineering Systems and Technologies (BIODEVICES 2018), pages 136-140
ISBN: 978-989-758-277-6
Copyright
c
2018 by SCITEPRESS – Science and Technology Publications, Lda. All rights reserved
2.1 Data Set
The rheography allows to investigate a tissues
hemodynamic in physiological conditions.
Description of an impedance cardiac system are
presented in the paper (Kubicek W.G., Karnegis
J.N., Patterson R.P., 1966). Now are used a
tetrapolar system of electrodes usually. It means that
four electrodes are positioned on a body surface on
one straight line. The pair measuring electrodes is
between pair current electrodes (Shamaev D.M.,
Luzhnov P.V., Iomdina E.N., 2017). Tetrapolar
rheocardiography is a noninvasive method for the
measurement of cardiac output, cardiac index,
systolic time intervals, and other hemodynamic
parameters (Vasilyeva R.M., 2017). Rheographic
signals are depend on many physiological factors:
pulse blood flow, blood pressure (Luzhnov P.V.,
Shamaev D.M., Iomdina E.N. et al., 2017), breath.
Our research was aimed to study the reaction of
the human cardiovascular system to breath
(Semenov Yu.S., Dyachenko A.I., Popova Yu.A., et
al. 2017). In order to analyze the nonlinear system
for isolating its main mathematical dependencies, a
study was conducted based on the rheocardiographic
and spirographic signals. Seven male volunteers
aged 22 to 35 years participated in the study as test
subjects. None of the subjects took medication and
did not suffer from chronic or acute diseases. The
study was performed in 2014 in the Institute of
BioMedical Problems of the Russian Academy of
Sciences. Informed consent from test subjects was
received prior to study. The experiment was adopted
by the Bioethics Committee of the Institute of
BioMedical Problems.
2.2 Pre – processing of Signals
2.2.1 Selection of the Stationary Signal
Sections
The choice of stationary sites during the study is
important, as the stationary condition, as a rule,
limits the sample size for subsequent analysis. We
used without artefact 30 seconds records as the
considering sections of the signal.
2.2.2 Pre - filtration
The selected sites were pre-filtered. A second-order
Butterworth high-pass filter with a cut off frequency
of 0.05 Hz was used to process the
rheocardiographic signals, and then a second order
Butterworth filter with a cut off frequency of 30 Hz
was used. A moving average filter was used (the
window width was 20 samples) to smooth the noise
on the spirographic signal.
2.3 The Nonlinear Filter Implementing
The correct offset must be selected to calculate the
parameters (Palit K., Mukherjee S., Bhattacharya
D.K. 2013). It is known that if the reconstruction
window is too small, then the image of the attractor
turns out to be "compressed", if it is large, then the
image is "stretched and folded". In both cases, it is
necessary to distinguish very small scales to study
the details (Palit K., Mukherjee S., 2011). Usually,
the bias is chosen so that each next reconstructed
vector adds the most information about the attractor
or correlates as little as possible with the previous
one. Researched signals and the filter points are
presented on the figures below:
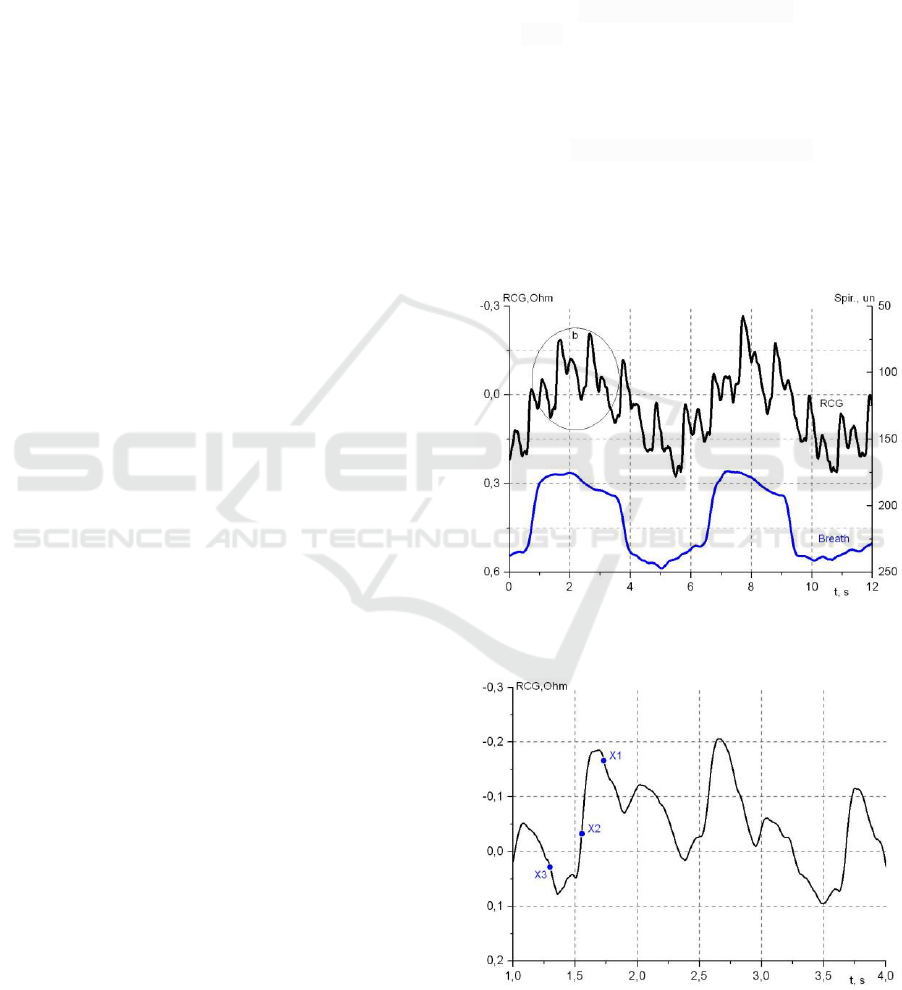
Figure 1: The filter points – the rheocardiographic and
spirographic signals.
Figure 2: The filter points – the rheocardiographic filter
points.

We set the displacement as suggested in the
paper (Gracia J., Seppa V-P., Pelkonen A., 2017).
2.3.1 Definition of Points Attraction
We defined the moments of the beginnings of an
inspiration and an exhalation for the spirographic
signal. For the analysis allocated six whole cycles of
breath. On the basis of the obtained value, we
constructed pseudo-phase portraits of signals and
determined the main points of attraction on them. It
is the systolic peak, the pulse wave beginning, and
the diastolic wave for a rheocardiographic signal.
The coordinates of the obtaining centres are
presented in Table 1.
Table 1: Coordinates of the reference points centres.
Reference
point
X1
X2
X3
Systolic peak,
Ohm
0,147
0,086
0,042
Pulse wave
beginning,
Ohm
0,120
0,071
0,066
Diastolic wave,
Ohm
0,086
0,058
0,070
2.3.2 Identification of Reference Points by
Analyzing Its Pseudo-phase Portraits
Geometric shapes (cube, sphere, ellipsoid) were
used to identify the local points of the signal,
namely, the data was located in the centres of the
points of attraction of the registered signals (see
figure 3).
Figure 3: Identification of the rheocardiographic signal
reference points.
The size of these shapes was selected from the
consideration of the difference between the
maximum and minimum value of the received
signals. Table 2 shows the main parameters of
geometric shapes (the units correspond to the value).
Table 2: The main parameters of geometric shapes.
Shapes
Systolic
peak
Pulse wave
beginning
Diastolic
wave
Cube, the
edges length,
Ohm
0,162
0,154
0,148
Sphere, the
radius, Ohm
0,140
0,133
0,128
Ellipsoid, the
X1-axis, Ohm
0,018
0,010
0,101
Ellipsoid, the
X2-axis, Ohm
0,105
0,068
0,084
2.3.3 The Error Analysis
We estimated the error in identifying the reference
points of the signal using the coordinates and sizes
of the obtained geometric shapes and performed a
correlation analysis to determine the optimal
geometric shape.
The maximum value of the correlation
coefficient is 0.81 for spherical area. So the most
optimal shape is the sphere for nonlinear filtering
with the purpose of selecting reference points of
rheocardiographic signals.
3 RESULTS
On the basis of the chosen geometric shape, a
contour analysis of the signal section was carried
out. In particular, its main structure elements were
marked. It is the systolic peak, the pulse wave
beginning point, and the diastolic wave for a
rheocardiographic signal.
Figures 4, 5, 6 show a contour analysis of signal
carried out with the help of the obtained method of
nonlinear filtering.
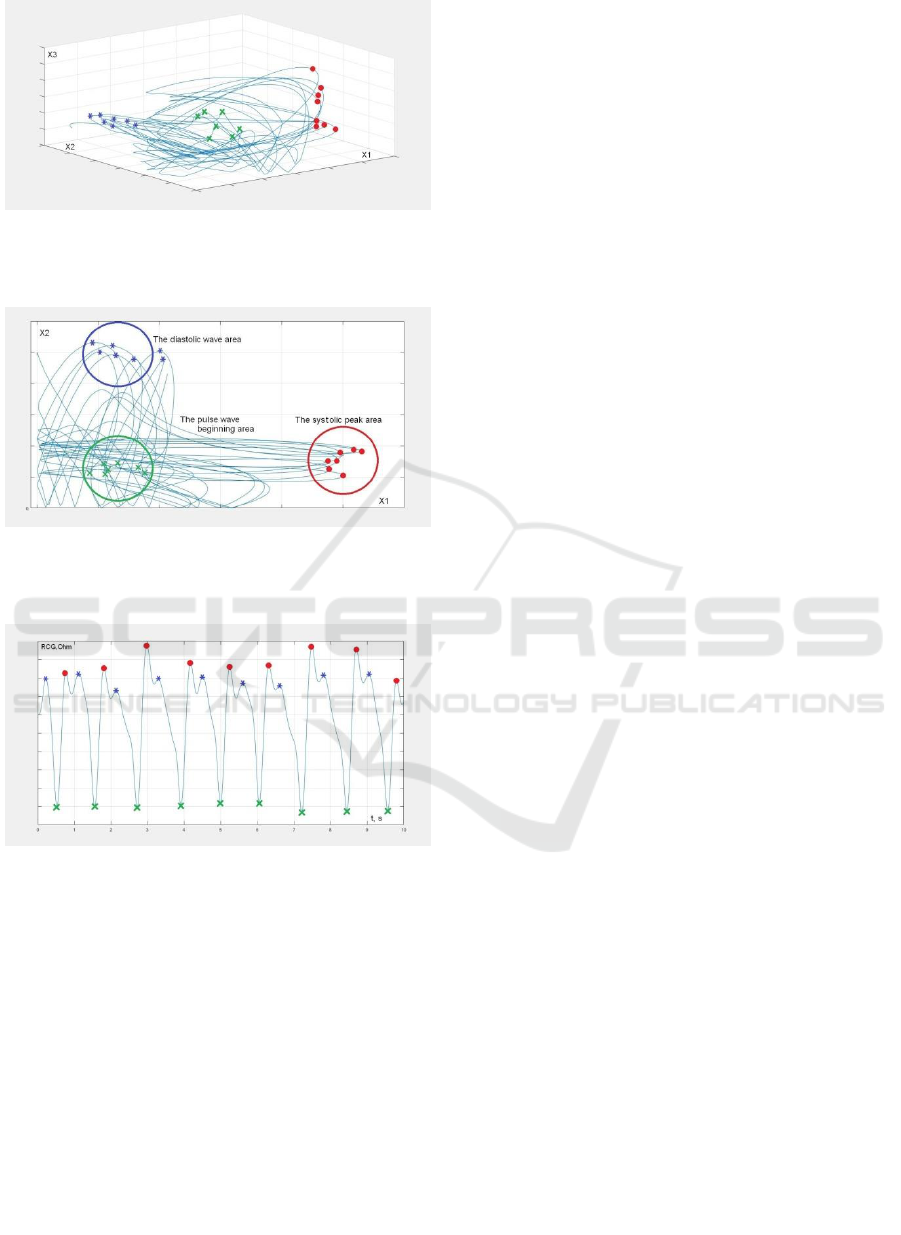
Figure 4: The example of main point selection for the
rheocardiographic signal – the rheocardiographic signal in
phase space.
Figure 5: The example of main point selection for the
rheocardiographic signal – the projection of the
rheocardiographic signal portrait on the X1 and X2 axis.
Figure 6: The example of main point selection for the
rheocardiographic signal – the rheocardiographic signal
with selection of the main points.
4 CONCLUSIONS
In this paper, we considered a new complex method
for analysing biosignals. The received technique is
presented on rheocardiographic signals. The study
showed that analysis of the attractors is the way to
reference points of rheocardiographic signals with
breath identify. For the purpose of the analysis,
stationary signal sections were selected, as well as
the optimal displacement time. A nonlinear filtering
method based on filtering by geometric shapes
(sphere and ellipsoid) in phase space - was proposed
on the basis of the data obtained. A correlation
analysis was performed to evaluate the error of the
filtration.
This work is a continuation of the work of
analyzing the signals of the cardiovascular system
(Aston PJ, Nandi M, 2004; Ming-Rong Ren, Pu
Wang, Hui-Qing Zhang, 2008) and the respiratory
system (Gracia J., Seppa V-P., Pelkonen A.,
Kotaniemi-Syrjanen A. et al., 2017).
In the future, the non-linear filtering method will
serve as a basis for processing signals in real time.
Analysis of pseudo-phase portraits can be used as a
diagnostic method for assessing the state of the
cardiovascular and respiratory systems.
5 CONFLICT OF INTEREST
The authors declare that they have no conflict of
interest.
REFERENCES
Akar S.A., Kara S., Agambayev S., Bilgic V. (2015)
Nonlinear analysis of EEG in major depression with
fractal dimensions. 37th Annual International
Conference of the IEEE on Engineering in Medicine
and Biology Society: 7410–7413.
Aston P.J., Manasi N., Christie M.I., Huang Y.I. (2014)
Comparison of Attractor Reconstruction and HRV
Methods for Analysing Blood Pressure
Data, Computing in Cardiology 41: 437-440.
Aston P.J., Nandi M., Christie M.I. and Huang Y.H.
(2004) Continuous information extraction from blood
pressure data using attractor reconstruction. J. Am.
Coll. 44: 1164-1171.
Charlton P.H., Bonnici T., Tarassenko L., et al. (2017)
Extraction of respiratory signals from the
electrocardiogram and photoplethysmogram:
Technical and physiological determinants.
Physiological Measurement 38(5): 669-690. doi:
10.1088/1361-6579/aa670e.
Cohen M.E., Hudson D.L. (2004) Diagnostic Potential of
Nonlinear Analysis of Biosignals. IEEE Engineering
in Medicine and Biology 26: 5396-5399.
Dhivya R., Premkumar R., Nithyaa A.N. (2015) Real time
secured transmission of biosignal using chaotic
communication system. Engineering and Technology
(ICETECH). doi: 10.1109/ICETECH.2015.7275045.
Diab A., Falou O., Hassan M. et al. (2015) Effect of
filtering on the classification rate of nonlinear analysis
methods applied to uterine EMG signals. 37th Annual
International Conference of the IEEE Engineering in
Medicine and Biology Society (EMBC): 4182-4185.
doi: 10.1109/EMBC.2015.7319316.

Gracia J., Seppa V-P., Pelkonen A., Kotaniemi-Syrjanen
A. et al. (2017) Nonlinear Local Projection Filter for
Impedance Pneumography. European Medical and
Biological Engineering Conference 65: 306-309.
Kubicek W.G., Karnegis J.N., Patterson R.P. (1966)
Development and evaluation of an impedance cardiac
output system. Aerospace medicine 37(12): 1208-
1212.
Luzhnov P.V., Shamaev D.M., Iomdina E.N. et al. (2017)
Using quantitative parameters of ocular blood filling
with transpalpebral rheoophthalmography. IFMBE
Proceedings 65: 37-40. doi: 10.1007/978-981-10-
5122-7_10.
Mendonca A. M., Campilho A. (2006) Segmentation of
retinal blood vessels by combining the detection of
centrelines and morphological reconstruction. IEEE
Trans. Med. Imaging. 25(9): 200–1213.
Ming-rong Ren, Pu Wang, Hui-qing Zhang (2008)
Nonlinear Local Projection Technique for ECG. IEEE
Trans. Biome: 2195-2198.
Morgavi G., et al. (2002) Chaotic Signals: Attractor
Reconstruction and Local Prediction, Proc. 34th
Midwest Symposium on Circuits and Systems 1: 48-51.
Padmanabhan P., Puthusserypady S. (2004) Nonlinear
analysis of EMG signals - A chaotic approach, IEEE
Eng. Med. Biol. 1: 608-611.
Palit K., Mukherjee S., Bhattacharya D.K. (2013) A high
dimensional delay selection for the reconstruction of
proper phase space with cross auto-correlation.
Neurocomputing 113: 49-57.
Palit K., Mukherjee S. (2011) Generalized auto-
correlation and its application in attractor
reconstruction. Bull. Pure Appl. Math. 5(2): 218–230.
Semenov Yu.S., Dyachenko A.I., Popova Yu.A. (2017)
Reaction of the human cardiovascular system to
respiration with additional negative pressure at breath
during 15-hour head-down hypokinesia.
Aviakosmicheskaya i Ekologicheskaya Meditsina
51(3): 22-30. doi: 10.21687/0233-528X-2017-51-3-
22-30.
Shamaev D.M., Luzhnov P.V., Iomdina E.N. (2017)
Modeling of ocular and eyelid pulse blood filling in
diagnosing using transpalpebral rheoophthalmo-
graphy. IFMBE Proceedings 65: 1000-1003. doi:
10.1007/978-981-10-5122-7_250.
Terrill P.I., Wilson S.J., Suresh S., Cooper D.M., Dakin C.
(2008) Investigating parameters participating in the
infant respiratory control system attractor.
Engineering in Medicine and Biology Society. 2120-
2123.
Vasilyeva R.M. (2017) Rheocardiography, an advanced
noninvasive circulatory system test in children and
adults: Progress and prospects. Human Physiology
43(2): 229-239. doi: 10.1134/S0362119717020165.
Velez A.H., Gonzalez-Hernandez H.G., Reyes Guerra, B.
(2014) Attractor reconstruction for plethysmographic
biosignals. 24th International Conference on
Electronics, Communications and Computers
CONIELECOMP: 94-98. doi: 10.1109/
CONIELECOMP.2014.6808574.
