
A Fast Multiresolution Approach Useful
for Retinal Image Segmentation
Dario Lo Castro
1
, Domenico Tegolo
1,2
and Cesare Valenti
1
1
Department of Mathematics and Computer Science, University of Palermo, via Archirafi 34, Palermo, Italy
2
CHAB-Mediterranean Center for Human Health Advanced Biotechnologies, University of Palermo, Palermo, Italy
Keywords:
Elliptical Gaussian filters, Directional Map, Retinal Vessel, Fundus Oculi.
Abstract:
Retinal diseases such as retinopathy of prematurity (ROP), diabetic and hypertensive retinopathy present sev-
eral deformities of fundus oculi which can be analyzed both during screening and monitoring such as the
increase of tortuosity, lesions of tissues, exudates and hemorrhages. In particular, one of the first morpholog-
ical changes of vessel structures is the increase of tortuosity. The aim of this work is the enhancement and
the detection of the principal characteristics in retinal image by exploiting a non-supervised and automated
methodology. With respect to the well-known image analysis through Gabor or Gaussian filters, our approach
uses a filter bank that resembles the “`a trous” wavelet algorithm. In this contribution we show a particular
approach to speed-up the computing time. This methodology rotates the kernels and it is a fast enough to
extract information useful to assess vessel tortuosity and to segment (not considered explicitly in this paper)
retinal images. Furthermore, we compare on the public databases DRIVE and DIARETDB0 our output im-
ages against the SCIRD-TS algorithm, which is considered as one of the most effective supervised methods
for the detection of retinal thin structures.
1 INTRODUCTION
In the last two decades the retinal diseases research
obtained great results in fundus oculi image analy-
sis. Retinal image analysis ensures a non-invasive ex-
amination that shows many characteristics of micro-
circulation, due to a useful screening tool like video-
capillaroscopy (Bellavia et al., 2014a). Recently,
some scientific contributions highlight the correla-
tion between coronary heart disease and coronary mi-
crovascular dysfunctions (McClintic et al., 2010). In-
formation about fundus oculi features, from various
methodologies, are valid and effective resources for
the physician. Optic disk, macula, retinal vessels,
hemorrhages, exudates, micro-aneurysm and tortuos-
ity are quite important features and give information
on eye health, more in general on cardiovascular cir-
culation of the patient. Image processing automated
techniques for blood vessels segmentation were de-
veloped in (Salazar-Gonzalez et al., 2014; Gupta
et al., 2016; Lukac and Subasic, 2017). By exploiting
Gabor filters, methodologies for measurement, track-
ing, detection and segmentation of the width of ma-
jor temporal arcades were described in (Oloumi et al.,
2015). In (Zhang and Zhao, 2016) we can find an
approach that uses compactness, uniformity and lo-
cal density to locate the optic disk. That methodol-
ogy exploits bidimensional Gabor filters with a ro-
tation angle at step of 15
◦
. There are also meth-
ods based on tubular shape and geometrical models
to highlight curvilinear structures (Annunziata et al.,
2016; Soares et al., 2006). Instead, global and local
directional models are used in (Wu et al., 2016) to
identify the optic disk location by its brightness and
parabolic shape. With respect to the detection of ex-
udates an interesting approach was defined by Gian-
cardo et al. (Giancardo et al., 2012) which introduces
a method for diagnosis of diabetic retinopathy by us-
ing a set of features based on color, wavelet decom-
position and segmentation of lesions. A promising
approach based on keypoints (Bellavia et al., 2014b)
was described in (Zhanga et al., 2015). In (Youssif
et al., 2008) Youssif et al. present a method to detect
the optic disk by the degree between vessel map and
vessel’s direction matched filter. Moreover, a circular
brightness object was found by Lu and Lim in (Lu
and Lim, 2011) in order to define a unique circu-
lar brightness structure of the optic disk. All these
methods adopted a model to identify the right struc-
tures. A hand-crafted ridge detector, named SCIRD,
was described in (Annunziata and Trucco, 2016), in-
variant to rotations, resizing and curvatures. This ap-
Lo Castro D., Tegolo D. and Valenti C.
A Fast Multiresolution Approach Useful for Retinal Image Segmentation.
DOI: 10.5220/0006579203400345
In Proceedings of the 7th International Conference on Pattern Recognition Applications and Methods (ICPRAM 2018), pages 340-345
ISBN: 978-989-758-276-9
Copyright
c
2018 by SCITEPRESS – Science and Technology Publications, Lda. All rights reserved
proach uses an appearance and context model, includ-
ing multi-range learned filters, to extract a tubular-
ity measure, obtained by convolving the image with
second-order directional derivatives similar to a Ga-
bor filter bank (Soares et al., 2006). In this way, that
approach faces the problem of point-like and irregular
structures. The drawback of that methodology is the
fine-tuning of various parameters. SCIRD-TS, before
of choosing the final values, requires to test various
parameters, therefore spending so much training and
computing time. In literature there are non-automated
methods that needed a manual tuning, or an initial
training step which is deeply subjected to the val-
ues of parameters proposed by the trainer. However,
those methods should be considered non-supervised
and non-automated as they require a long computing
and processing time, because the a priori choosing of
the input values.
Vice versa, our method, instead of the well-known
Gabor filter approaches, uses an elliptical Gaussian
filter bank in a way that resembles the “`a trous”
wavelet algorithm (Shensa, 1992), pre-calculated fil-
ters and without no particular tuning of parameters.
Therefore it results faster with respect to the tradi-
tional methods that require a priori settings of the
input parameters. For this reason, we consider our
methodology as a non-supervised approach. Fur-
thermore, we introduced a color directional map
to assess better visually the retinal vessels tortuos-
ity (Aghamohamadian-Sharbaf et al., 2016). In this
contribution we carryed out a comparison against the
output images obtained from SCIRD-TS by Annun-
ziata et al (Annunziata and Trucco, 2016) on im-
ages with different resolutions and size from the well-
known public databases DRIVE (Staal et al., 2004)
and DIARETDB0 (Kauppi et al., 2012).
2 PROPOSED METHODOLOGY
In order to put in evidence both linear and curvilin-
ear structures of retinal vessels (see figure 2) we pre-
ferred to use elliptical Gaussian filters with respect to
the standard Gabor filters (Biran et al., 2016; Carn-
imeo et al., 2016; Fraz et al., 2017; Geetharamani and
Balasubramanian, 2016; Kuri, 2015). In this way the
vessel profile is matchable with the kernel one (see
figure 1 and figure 2). To compute the filters bank we
implemented the following function:
G(x, y, σ
x
, σ
y
, µ
x
, µ
y
) =
e
−
(x−µ
x
)
2
2σ
2
x
−
(y−µ
y
)
2
2σ
2
y
2πσ
x
σ
y
(1)
where µ
x
=0 and µ
y
=0 so that the center of the func-
tion coincides with the center of the kernel κ and
where σ
x
= 0.8 and σ
y
= 1.6, determined experimen-
tally, modulate the frequency along the main axis.
Furthermore, we have that x, y∈{−2, −1, 0, 1, 2}.
κ
1
κ
2
κ
3
κ
1
κ
1
⊗κ
2
κ
1
⊗κ
2
⊗κ
3
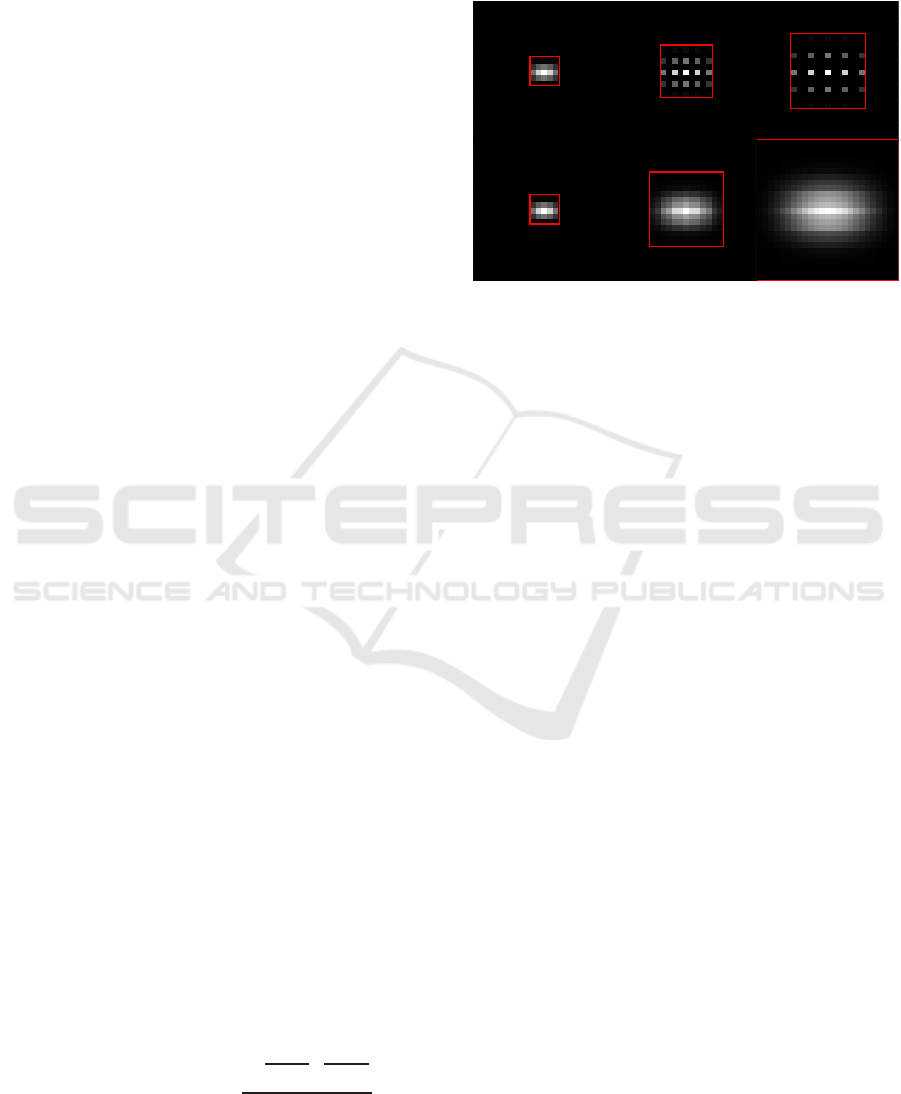
Figure 1: The sequence of convolutions with κ
1
, κ
2
and κ
3
(which have the size 5×5, 9×9 and 13×13) is equivalent
to single convolutions on the same image with kernels with
size 5×5, 13×13 and 25×25. The overall shape of the
elliptical Gaussian function is maintained.
Our methodology exploits the “`a trous” ap-
proach (Shensa, 1992) (in French it means “with
holes” due to the zero elements) to increase the pro-
cessing velocity and to decrease the computing time
(indeed the algorithm considers the same number of
non-zero elements for every kernel). As in figure 1,
starting from the 5× 5 kernel κ, we added zero (i.e the
holes) in order to enlarge κ, thus obtaining a bigger
kernel κ
n
κ
n
(nx, ny)=κ(x, y) (2)
where index n rules only the size of kernel, keeping
the same number of non-zero elements unchanged.
Starting from the 5×5 kernel, κ
1
≡κ, we have 25 non-
zero elements, regardless to the size of the kernel of
the filters bank. Unlike the original “`a trous” algo-
rithm, we set the distance between a kernel and its
next bigger one does not grow up like a power of 2,
because so we had kernels matchable with the width
of retinal vessels in a more precise way.
Starting from a filters bank composed by 5×5 κ
1
,
9×9 κ
2
and 13×13 κ
3
kernels (see top row of fig-
ure 1), by convolving every filter with the previous
one, we obtained elliptical kernels (see bottom row
figure 1)with 5×5, 13×13 and 25×25 sizes, respec-
tively. This approach makes constant the computing
time and achieves good results with respect to those
with more time complexity. Furthermore, we wanted
to make our approach invariant to rotations, thus to
obtain and to extract theinformation about retinal ves-
sels tortuosity. Unlike (Annunziata et al., 2016; An-
nunziata and Trucco, 2016; Zhang and Zhao, 2016)
which use an angle θ at step of 15
◦
to overtake the
time complexity problem due to convolutions, we ro-
tated the kernels with a step of 2
◦
, with an angle
θ = [0
◦
, 178
◦
]. In such a way we ensured a fine val-
uation of the vessel orientation. Furthermore, we did
not analyze the results through neural networks and
we did not apply any sub-sampling (Paranjape et al.,
2015; Rizvi et al., 2016; Wang et al., 2017). At the
end, we had a more general κ
θ
n
and only three itera-
tions and convolutions with the input (for every n and
θ). Different directions and sizes of the kernels high-
light in turn the various curvilinear structures of input
image (see figure 3).
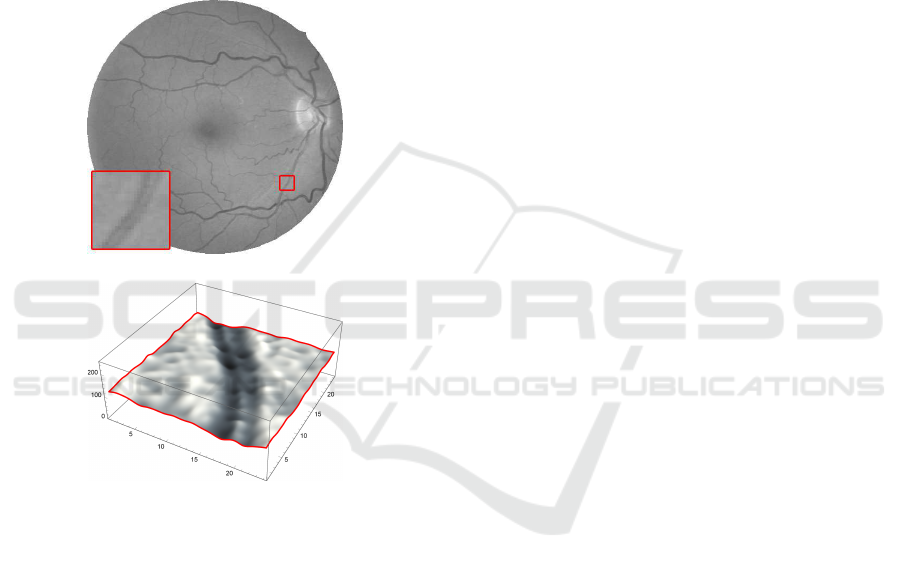
Figure 2: A zoomed detail of 24×24 pixels (gray levels
interpolated and emphasized for better display purposes).
The small central reflex, usually present along the vessel,
can be matched by 5×5 elliptical Gaussian kernel.
Our approach, starting from the smallest 5×5 ker-
nel convolved with the input image, for every rotation
angle, subtract from the input image all highlighted
structures. This process is repeated with bigger ker-
nels in order to bigger always retinal structures. It
must be noted how the smallest details are detected
by κ
θ
1
kernels even if normally they are considered
noise, whereas wider vessels are enhanced by κ
θ
3
. For
the DRIVE and DIARETDB0 databases it is not nec-
essary to use kernels bigger than κ
θ
3
to match the ves-
sel width. This approach, considering θ= [0
◦
, 178
◦
],
locates vessels orientation, because the definitive di-
rection corresponds to the maximum correlation value
in that pixel, for the whole set of convolutions. By
exploiting this information, we obtain a directional
map of colors inspired by the HSV palette (see fig-
ure 4 and figure 5). To avoid any problem due the fact
that even zones that do not present any vessel show
a preferential color/direction, we exclude the back-
ground by multiplying the map by the maximum cor-
relation value itself. The resulting direction is coher-
ent with respect to the image; this approach is sim-
ple but stable and it does not require any interven-
tion to reduce possible fluctuations (e.g. a median fil-
ter in post-processing (Guastella and Valenti, 2016)).
We believe that the information about vessels orien-
tations extracted from the directional map can be a
useful tool for a possible segmentation step (Escorcia-
Gutierrez et al., 2016; Hamad et al., 2014; Keivani
and Pourghassem, 2015; Mookiah et al., 2015; Ro-
taru et al., 2015; Waheed et al., 2015) together with
the vessels brightness. We also believe that the direc-
tional map can be used to assess globally and locally
retinal vessels tortuosity (Khansari et al., 2017).
3 DATABASE AND
EXPERIMENTAL RESULTS
We used our approach on the retinal images of two
standard and well-known public databases: the Dia-
betic Retinopathy Database and Evaluation Protocol
(DIARETDB0) (Kauppi et al., 2012) and the Digital
Retinal Images for Vessel Extraction (DRIVE) (Staal
et al., 2004). Both databases present retinal images
with both pathologies and no pathologies, with dif-
ferent resolutions. DIARETDB0 consists of 130 reti-
nal images, 110 contain various symptoms of diabetic
retinopathy and 20 without any diseases; all of 130
were labeled by four experts to locate the presence of
hemorrhages, exudates and micro aneurysms. DRIVE
consists of 40 retinal images, 7 contain symptoms
mild early diabetic retinopathy and 33 do not show
any sign of diseases; all of 40 images were labeled
by two experts and divided into test and training sets,
containing 20 images each. DIARETDB0 has images
of 1500×1152 pixels, whereas DRIVE has images
of 768×584 pixels. Despite this, the bank of filters
κ
θ
1
, κ
θ
2
and κ
θ
3
were used to process both databases,
matching the dimensions of fundus oculi structures
in any case. To compare the results of our approach
with SCIRD-TS (Annunziata and Trucco, 2016) we
used the FSIM (Zhang et al., 2011) and Dice (Abirami
et al., 2015) measures. In order to put in evidence the
differences between these measures (FSIM evaluates
the overall aspect of the images, whereas Dice per-
forms a pixel-wise analysis) to evaluate the robustness
of the proposed method we introduced Gaussian noise

Figure 3: Graphic representation of convolutions with κ
1
, κ
2
and κ
3
together, which corresponds to a 25×25 kernel.In general
the bigger the kernel, the wider the detected components.Rotating the kernel allows to identify the orientation of the vessels
(highlighted by the arrows in the case of horizontal and vertical targets).
a
b
c
Figure 4: Qualitative comparison between the results obtained on the DRIVE input image (figure 2) by the algorithm described
in (Annunziata and Trucco, 2016) (a) and our methodology (b).We produce also a direction map (c) whose hue indicates the
orientation assigned to each pixel while the luminosity is extracted by the result itself (c).
a
b
c
Figure 5: Qualitative comparison between the results obtained on a typical DIARETDB0 image by the algorithm in (Annun-
ziata and Trucco, 2016) (a) and our methodology (b,c).
up to 30%, too. The FSIM measure uses the phase
congruency to extract the characteristics and the gra-
dient magnitude to code the contrast information and
evaluates the feature similarities of the images on a lo-
cal basis, as for the human visual system. Vice versa,
the Dice measure compares pixel-by-pixelsimilarities
of the images. For the input parameters of SCIRD-
TS (freely distributed implementation available at
http://staff.computing.dundee.ac.uk/rannunziata), we
used its default values.
Average results are reported in figure 6 and in par-
ticular they show FSIM=0.88 and Dice=0.85 with re-
spect to DRIVE and FSIM=0.89 and Dice=0.83 with
respect to DIARETDB0. To verify the robustness of
our method we also introduced a Gaussian noise with
a step of 1% up to 30% in the input images (see fig-
ure 6). We have to point out that our methodology
does not require any time in choosing the parameters,
as opposed to the SCIRD-TS algorithm or as opposed
to many other algorithms described in the literature.
Our method is non-supervised, while it is only sub-
ject to the smallest κ
1
(which depends on the width
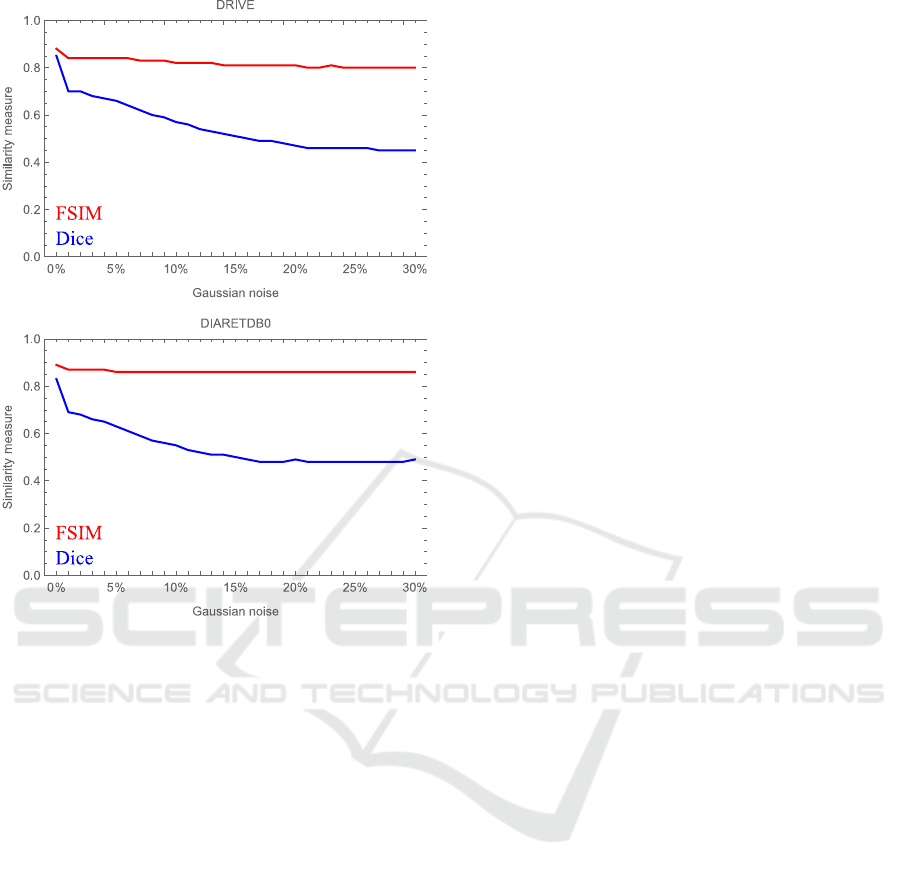
Figure 6: Average quantitative comparison through the
FSIM and Dice measures between the output images ob-
tained by the algorithm described in (Annunziata and
Trucco, 2016) and our methodology, with respect to differ-
ent amount of Gaussian noise.
of the smallest vessels). Our algorithm was devel-
oped in MatLab language without taking care of par-
ticular optimization tricks. In a low level language,
thanks to the pre-computed bank of filters, our algo-
rithm takes few seconds to process an image on an
Intel Core i7-3770 CPU with 3.40 Ghz, 8.0 GB-RAM
and a NVIDIA GeForce GT 620; therefore it should
be useful in the case of a real time applications.
4 CONCLUSIONS AND FUTURE
WORK
Our approach, despite its simplicity, is able to put in
evidence and to enhance the retinal features and the
prevalent directions of curvilinear and linear struc-
tures. The virtues of our methodology are: being a
non-supervised approach; not having to tune parame-
ters; minor computing time to process retinal images
with respect to SCIRD-TS. We obtained good results
in comparing our outputs and the SCIRD-TS ones. In
the future work, we aim to decrease the complexity
time by optimizing the code; to get a binary represen-
tation of the vessels by segmenting our output images;
to use the color directional map to evaluate the vessels
tortuosity.
REFERENCES
Abirami, S., Swapna, T., Pulari, S., and Chakraborty, C.
(2015). Unsupervised segmentation of retinal ves-
sels from fundus fluorescein angiogram images. In-
ternational Journal of Applied Engineering Research,
10:38–43.
Aghamohamadian-Sharbaf, M., Pourreza, H., and Banaee,
T. (2016). A novel curvature-based algorithm for
automatic grading of retinal blood vessel tortuosity.
IEEE Journal of Biomedical and Health Informatics,
20(2):586–595.
Annunziata, R., Kheirkhah, A., Aggarwal, S., Hamrah, P.,
and Trucco, E. (2016). A fully automated tortuos-
ity quantification system with application to corneal
nerve fibres in confocal microscopy images. Med Im-
age Anal, 32:216–32.
Annunziata, R. and Trucco, E. (2016). Accelerating convo-
lutional sparse coding for curvilinear structures seg-
mentation by refining SCIRD-TS filter banks. IEEE
Trans Med Imag, 35(11):2381–92.
Bellavia, F., Cacioppo, A., Lupas¸cu, C., Messina, P., Scar-
dina, G., Tegolo, D., and Valenti, C. (2014a). A non-
parametric segmentation methodology for oral video-
capillaroscopic images. Computer Methods and Pro-
grams in Biomedicine, 114(3):240–6.
Bellavia, F., Tegolo, D., and Valenti, C. (2014b). Keypoint
descriptor matching with context-based orientation es-
timation. Image and Vision Computing, 32(9):559–67.
Biran, A., Bidari, P., Almazroa, A., Lakshminarayanan, V.,
and Raahemifar, K. (2016). Blood vessels extrac-
tion from retinal images using combined 2D Gabor
wavelet transform with local entropy thresholding and
alternative sequential filter. In Canadian Conference
on Electrical and Computer Engineering. IEEE.
Carnimeo, L., Altomare, A., and Nitti, R. (2016). A com-
bined preprocessing method for retinal vessel detec-
tion towards proliferative diabetic retinopathy screen-
ing. In Advances in Artificial Life, Evolutionary
Computation and Systems Chemistry, pages 106–16.
Springer.
Escorcia-Gutierrez, J., Torrents-Barrena, J., Romero-Aroca,
P., Valls, A., and Puig, D. (2016). Interactive optic
disk segmentation via discrete convexity shape knowl-
edge using high-order functionals. Frontiers in Artifi-
cial Intelligence and Applications, 288:39–44.
Fraz, M., Jahangir, W., Zahid, S., Hamayun, M., and Bar-
man, S. (2017). Multiscale segmentation of exudates
in retinal images using contextual cues and ensemble
classification. Biomed Signal Process Control, 35:50–
62.

Geetharamani, R. and Balasubramanian, L. (2016). Retinal
blood vessel segmentation employing image process-
ing and data mining techniques for computerized reti-
nal image analysis. Biocybernetics and Biomedical
Engineering, 36(1):102–18.
Giancardo, L., Meriaudeau, F., Karnowski, T., Li, Y., Garg,
S., Tobin, K., and Chaum, E. (2012). Exudate-based
diabetic macular edema detection in fundus images
using publicly available datasets. Medical Image
Analysis, 16(1):216–26.
Guastella, D. and Valenti, C. (2016). Cartoon filter via
adaptive abstraction. Journal of Visual Communica-
tion and Image Representation, 36:149–158.
Gupta, V., Sengar, N., and Dutta, M. K. (2016). Automated
segmentation of blood vasculature from retinal im-
ages. In 2016 2nd International Conference on Com-
munication Control and Intelligent Systems (CCIS),
pages 81–84. IEEE.
Hamad, H., Tegolo, D., and Valenti, C. (2014). Automatic
detection and classification of retinal vascular land-
marks. Image Analysis Stereology, 33(3):189–200.
Kauppi, T., Kalesnykiene, V., Kamarainen, J., Lensu, L.,
Sorri, I., K¨alvi¨ainen, H., and Uusitalo, H. (2012). A
framework for constructing benchmark databases and
protocols for retinopathy in medical image analysis.
In Intelligent Science and Intelligent Data Engineer-
ing, pages 832–843.
Keivani, M. and Pourghassem, H. (2015). A blood vessel
segmentation algorithm in retinal images using mor-
phological and spatial features. International Journal
of Imaging and Robotics, 15(4):12–28.
Khansari, M., ONeill, W., Lim, J., and Shahidi, M. (2017).
Method for quantitative assessment of retinal vessel
tortuosity in optical coherence tomography angiogra-
phy applied to sickle cell retinopathy. Biomedical Op-
tics Express, 8:3796–3806.
Kuri, S. (2015). Automatic diabetic retinopathy detection
using gabor filter with local entropy thresholding. In
Recent Trends in Information Systems, pages 411–5.
IEEE.
Lu, S. and Lim, J. (2011). Automatic optic disc detection
from retinal images by a line operator. IEEE Trans
Biomed Eng, 58(1):88–94.
Lukac, A. and Subasic, M. (2017). Blood vessel seg-
mentation using multiscale hessian and tensor voting.
In 40th International Convention on Information and
Communication Technology, Electronics and Micro-
electronics, pages 1534–1539. IEEE.
McClintic, B., McClintic, J., Bisognano, J., and Block, R.
(2010). The relationship between retinal microvascu-
lar abnormalities and coronary heart disease: a review.
Am J Med, 123(4):1–7.
Mookiah, M., Tan, J., Chua, C., Ng, E., Laude, A., and
Tong, L. (2015). Automated characterization and de-
tection of diabetic retinopathy using texture measures.
J Mech Med Biol, 15(4).
Oloumi, F., Rangayyan, R., Casti, P., and Ells, A. (2015).
Computer-aided diagnosis of plus disease via mea-
surement of vessel thickness in retinal fundus images
of preterm infants. Comput Biol Med, 66:316–29.
Paranjape, S., Ghosh, S., Ray, A., and Chatterjee, J. (2015).
Segmentation of retinal blood vessels through Gabor
features and ANFIS classifier. In International Con-
ference on Industrial Instrumentation and Control,
pages 512–6. IEEE.
Rizvi, S., Cabodi, G., Gusmao, P., and Francini, G. (2016).
Gabor filter based image representation for object
classification. In International Conference on Control,
Decision and Information Technologies, pages 628–
632. IEEE.
Rotaru, F., Bejinariu, S., Luca, R., and Nit¸˘a, C. (2015). Reti-
nal vessel labeling method. In E-Health and Bioengi-
neering Conference, pages 1–4. IEEE.
Salazar-Gonzalez, A., Kaba, D., Li, Y., and Liu, X. (2014).
Segmentation of the blood vessels and optic disk in
retinal images. IEEE Journal of Biomedical and
Health Informatics, 18:1874–1886.
Shensa, M. (1992). The discrete wavelet transform: wed-
ding the `a trous and Mallat algorithms. IEEE Trans
Sig Process, 40(10):2464–82.
Soares, J., Leandro, J., Cesar, R., Jelinek, H., and Cree,
M. (2006). Retinal vessel segmentation using the 2-
d gabor wavelet and supervised classification. IEEE
Trans Med Imag, 25(9):1214–22.
Staal, J., Abramoff, M., Niemeijer, M., Viergever, B., and
van Ginneken, B. (2004). Ridge based vessel segmen-
tation in color images of the retina. IEEE Trans Med
Imag, 23(4):501–9.
Waheed, A., Akram, M., Khalid, S., Waheed, Z., Khan, M.,
and Shaukat, A. (2015). Hybrid features and mediods
classification based robust segmentation of blood ves-
sels. J Med Syst, 39(10).
Wang, Y.-B., Zhu, C.-Z., Yan, Q.-F., and Liu, L.-Q. (2017).
A novel vessel segmentation in fundus images based
on SVM. In International Conference on Information
System and Artificial Intelligence, pages 390–4. IEEE.
Wu, X., Dai, B., and Bu, W. (2016). Optic disc localization
using directional models. IEEE Trans Image Process,
25(9):4433–42.
Youssif, A., Ghalwash, A., and Ghoneim, A. (2008). Optic
disc detection from normalized digital fundus images
by means of a vessels direction matched filter. IEEE
Trans Med Imag, 27(1):11–8.
Zhang, D. and Zhao, Y. (2016). Novel accurate and fast op-
tic disc detection in retinal images with vessel distri-
bution and directional characteristics. IEEE J Biomed
Health Inform, 20(1):333–342.
Zhang, L., Zhang, L., Mou, X., and Zhang, D. (2011).
FSIM: A feature similarity index for image quality as-
sessment. IEEE Trans Image Process, 20(8):2378–86.
Zhanga, L., Fisherb, M., and Wang, W. (2015). Retinal
vessel segmentation using multi-scale textons derived
from keypoints. Comput Med Imaging Graph, 45:47–
56.
