
Extracting Information and Identifying Data Structures in
Pharmacological Big Data using Gawk
Reinhard Schuster
1
, Timo Emcke
2
, Martin Schuster
3
and Thomas Ostermann
4
1
Department of Health Economics, Epidemiology and Medical Informatics, Statutory Health Insurance of North Germany,
23554 Lübeck, Germany
2
Department of Prescription Analysis, Association of Statutory Health Insurance Physicians, 23795 Bad Segeberg,
Germany
3
Lübeck University, Institut of Theorectical Informatics, 23538 Lübeck, Germany
4
Chair of Research Methodology and Statistics in Psychology, Witten/Herdecke University, 58313 Herdecke, Germany
Keywords: Big Data, Gawk, Mathematica, Associative Arrays, Priscus Drugs, Drug Related Neighbourhood Relations.
Abstract: In the past decades, health related data saw an increase in capture, storage and analysis of very large data
sets, referred to as big data. In health services research, big data analysis is used by health policy makers to
identify and forecast potential risk factors, causalities or hazards. However, big data due to its volume, its
high variety of data types and its high velocity of data flow is often difficult to process. Moreover, big data
also shows a high complexity of data structures. In such cases, gawk programming language is a powerful
tool to work with by using structural elements such as associative arrays. This article aims at describing the
use and interaction of gawk to extract information and identify data structures in pharmacological big data
sets. In particular we aimed at showing its strength in combining it with Mathematica based on two
examples of the prescription data for potentially inadequate medications for elderly patients and the creation
of networks of physicians and drug related neighbourhood relations.
1 INTRODUCTION
In the past decades, health related data saw an
increase in capture, storage and analysis of very
large data sets, referred to as big data (Press, 2013).
In health services research, big data is expected to
assist stakeholders and health policy makers in
improving primary-care quality by identifying and
forecasting potential risk factors, causalities or
hazards (Hassani and Silva, 2015; Wang and
Krishnan; 2014; Wyber et al., 2015).
However, big data due to its volume, its high
variety of data types and its high velocity of data
flow is often difficult to process using traditional
methods and tools (Cao and Fayyad, 2016).
Moreover, big data also shows a high complexity of
data structures, in particular when data is merged
and processed from different sources and needs to be
transformed into common formats for processing
(Cao, 2016).
Although ‘big data’ as a definition is quite
popular, its beginning can be traced back to the
1970s (Hu et al., 2014). In this area, AWK was
created at Bell Labs by Alfred Aho, Peter
Weinberger, and Brian Kernighan from whose
surnames the language was named (Robbins, 2011).
They aimed at constructing a data-driven language
consisting of a set of simple actions for textual data
and according to a personal communication of
Kernighan were inspired by a tool of Marc Rochkind
that executed procedural code when a regular
expression matched a record in telephone system log
data (Pike et al., 2005). In such cases of textual or
unstructured data, when queries require extensive
transformations to obtain relevant data for each
record AWK still is a powerful tool to work with.
Thus it is unsurprising that AWK is ranked 8th in
programming languages used in custom codes for
data mining in a recent survey of Begoli et al (2012).
Based on AKW, gawk was launched as a free-
software implementation of AWK including its own
debugger with shared libraries included in UNIX
and Linux distributions (Robbins, 2011; Spinelli,
2017). Similar to AWK, gawk is a scripting
language with a low number of commands but
nevertheless it is quite powerful both from the point
Schuster, R., Emcke, T., Schuster, M. and Ostermann, T.
Extracting Information and Identifying Data Structures in Pharmacological Big Data using Gawk.
DOI: 10.5220/0006571603870394
In Proceedings of the 11th International Joint Conference on Biomedical Engineering Systems and Technologies (BIOSTEC 2018) - Volume 5: HEALTHINF, pages 387-394
ISBN: 978-989-758-281-3
Copyright © 2018 by SCITEPRESS – Science and Technology Publications, Lda. All rights reserved
387

of view of algorithmic and of mathematical
structures. Today, there are interesting opportunities
combining gawk with Back-End programmes such
as Mathematica, MySQL, Perl, SPSS, Excel
(Shimono, 2016).
A rich structure given in gawk is given by
associative arrays (Wünschiers, 2013). Although this
structure element can be found in almost all
scripting languages, in gawk it is very easy to handle
in combination with a smart string concatenation.
From a mathematical point of view it is a function
defined on a finite set of elements. The
concatenation of a set of such functions is much
easier to handle than comparable SQL-structures if
one supposes not to use n-to-m structures with n, m
> 1. In Mathematica this structural element of
associative arrays is named is called ‘association’
and was added as a new element only some years
ago. Although Mathematica is a powerful tool for
higher mathematical structures and related
transformations, it is not suited for big data at least
above the main memory and a combination of gawk
and Mathematica for big data analysis thus seems
reasonable.
2 GAWK AS A TOOL FOR BIG
DATA
Gawk can define a two dimensional structure of a
text file using a record separating element (new line
as standard) and a filed separating element
(semicolon for csv-files) in the BEGIN-statement.
This leads to different interpretations of files. The
standard application linearly goes through a file and
in contrast to other programs like SPSS does not
load it into the main memory beforehand. Thus there
is no problem to analyse file of size about 100 GB
with gawk. If a functional transformation using an
associative array is applied, this transformation has
to be loaded first. An example for this is given in
pharmacological big data sets i.e. to map the drug
group as an ATC-code (anatomic-therapeutic-
chemic) to a drug id (PZN, pharmaceutical central
number). As in MS Windows the amount of memory
is limited in such examples, it is advisable to use a
Linux implementation which only has limits of the
main memory. In particular, for optimal running
times a combination of array application and a
SORT operation by the operation system is
recommended, as SORT is a very fast operation
using all processor cores. Finally it is advisable to
use modular components and steps in order to
validate computations and to reuse transformation
steps.
Further important language elements are regular
expressions. Using regular expressions one can
identify relevant structures in the data and apply
transformations for them.
In gawk each string variable can be split into a
one dimensional array using a splitting element or
pattern. By iterations of this procedure we can get
high dimensional arrays. The reverse procedure can
be done with a usual loop structure.
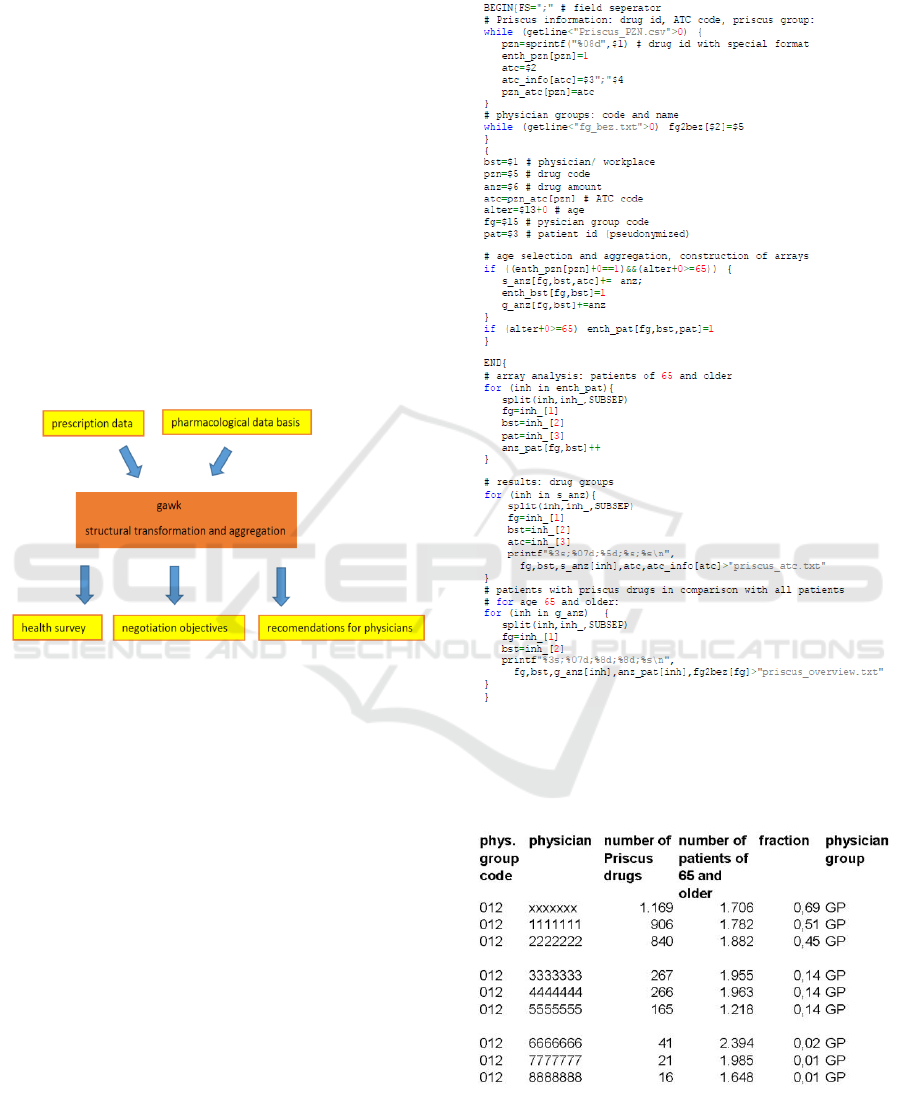
Using a getline-procedure enables the user to
pass through other files before or after the main
program. By passing through one or several files, it
is possible to collect information and to run further
transformations before exporting the resulting
structural information at the end. This is illustrated
in the context of Priscus drugs in Fig. 1.
In the following chapter we will give several
examples for such applications.
3 PRISCUS DRUGS
Priscus drugs are potentially inadequate medications
for elderly people above 65 years (Pohl-Dernick et
al., 2016). The selection of such drugs is done with
the ATC code of the drugs and in some cases both
dosage and drug amounts given by pharmacological
databases have to be used (Amann et al., 2012). In
the first instance prescription data of a geographical
region with the dimensions
- physician (physician id LANR: lifelong doctors’s
number or workplace id BSTNR)
- patient (pseudonymized),
- drug id (PZN: pharmaceutical central number)
with amount factor and prescription data.
are needed. This is defined as “prescription data” in
Fig 1. In order to identify potentially inadequate
drugs for elderly people a pharmacological database
(i.e. Lauer taxe: http://www.lauer-fischer.de/LF) is
also needed (mentioned as “pharmacological data
bases” in Fig 1).
With gawk, the taxes data is imported and to each
PZN the ATC code is associated. In the next step the
knowledge data identifying the Priscus drugs and the
association of a physician group to each physician
by the structural data of the Association of Statutory
Health Insurance Physicians (For 2016: 24,36
million datasets including 2,17 million patients,
2,622 physician offices and 62,363 prescribed drugs
leading to 3,84 million combinations of physicians
HEALTHINF 2018 - 11th International Conference on Health Informatics
388
and patients and 11,26 million combinations of
physicians, patients and prescribed remedies) is
imported by using the above described associative
arrays or functions in the mathematical context
which is the task of ”gawk” in Fig. 1.
If for example we want to analyse, whether the
Priscus list has reduces the application of potential
inadequate drugs during a 5-year-period, a related
analysis is done for each quarter of those 5 years (20
quarters). The top point of view in this analysis is
given by the geographical region. It will give health
survey data and negotiation goals for the yearly
negotiations between the Statutory Health
Insurances which may engage the Medical Advisory
Board (as done in Schleswig-Holstein during a long
period) and the Association of Statutory Health
Insurance Physicians. The applications are
mentioned in the lower line in Fig. 1. Table 1
exemplifies comments for the use of gawk program
elements.
Figure 1: Data Flow data. for the example of PRISCUS.
In order to acquire reduction potentials for
potential inadequate drugs it is highly recommended
informing all physicians of a region about their
results in comparison with their physicians group.
This is realized in Schleswig-Holstein in two ways.
First each physician gets the relevant information
within his quarterly report. On the other hand more
detailed informations are included in personal
informations talks with detailed reports with are
offered by joined consultations of pharmacists of the
Statutory Health Insurances and physicians of the
Association of Statutory Health Insurance
Physicians for all Statutory Health physicians.
Table 1: Example of a gawk program for Priscus
computations.
Table 2: Results of the considered Priscus program: the
number of Priscus drugs per patient of age of 65 or older
lies in a large range from 0.69 to 0.01 for General
Practitioner (GP).
Extracting Information and Identifying Data Structures in Pharmacological Big Data using Gawk
389
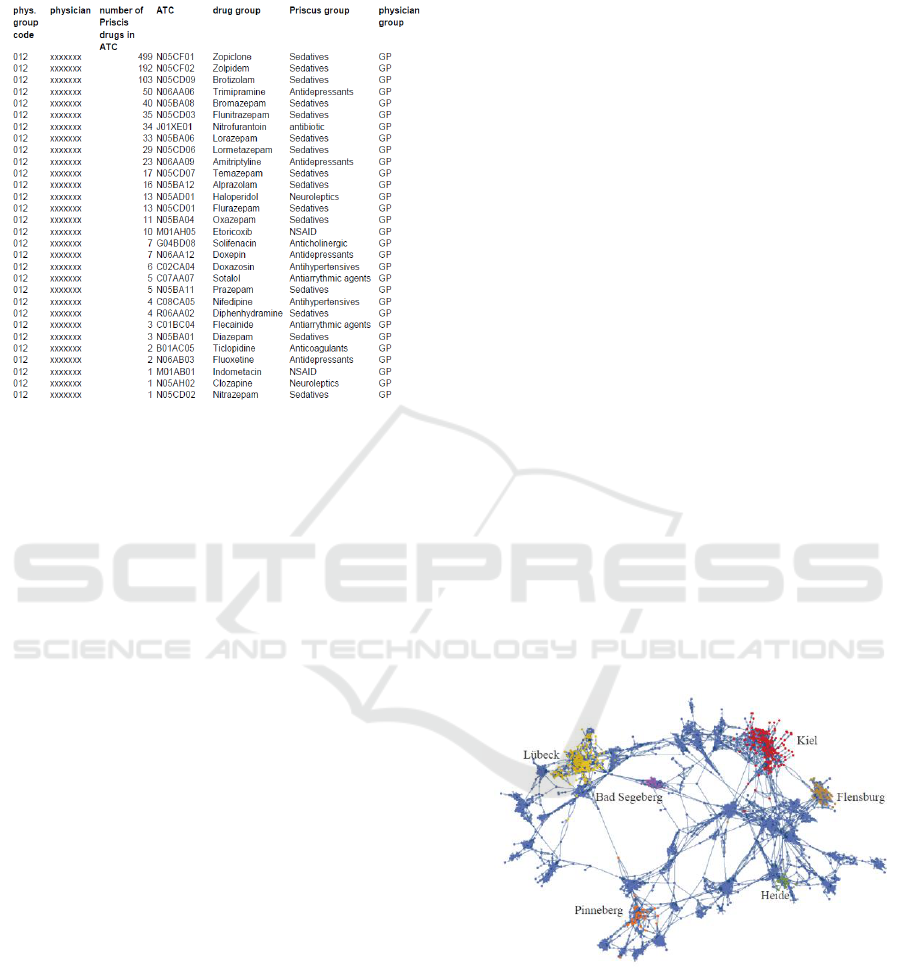
Table 3: Results of the considered Priscus program: ATC
details are given for the physician xxxxxxx from Table 2.
4 NETWOKS OF PHYCIANS AND
DRUG RELATED
NEIGHBORHOOD RELATIONS
Another example for using gawk is given by
creating networks of physicians and drug related
neighbourhood relations (Schuster, 2015; Schuster
and Schuster, 2015).
For each physician we consider those other
physicians with the top levels of common patients.
They commonly have a network of communication
in relation of common treatment strategies not only
restricted to individual cases of bilateral reports.
However, there are deficits in communications
which might be identified by means of big data
analysis of geographical neighbourhood relations.
We start with the prescription data with the
dimensions physician and patient. An intuitive idea
to use an n x n matrix with n representing the
number of physicians would give poor running time
results due to more than one million elements in it.
As we only need sparse arrays, gawk again is a good
choice in order to manipulate as little information as
possible. However this special problem can lead to
severe mistakes if we run an uncritical analysis.
It has to be taken into account that prescription
data are results of a scanning procedures in
pharmacy centres. Thus the physician id or the
patient id may be afflicted by scanning errors. In
order to get a strong reduction of such errors patients
with too much physicians should be avoided (patient
error) and likewise physicians with only a few
patients (physician error).
Using prescription data we first pass the file by
only exporting pairs of patient id and physician id.
Additionally the patients of physicians and
physicians for patients are counted. In order to do so
all pairs of physicians and patients are written into
an associative array and threshold values are used in
an END-step in order to eliminate scanning errors.
Alternatively this can be done with two different
export and sort procedures with a subsequent
counting step.
Using the pairs of patient id and physician id a
sort procedure will enable gawk in the next step to
write all physicians for a patient into an array. After
building all pairs of physicians this array can be
deleted. Due to the elimination of all patients above
a predefined threshold value the building of pairs of
physicians is no running time problem anymore.
We now can consider the top one to three
physicians for each physician with the most common
patients. In order to get visualization it is advisable
to use Mathematica as a graphical tool as well as to
determine connected components or other
parameters as diameter of the related graph. We
again can use gawk in order to get one of the
necessary import structures for Mathematica. From
the point of view of mathematical analysis and
geometry gawk is well adopted for cuts of fibre
bundles. Thereby we consider a local projection on
subspaces with extensive global structures. Figure
two is an output of a respective analysis.
Figure 2: Neighbourhood graph with physicians as
vertices and (directed) edges given other physicians with
top three levels of common patients which has three
connected components. Physician of the German regions
Lübeck, Kiel, Bad Segeberg, Flensburg, Pinneberg and
Heide marked by color.
In the top 3 level we get three connected graph
components. It is remarkably that only two small
components are isolated. The geographic
HEALTHINF 2018 - 11th International Conference on Health Informatics
390
determination by the structural data of the Statutory
Health Insurance Physicians is highlighted by
colour; the relevant import to Mathematica was done
by gawk. On the top two levels we get the
description given in Fig. 3:
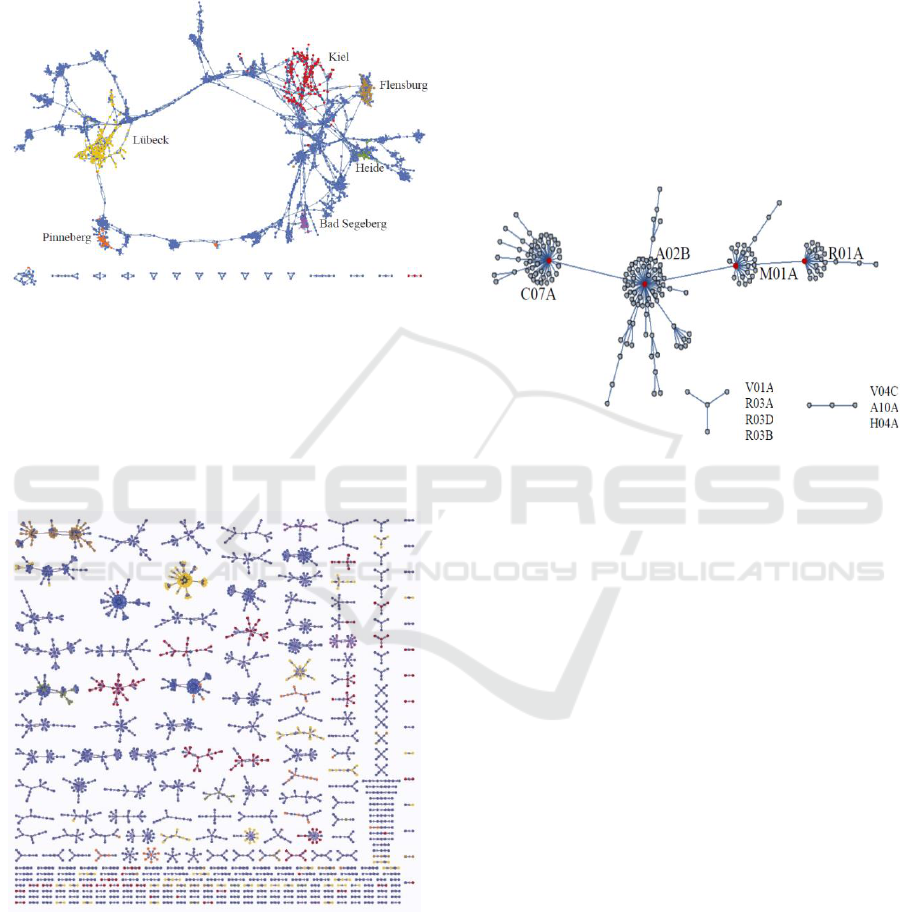
Figure 3: Neighbourhood graph with physicians as
vertices and (directed) edges given other physicians with
top two level of common patients with 16 connected
components.
We still have a large component and 16 small
graph components with 6 triangle components and 4
linear components. The top one level identifies local
network structures:
Figure 4: Neighbourhood graph with physicians as
vertices and (directed) edges given other physicians with
top one level of common patients with 313 connected
components which all have tree structure.
As can be seen, there is a large structural variety of
local components. Some structures have central
elements which can be interpreted as
communications centres for other physicians. We
can get further intersting graphs by identifying the
physicians of the top one level.
Another point of view is given by the dimensions
patient and group. We can consider, which other
drugs are on the top positions if a patient get some
drug group. The gawk calculations are a variations
of the previous considerations. We have to use an
aggregation on the ATC level. This consideration
may by extended by an age adjustment. On the ATC
three level we get the following result displayed in
figure 6. We have one large graph component and
two small components.
Figure 5: Neighbourhood graph with ATC-4-codes as
vertices and (directed) edges given other ATC-4-codes
with most common use by patients in a quarter (Abbrev:
C07A: Cardiac glycosides; A02B: Drugs for peptic ulcer
and gastro-oesophageal reflux disease (gord); M01A:
Antiinflammatory and antirheumatic products, non-
steroids; R01A: Decongestants and other nasal
preparations for topical use; V04C: Other diagnostic
agents; A10A: Insulins and analogues; H04A:
Glycogenolytic hormones; V01A: Allergens; R03A:
Adrenergics, inhalants; R03D: Other systemic drugs for
obstructive airway diseases; R03B: Other drugs for
obstructive airway diseases, inhalants).
The large component has four central points
given by the ATC drug groups C07A (Cardiac
glycosides), A02B (Drugs for peptic ulcer and
gastro-oesophageal reflux disease (Abbrev: gord)),
M01A (Anti-inflammatory and anti-rheumatic
products, non-steroids) and R01A (Decongestants
and other nasal preparations for topical use).
On the ATC 5 level we get the structure given in
Fig. 6.
Extracting Information and Identifying Data Structures in Pharmacological Big Data using Gawk
391
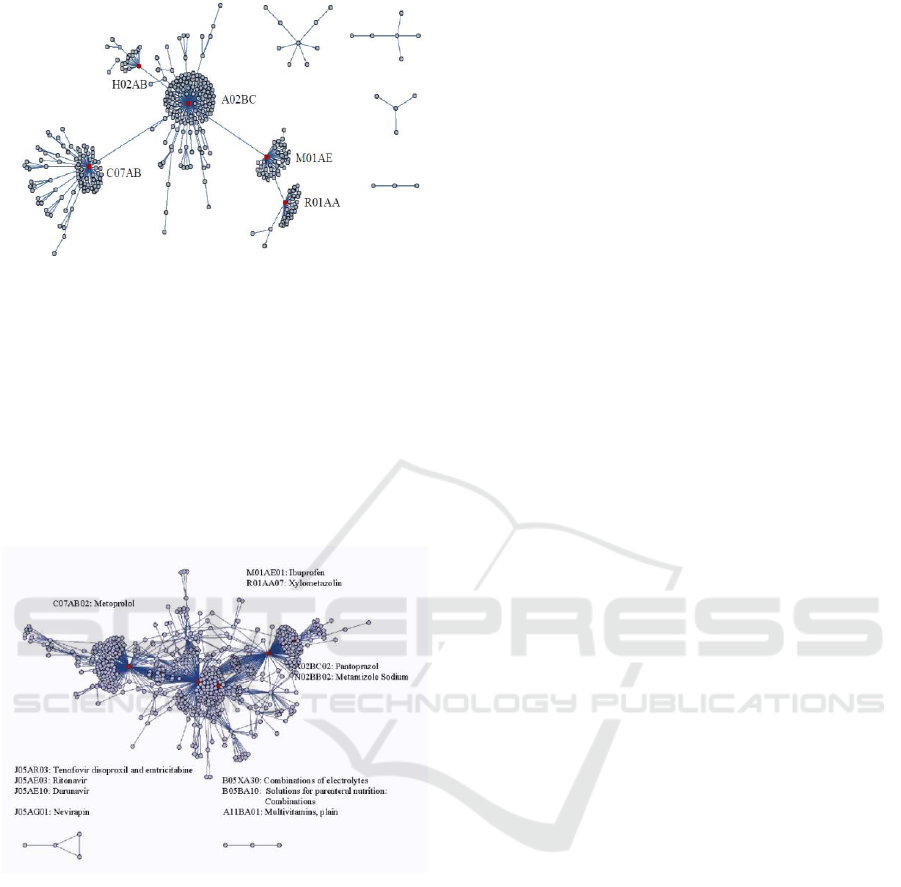
Figure 6: Neighbourhood graph with ATC-5-codes as
vertices and (directed) edges given other ATC-5-codes
with most common use by patients in a quarter (Abbrev.:
A02BC: Proton pump inhibitors C07AB: Beta blocking
agents, selective; M01AE: Propionic acid derivatives;
R01AA: Sympathomimetics, plain; H02AB:
Glucocorticoids).
In this case we have four small components and
the large componet again has 5 cental points. On the
ATC 7 level we get a graph remebering on cell
structures:
Figure 7: Neighbourhood graph with ATC-codes as
vertices and (directed) edges given other ATC-codes with
top two most common utilisations by patients in a quarter.
5 FURTHER DIRECTIONS
We want to remark a further application with high
practical potential with the use of gawk on several
different steps which uses primary prescription data
and a pharmacological data basis. With this
infrastructure, it is aimed to configure a password
protected information server to produce
parameterized prescription analysis for physicians to
be used for common consultations by a pharmacist
of the Statutory Health Organization and a physician
of the Association of Statutory Health Insurance
Physicians. Every year there are over 200 such
consultations in Schleswig-Holstein which are done
on a voluntary basis for the physicians. The
consulting manual is an Excel spreadsheet with 10 to
50 tables in dependence of the parameters. It is
generated using MySQL with the script language
Perl and the Perl module Write Excel. Gawk in this
case is first used in order to extract the relevant
information from the primary data a combining them
with pharmacological information as we have
considered in the examples above.
As stated in the context of the Priscus analysis
which is part of the advisory manual, the comparison
of a physician and his physician group is quite
important. The runtime results for the generation of
the manuals would be bad if we would repeat all
calculations for groups of physicians in every report
generation. Instead a pre-calculation using gawk is
run before importing the date into the MySQL data
base. A third application of gawk is used in order to
generate the structure of the SQL tables and in order
to generate the data import commands. Thereby
gawk is used to produce SQL program code.
6 DISCUSSION
In cases where the structure of traditional data
makes it difficult to handle data i.e. in terms of
relational database systems, special tools are needed
that can analyse large amounts of data in appropriate
time. Several tools like Hadoop (White, 2012) have
been introduced and analysed with respect to their
potential for handling such data structures (Khan et
al., 2014; Oussous et al., 2017). The Apache Hadoop
software library is a framework that allows for
distributed processing of large data sets across
clusters of computers using simple programming
models. Our point of view however consists in large
computations with low computing requirements on a
single machine but using adequate algorithms and
addressing special tasks to well adopted tools.
Our paper in particular aimed at showing the
potential of gawk as a tool to analyze big data in the
area of health services research. Iterated selection
aggregation and matching steps for reorganization of
data with gawk in this respect can do much more
than pre-processing. On the other hand algorithmic
steps as the determination of eigenvalues of matrices
and the calculation of connected components of
graphs as only two examples should not done in
gawk.
HEALTHINF 2018 - 11th International Conference on Health Informatics
392

However, for information extraction as a first
step or as a main solution before using a statistical
program gawk has an optimal position due to the
combination of big data processing and a short
implementation time (Bharathi et al., 2012).
In this paper we especially considered the
interaction of gawk and Mathematica by Wolfram
Research. Both programs have highly potential
methods with structural transformations and
calculations. If there are well identified
mathematical structures, Mathematica is the
preferable tool to use. An illustrative example for
this case is given by the calculation of the
eigenvalues and eigenvectors of high dimensional
matrices. In order to identify structures from real life
biomedical data gawk is much more powerful than
conventional approaches. Programming in gawk is
clearly advantageous in cases when they allow using
scripting elements and libraries which are not
available in AWK and can solve problems not
implemented in Mathematica. Examples for this are
partition problems of the considered graphs which
are nearby to NP-hard and NP-complete problems.
In such cases scripting programs position themselves
between AWK and Mathematica.
As mentioned in (Bharathi et al., 2012) there are
quite different aspects with respect to “big data”. As
an example big data in the context of image
processing differ much from big data in health care
context with quite different scales, different degrees
in accuracy and variability in time and different
frequencies (day, week, month, quarter, year,
decades) which should be taken into account when
analyzing data (Schuster, 2009).
Further research should address a comparison of
our solution with approaches based on the map-
reduce paradigm. In particular, Hadoop as already
mentioned is capable to rapidly process large data
sets in a distributed file environment and executes
tasks where data is stored. However, only less is
known about comparing their performance with
gawk. Although the Hadoop guide gives an
illustrative example in chapter 2 (White, 2012), it
might also be worth to think about potentials to
integrate gawk into such environments.
7 CONCLUSION
There are numerous tools nowadays for big data
analysis. Gawk as one of the oldest tools to analyze
big data still has a high potential in complex
situations of big data analysis. However, the
potential of combining programs with quite different
advantages in real life problems with optimal
interactions needs much more attention and further
analysis.
REFERENCES
Amann, U., Schmedt, N., Garbe, E. 2012. Prescribing of
potentially inappropriate medications for the elderly.
Age 65(69): 70-74.
Begoli, E. 2012. A short survey on the state of the art in
architectures and platforms for large scale data
analysis and knowledge discovery from data.
Proceedings of the WICSA/ECSA 2012: 177-183.
Bharathi, R., Keswani, N. N., Shinde, S. D. 2012. An
Approach to mining massive Data. Proceedings of the
MPGI National Multi Conference. International
Journal of Computer Applications: 32-36
Cao, L. 2016. Data science: nature and pitfalls. IEEE
Intelligent Systems 31(5): 66-75.
Cao, L., Fayyad, U. 2016. Data science: Challenges and
directions. Commun. ACM: 1-9.
Hassani, H., & Silva, E. S. 2015. Forecasting with big
data: A review. Annals of Data Science 2(1): 5-19.
Hu, H., Wen, Y., Chua, T. S., Li, X. 2014. Toward
scalable systems for big data analytics: A technology
tutorial. IEEE Access 2: 652-687.
Khan, N., Yaqoob, I., Hashem, I. A. T., Inayat, Z.,
Mahmoud Ali, W. K., Alam, M. 2014. Big data:
survey, technologies, opportunities, and challenges.
The Scientific World Journal, Article ID 712826.
Oussous, A., Benjelloun, F. Z., Lahcen, A. A., Belfkih, S.
2017. Big Data Technologies: A Survey. Journal of
King Saud University-Computer and Information
Sciences.
Pike, R., Dorward, S., Griesemer, R., Quinlan, S. 2005.
Interpreting the data: Parallel analysis with Sawzall.
Scientific Programming 13(4): 277-298.
Pohl-Dernick, K., Meier, F., Maas, R., Schöffski, O.,
Emmert, M. 2016. Potentially inappropriate
medication in the elderly in Germany: an economic
appraisal of the PRISCUS list. BMC health services
research 16(1): 109.
Press, G. 2013. A very short history of big data. Forbes
Tech Magazine, May, 9.
Robbins, A. 2011. GNU awk 4.0: teaching an old bird
some new tricks. Linux Journal 209: 5.
Schuster, R. 2009. Biomathematik, Stuttgart, Teubner-
Verlag.
Schuster, R. 2015: Graphentheoretische Analyse von
Vernetzungsstrukturen zwischen Wirkstoffen und
Wirkstoffgruppen in Bezug auf gleichzeitige
Verordnung beim Patienten. GAA. German Medical
Science.
Schuster, R., Schuster, M. 2015. Graphentheoretische
Analyse von Vernetzungsstrukturen im
vertragsärztlichen Sektor einer Region der
kassenärztlichen Vereinigung. German Medical
Science. DocAbstr. 202
Extracting Information and Identifying Data Structures in Pharmacological Big Data using Gawk
393

Shimono, T. 2016. A hacking toolset for big tabular files
(Codenames: Bin4tsv, Kabutomushi). Proceedings of
the IEEE International Conference on Big Data:
2902-2910.
Spinellis, D. 2017. A repository of Unix history and
evolution. Empirical Software Engineering: 1-33.
Wang, W., Krishnan, E. 2014. Big data and clinicians: a
review on the state of the science. JMIR medical
informatics 2(1): e1.
White, T. 2012. Hadoop: The definitive guide. Third
edition. O'Reilly Media, Inc.
Wünschiers, R. 2013. Awk. In: Computational Biology.
Springer Berlin Heidelberg: 197-254.
Wyber, R., Vaillancourt, S., Perry, W., Mannava, P.,
Folaranmi, T., & Celi, L. A. 2015. Big data in global
health: improving health in low-and middle-income
countries. Bulletin of the World Health Organization
93(3): 203-208.
HEALTHINF 2018 - 11th International Conference on Health Informatics
394
