
An Investigation of Signal Characteristics and T
1
Relaxation Time in
Brain MR Images of Young versus Old Healthy Adults
Hayriye Aktaş Dinçer
1
and Didem Gökçay
2
1
Department of Biomedical Engineering, Graduate School of Natural and Applied Sciences,
Middle East Technical University, Dumlupinar Bulvari, 06800 Ankara, Turkey
2
Department of Health Informatics, Informatics Institute, Middle East Technical University,
Dumlupinar Bulvari, 06800 Ankara, Turkey
Keywords: Brain Aging, Spin Lattice Relaxation Time (T
1
), T
1
Mapping, Signal-to-Noise Ratio (SNR), Contrast to Noise
Ratio (CNR), Gray-White Ratio (GWR), Segmentation.
Abstract: During healthy aging, the brain undergoes several structural changes such as atrophy and volumetric changes.
Although less evident, changes in tissue concentration also occur. Such differences in brain tissues introduce
prominent low contrast effects to the MRI images of the aging population, causing segmentation problems in
the data processing pipeline. Measures of tissue characteristics such as T
1
provide unique and complementary
information to widely used measures of brain signal characteristics. In this study, multiple Fast Low Angle
Shot (FLASH) images are collected for T
1
mapping of whole brains from young and old adults. Tissue signal
characteristics are evaluated on predefined regions and compared across Magnetization Prepared Rapid
Gradient Echo (MPRAGE) and T
1
maps. Additionally, segmentation performance is analyzed. As a result,
we found that T
1
maps are superior to MPRAGE protocol in terms of contrast, especially within sub-cortical
areas. Furthermore, degradation of grey-white-ratio (GWR) due to aging processes is observed to be less
pronounced in T
1
estimated whole brain images. Moreover, sensitivity of T
1
maps (54.6%) are higher than
MPRAGE images (34.4%) in detection of sub-cortical gray matter. In sum we concur that T
1
maps provide
better avenues to investigate age related morphological changes in the brain.
1 INTRODUCTION
Even in the absence of neurological disorder, aging
brains show alterations (Resnick et al., 2000;
Thambisetty et al., 2010). These age-dependent
alterations affect the imaging properties of the brains
(Salat et al., 2009). Revealing the alterations derived
from healthy aging provides crucial foundation for
understanding age related brain diseases (Tau and
Bradley, 2010).
Morphological changes in aging brains like brain
atrophy, reduction of grey matter (GM) and white
matter (WM), ventricular enlargement and decrease
of cortical thickness are well documented (Resnick et
al., 2000; Courchesne et al., 2000; Salat et al., 2004;
Ge et al., 2002). T
1
longitudinal relaxation time
provides valuable information about underlying
tissue microarchitecture. T
1
relaxation time is
affected by myelin and iron concentrations in brain
tissue. Increased demyelination elongates the T
1
value, while iron accumulation shortens it (Ogg and
Steen, 1998). Iron and manganese accumulation in
deep GM and WM demyelination and axonal loss are
common in aging brains. Hence these alterations can
influence T
1
relaxation time of the underlying tissue
and thereby imaging properties and contrast
(Desmond et al., 2016). This is an important problem
which distorts the diagnosis and segmentation
procedures. The signal alterations derived from aging
are less studied in literature. T
1
maps provide a more
robust template for morphometry studies like
segmentation and a more specific marker of disease
progression in comparison to conventional T
1
weighted images.
The aim of this work is to investigate signal
characteristics in young and old healthy brains using
conventional MR protocols, to decide whether T
1
weighted images or estimated T
1
maps provide better
image quality. 19 healthy volunteers were scanned
with MPRAGE and FLASH sequences, and then T
1
relaxation time of whole brain was mapped via
variable flip angle (VFA) method. In order to evaluate
Dinçer, H. and Gökçay, D.
An Investigation of Signal Characteristics and T
1
Relaxation Time in Brain MR Images of Young versus Old Healthy Adults.
DOI: 10.5220/0006570401470154
In Proceedings of the 11th International Joint Conference on Biomedical Engineering Systems and Technologies (BIOSTEC 2018) - Volume 4: BIOSIGNALS, pages 147-154
ISBN: 978-989-758-279-0
Copyright © 2018 by SCITEPRESS – Science and Technology Publications, Lda. All rights reserved
147

the image quality contrast, gray-white-ratio (GWR),
signal-to-noise ratio (SNR) and contrast-to-noise
ratio (CNR) were calculated on 5 predefined specific
Regions of Interest (ROI). Additionally, subcortical
area of MPRAGE and T
1
maps were segmented. The
performance of both images were presented as
sensitivity and specificity measurements.
2 METHOD
First of all, whole brain was scanned with MPRAGE
protocol. Then 4 brain images that adhered to the
same imaging coordinates with the MPRAGE
sequence were collected with FLASH sequence with
varying flip angles.
Afterwards whole brain T
1
maps were constructed
with the help of an in-house developed MATLAB
script. To be able to identify and compare signal
characteristics of MPRAGE and T
1
maps as well as
differences across young and old adults signal to
noise ratio (SNR), contrast to noise ratio (CNR) and
grey white ratio (GWR) are calculated for specific
landmarks.
Additionally, both MPRAGE and T
1
map images
were brain extracted via FSL BET (Brain Extraction
Tool) (Smith, 2002), then aligned to a standard
stereotaxic space and subcortical area were
segmented. Sensitivity and specificity of MPRAGE
and T
1
maps were evaluated and also segmentation
performance in both age group investigated.
2.1 Subject Profile
9 young (6 M, 3 F, age: 31.33±4.59) and 10 old (2 M,
8 F, age: 68.5±4.24) healthy volunteers participated.
The study has the ethics committee approval and all
participants signed informed consent. All of the
subjects were reported with no clinical evidence of
neurologic disease. Geriatric Depression Scale
(Ertan, 2000) was applied to old subjects (score:
8.2±3.65). Because of registration issues 1 young and
1 old participant were excluded from segmentation
analysis.
2.2 MR Acquisition
Total duration of data collection was about 30 min.
High resolution 3D MPRAGE images were obtained
via 3.0 Tesla Siemens Magnetom Trio MR Scanner at
the UMRAM MR Center in Bilkent University.
(TR=2500 ms, TE=3.16 ms, Bandwidth=199
Hz/Pixel, matrix 256*256, Slice Thickness 1 mm,
256 slices, FOV=256*256 (axial), Number of
Averages=1).
4 FLASH images were acquired with four
different flip angles (3˚, 5˚, 15˚, 30˚) (TR=20 ms,
TE=4.15 ms, Bandwidth=199 Hz/Pixel, matrix
256*256, Slice Thickness 3 mm, 44 slices,
FOV=256*256 (axial), Number of Averages=1).
We used standard MPRAGE and FLASH
protocols because they are widely available and allow
for estimation of T
1
tissue characteristics which we
wanted to investigate.
2.3 T
1
Mapping
The MR signal consists of several components. T1 is
the longitudinally decaying component with respect
to time in the MR signal. By estimating T
1
characteristics and using them instead of intensity
values, contrast between brain tissues can be
increased. Variable flip angle (VFA) method is used
for the purpose of T
1
mapping of whole brain such
that at least 3 images should be gathered with three
different contrasts. VFA approach was shown to be a
practical alternative to conventional methods,
providing better precision and speed.
One of the most suitable sequences for VFA
method is FLASH (Fischl, 2004). The intensity value
I(x,y,z) observed in the (x,y,z) voxel of a FLASH
image can be written in terms of tissue characteristics
and scanning parameters TR (repetition time), TE
(echo time), α (flip angle) as follows:
I(x,y,z)=
M
0
(x,y,z) e
-TE/T
2
*
sin(α)(1-e
-TR/T
1
))
(1-cos(α) e
-TR/T
1
)
(1)
The aim is to use the multiple FLASH images for
estimating T
1
tissue value voxelwise.
Then segmentation or other automatic image
processing procedures can be based on T
1
maps
instead of intensity value of the voxel. For really
small α values (e.g. α=3˚) cos(α) approaches to 1 and
the equation (1) can be reduced as follows (Buxton,
2002):
I(x,y,z)=M
0
(x,y,z) e
-TE/T
2
*
sin(α)
(2)
This way, the intensity value of α=3˚ image is
described as the constant c=M
0
(x,y,z) e
-TE/T
2
*
sin(3).
Therefore, the first part of the eq. (1) can be
determined just by using from the image with FA 3˚.
The remaining part of the equation is as follows:
I
α
(x,y,z)=
c(sin(α)/sin(3)) (1-e
-TR/T
1
))
(1-cos(α) e
-TR/T
1
)
(3)
BIOSIGNALS 2018 - 11th International Conference on Bio-inspired Systems and Signal Processing
148
In this equation, I
α
(x,y,z) is the intensity value with
5˚, 15˚ and 30˚ flip angles, respectively and c is
obtained from the image with α =3˚. Since TR is a
known parameter coming from scanning protocol, we
need to find T
1
value which is the only unknown
parameter by using 3 equations derived from 3
images which is an over-determined case. We can
compute the T
1
value with least squares estimation
method as follows:
According to literature T
1
ranges between 0-4000
ms. The intensity value for α=5˚, 15˚ and 30˚ is
computed based on eq. (3) for all of the candidate T
1
values. Then, computed theoretical I
α
for each T
1
and
measured real I
α
in image
is subtracted and squared.
The T
1
value of the I
α
which has the smallest error is
assigned as the T
1
value of that particular voxel (i.e.
LSE fit).
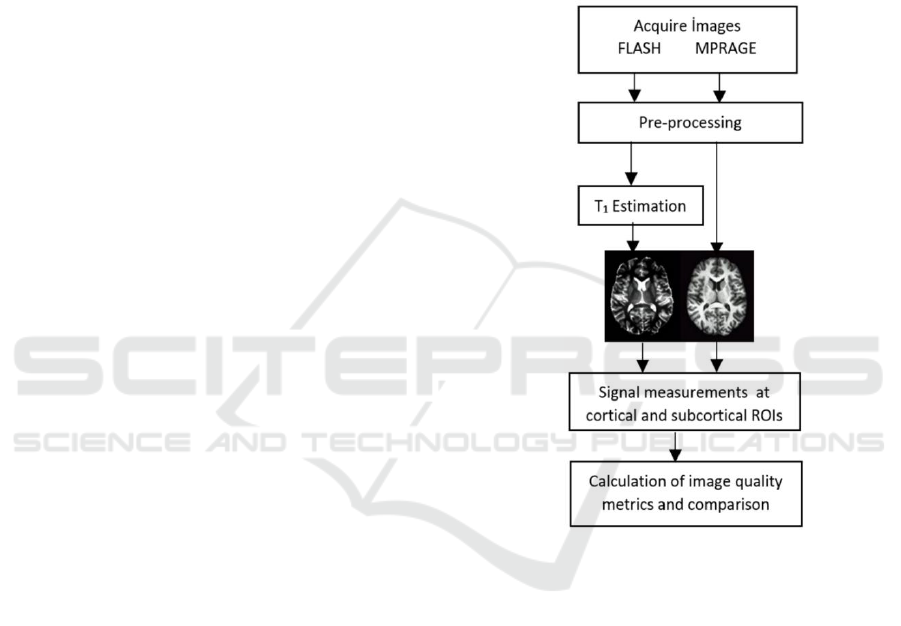
2.4 Overview of Data Processing
The image processing and signal evaluation pipeline
is depicted in Figure 1.
2.4.1 Pre-processing
First step of pre-processing is normalizing the
intensities of images acquired from different MRI
sequences.
Then, semi-automated removal of skull and non-
brain parts is performed using FSL’s brain extraction
tool (BET) with proper options which attempt to
reduce image bias, and residual neck voxels (Smith,
2002). This process provides a basis for a better
segmentation.
After brain extraction, FAST (FMRIB's
Automated Segmentation Tool) was used for
construction of the estimated restored input image
after correction for bias field as well as segmenting
the MPRAGE into GM, WM, and CSF classes
(Zhang et al., 2001). FSL has a superior segmentation
procedure for segmentation of sub-cortical area, but
this was not utilized in our study. FAST has the ability
to give an output per each tissue class and these are
binary images which will be used as a mask later.
However, since T
1
maps were synthetically produced,
package programs like FSL failed to produce
segmented volumes. Because of this problem, T
1
maps were segmented by manual thresholding. T
1
values reported in literature as follows: T
1WM
≤ 1074
ms, 1074≤T
1GM
≤1359 ms and 1400≤T
1CSF
≤4000 ms.
All of the images were registered to the standard
stereotaxic space (Talairach and Tournoux, 1988).
The brain volumes were warped (using 12-parameter
affine transform) to TT_N27+tlrc template volume.
Alignment of T
1
maps and MPRAGE images was
accomplished by using AFNI.
In order to obtain T
1
values of a specific brain
tissue type voxel-by-voxel arithmetic on 3D datasets
was calculated by using AFNI’s calculator program.
In our case, T
1
estimated image and GM mask were
multiplied. Hence the resulting image contains T
1
values belonging to only GM and everything else is
zero. The same procedure was repeated for all of the
three tissue types and average T
1
values of each one
were determined.
Figure 1: Image processing and signal evaluation pipeline.
2.4.2 Signal Measurements within ROIs
Two subcortical and three cortical GM landmarks
were defined to demonstrate age dependent
alterations in tissue characteristics. Cortical ROIs
were as follows: Rostral Medial Frontal Gyrus
(RMFG), crossing point of Superior Frontal Sulcus
and Pre-central Sulcus (SFPC), Posterior Central
Gyrus (PCG). Caudate and Putamen were chosen as
subcortical landmarks (Fig. 2). Also four adjacent
WM regions that are neighboring to defined GM
ROIs were specified to be able to study Gray-to-
White signal Ratios –GWR (adjacent regions were
chosen on purpose because they bear similar artefacts
based on flip angle inhomogeneity).
Caudate and Putamen are landmarks much
studied in T
1
mapping
literature. RMFG is an
important landmark which has a strong reduction in
An Investigation of Signal Characteristics and T
1
Relaxation Time in Brain MR Images of Young versus Old Healthy Adults
149

WM but not GM in aging (Salat et al., 2009). PCG is
a prominent structure in the parietal lobe at the
crossing of post-central and central sulci and the
primary sensory area of the cerebral cortex.
According to a study by Salat et al., (2009) the
superior frontal gyrus showed a remarkable signal
change with age.
Figure 2: Cortical and subcortical landmarks.
There are several different metrics from which
image quality can be inferred. In a high quality image,
the measured signal must be higher than noise, the
contrast between different tissue types should be high
and gray to white ratio should not be close to 1 so that
GM and WM structures are identifiable from each
other. During aging, these features should be
preserved, so that automated morphological analyses
derived from adult brains are applicable. Some
important metrics in this regard are defined as
follows.
Signal-to-Noise Ratio (SNR): SNR is calculated by
dividing the mean of tissue intensity to the standard
deviation of background noise (Lu, 2005)
(background noise is measured from Corpus
Callosum since its intensity distribution is
homogeneous).
SNR=S
MEAN
/SD
noise
(4)
Contrast-to-Noise Ratio (CNR): The CNR is a
combination of both contrast and SNR. The
difference between SNR values of two tissue types
gives information about CNR (Lu, 2005).
CNR=SNR
WM
-SNR
GM
(5)
Gray-to-White Ratio (GWR): GWR is the
proportion of the GM signal intensity to that of WM.
The power of this metric comes from the dependence
on only mean of the tissue signals, not noise.
GWR=S
GM
/S
WM
(6)
In the worst case, the intensities of two different
tissues would be equal and the GWR approximates to
1. The intensity characteristics of the MPRAGE and
T
1
maps are reversed (i.e. T
1CSF
≥ T
1GM
≥ T
1WM
, while
I
WM
≥ I
GM
≥ I
CSF
in MPRAGE). This situation requires
a normalization for measuring the absolute distance
of GWR from 1. The absolute distance from 1 gives
the information about the distinguishability of the
tissues and will be mentioned as ‘scaled GWR’ in the
rest of this article.
2.5 Sub-cortical Segmentation,
Sensitivity and Specificity
For the comparison of labels and evaluation of
segmentation performance Desai atlas (Destrieux et
al., 2010) is chosen. A dilated mask based on this atlas
is created for the subcortical structures including
Caudate, Putamen, Thalamus and Globus Pallidus.
The segmented GM volumes of MPRAGE and T
1
maps were multiplied by this mask and sensitivity and
specificity were calculated to evaluate if sub-cortical
GM is accurately measured.
True Positive Rate (Sensitivity): Sensitivity relates
to the ability of the segmented images to correctly
detect GM that is labelled as GM in the atlas. In other
words, sensitivity (TPR) of the segmentation is the
proportion of the voxels labelled as GM that is
labelled as GM in atlas, expressed as follows:
Sensitivity =
number of TP
number of TP+ number of FN
(7)
True Negative Rate (Specificity): Specificity (TNR)
relates to the segmentation’s ability to correctly reject
voxels that are not labelled as GM in atlas.
Mathematical formulation is as follows:
Specificity =
number of TN
number of TN + number of FP
(8)
3 RESULTS
3.1 Signal Characteristics
For signal measurements, average values of the ROIs
are compared between subject groups via repeated
measures ANOVA. The outcomes are presented
graphically in Figure 3.
3.1.1 GWR Cortical Measurements
There is a significant main effect of image type on
GWR (F (1, 15) = 156.073, p<.001, η
p
2
=.912). T
1
maps have a higher scaled GWR corresponding to a
better contrast (M=2.323, SE=.130) than MPRAGE
images (M=.737, SE= .130). However, GWR did not
BIOSIGNALS 2018 - 11th International Conference on Bio-inspired Systems and Signal Processing
150

differ significantly between young and old subjects.
The interaction between age and image type also did
not differ significantly.
3.1.2 GWR Subcortical Measurements
There is a significant main effect of image type on
GWR (F (1, 15) = 426.150, p<.001, η
p
2
=.966). T
1
maps have a higher scaled GWR corresponding to a
better contrast (M=1.392, SE=.005) than MPRAGE
images (M=.753, SE= .032). However, GWR did not
differ significantly between young and old subjects.
The interaction between age and image type also did
not differ significantly.
3.1.3 SNR Cortical Measurements
There is a marginally significant main effect of image
type on SNR (F (1, 15) = 4.281, p=.056, η
p
2
=.222). T
1
maps have a higher SNR (M=28.298, SE=4.264) than
MPRAGE images (M=18.517, SE=1.66).
Additionally, SNR differs significantly between
young (M=28.608, SE=3.218) and old subjects
(M=18.207, SE=3.034) (F (1, 15) = 5.531, p<.05,
η
p
2
=.269). The interaction between age and image
type did not differ significantly.
3.1.4 SNR Subcortical Measurements
There is no significant main effect of image type on
SNR. However, SNR differs significantly between
young (M=34.362, SE=4.130) and old subjects
(M=18.870, SE=3.894) (F (1, 15) = 7.448, p<.05,
η
p
2
=.332). The interaction between age and image
type did not differ significantly.
3.1.5 CNR Cortical Measurements
There is a significant main effect of image type on
CNR (F (1, 15) = 11.102, p<.01, η
p
2
=.425). T
1
maps
have a higher CNR (M=16.043, SE=2.618) than
MPRAGE images (M=6.900, SE=.439).
Additionally, CNR differs significantly between
young (M=15.637, SE=1.864) and old subjects
(M=7.306, SE=1.757) (F (1, 15) = 10.578, p<.01, η
p
2
=.414). The interaction between age and image type
did not differ significantly.
3.1.6 CNR Subcortical Measurements
There is no significant main effect of image type on
CNR. However, CNR differs significantly between
young (M=10.384, SE=1.118) and old subjects
(M=5.449, SE=1.055) (F (1, 15) = 10.310, p<.01,
η
p
2
=.407). The interaction between age and image
type did not differ significantly.
3.2 Segmentation
In Figure 4, TPR and TNR are overlaid to T
1
maps
and MPRAGE images of young and old exemplar
participants. While TNR looks like similar in both
segmented images, TPR is better in T
1
maps.
Although segmentation of T
1
maps is conducted
through a crude method (i.e. thresholding),
segmentation of MPRAGE images failed to detect
some important subcortical structures like putamen
and thalamus.
3.2.1 True Positive Rate (Sensitivity)
Image type has a significant main effect on the True
Positive Rate (TPR) (F(1,15)=111.892, p<.001,
η
p
2
=.882). The sensitivity of T
1
maps (M=.546,
SE=.012) is higher than MPRAGE (M=.344,
SE=.012). There is no interaction between image type
and age. There is no significant difference between
young and old subjects’ sensitivity (Figure 5 a).
3.2.2 True Negative Rate (Specificity)
Image type does not significantly affect the True
Negative Rate (TNR). There is no interaction
between image type and age. There is no significant
difference between young and old subjects’
specificity (Figure 5 b).
3.3 Comparison of T
1
across Age
Groups
To investigate T
1
spin-lattice relaxation time
alterations through aging, all of the five GM
landmarks (Table 1) and four adjacent WM (Table 2)
were evaluated in both old and young subjects. T
1
values between two populations were tested with
independent samples t-test and the outcomes are
summarized in the following tables. T
1
prolongation
with aging was an expected result, hence all of the
GM structures except for posterior central gyrus,
adjacent WM between caudate and putamen and
adjacent WM to RMGF showed prolonged values
with increasing age (p≤.05). We found that average
T
1
value of young subjects is 605±129 ms for WM
and 1147.4±194 ms for GM. Estimated T
1
value for
olds is and 733±141 ms 1399.4±135 ms for GM.
An Investigation of Signal Characteristics and T
1
Relaxation Time in Brain MR Images of Young versus Old Healthy Adults
151

Table 1: Statistics of GM ROIs in perspective of Spin-
Lattice Relaxation Time (T
1
) (ms).
ROI
Age
Mean±
Std. Err
t
p
Caudate
Young
1213±32
2.226
.040
Old
1331±41
Putamen
Young
1220±24
2.423
.027
Old
1339±41
RMFG
Young
895±111
4.048
.001
Old
1593±129
PCG
Young
1438±124
1.413
.176
Old
1221±95
SFPC
Young
971±86
3.807
.001
Old
1513±110
(RMFG: Rostral middle frontal gyrus, PCG: Posterior-central
gyrus, SFPC: crossing point of Superior Frontal Sulcus and Pre-
central Sulcus).
Table 2: Statistics of WM ROIs in perspective of Spin-
Lattice Relaxation Time (T
1
) (ms).
ROI
Age
Mean± Std.
Err
t
p
CP adj. WM
Young
848±21
3.500
.003
Old
979±30
RMFG adj.
WM
Young
579±70
2.271
.036
Old
758±40
PCG adj. WM
Young
517±51
-.565
.579
Old
565±65
SFPC adj. WM
Young
480±66
1.932
.070
Old
633±47
(CP adj. WM: Adjacent WM between caudate and putamen,
RMFG adj. WM: Adjacent WM to RMGF, PCG adj. WM:
Adjacent WM to PCG, SFPC adj. WM: Adjacent WM to SFPC).
4 DISCUSSION AND
CONCLUSION
Standard MRI sequences are composed of multiple
MR tissue properties such as T
1
and T
2
relaxation
times prohibiting direct mapping from pixel intensity
to tissue classification. This study demonstrated that
usage of intrinsic tissue parameters such as T
1
spin-
lattice relaxation time instead of tissue signal
intensities produces a more valid metric to detect age-
related microstructural changes in healthy ageing
providing a better scaffold for tissue segmentation.
Unfortunately, small sample size is an important
limitation of our study. The following interpretations
and conclusions should be considered bearing this
limitation in mind.
In our study, estimated T
1
values are consistent
with literature (Lu et al., 2005; Marques et al., 2010;
Deoni et al., 2005; Okubo et al., 2017). A future study
can be conducted to determine the accuracy of
FLASH images in estimating T
1
maps in comparison
to MP2RAGE images. Interestingly, our findings
with respect to prolongation of T
1
in aging agree with
only some studies (Cho et al., 1997), while contradict
with others (Saito et al., 2009; Gracien et al., 2017).
A recent study demonstrated that age-related changes
in T
1
relaxation time vary by location in deep GM
(Okubo et al., 2017). When the relationship between
T
1
prolongation, axonal loss (van Waesberghe et al.,
1999) and demyelination of WM is considered,
interpretation of interpretation of the discrepancies of
T1 values in the aging brain becomes a hard problem.
Conducting a longitudinal study instead of cross-
sectional might provide valuable information since T
1
mapping is sensitive to age-related microstructural
changes.
Additionally, the characterization of signal
changes in healthy aging provides important
information that is complementary to morphometric
studies of regional brain volumes (Davatzikos and
Resnick, 2002). In segmentation analysis, T
1
maps
have definitely better sensitivity (54.6%) than
MPRAGE images (34.4%) although specificity did
not differ significantly between two images. As future
work, segmentation of T
1
maps can be evaluated with
modern segmentation methods so that the utilities
provided by T
1
mapping in the aging brain becomes
obvious.
In terms of signal calculations GWR computation
has several advantages over other signal
computations: For both cortical and subcortical areas,
T
1
maps are inarguably better than MPRAGE.
Furthermore, in T
1
maps, signal characteristics did
not degrade in the aged population. For other
measures such as SNR and CNR, T
1
maps have
superiority compared to MPRAGE on cortical level.
Unfortunately, both SNR and CNR revealed
degradation through.
Overall, for several signal characteristics, T
1
maps
have better quality because unlike conventional MR
protocols, the signal quality does not degrade over
aging.
BIOSIGNALS 2018 - 11th International Conference on Bio-inspired Systems and Signal Processing
152
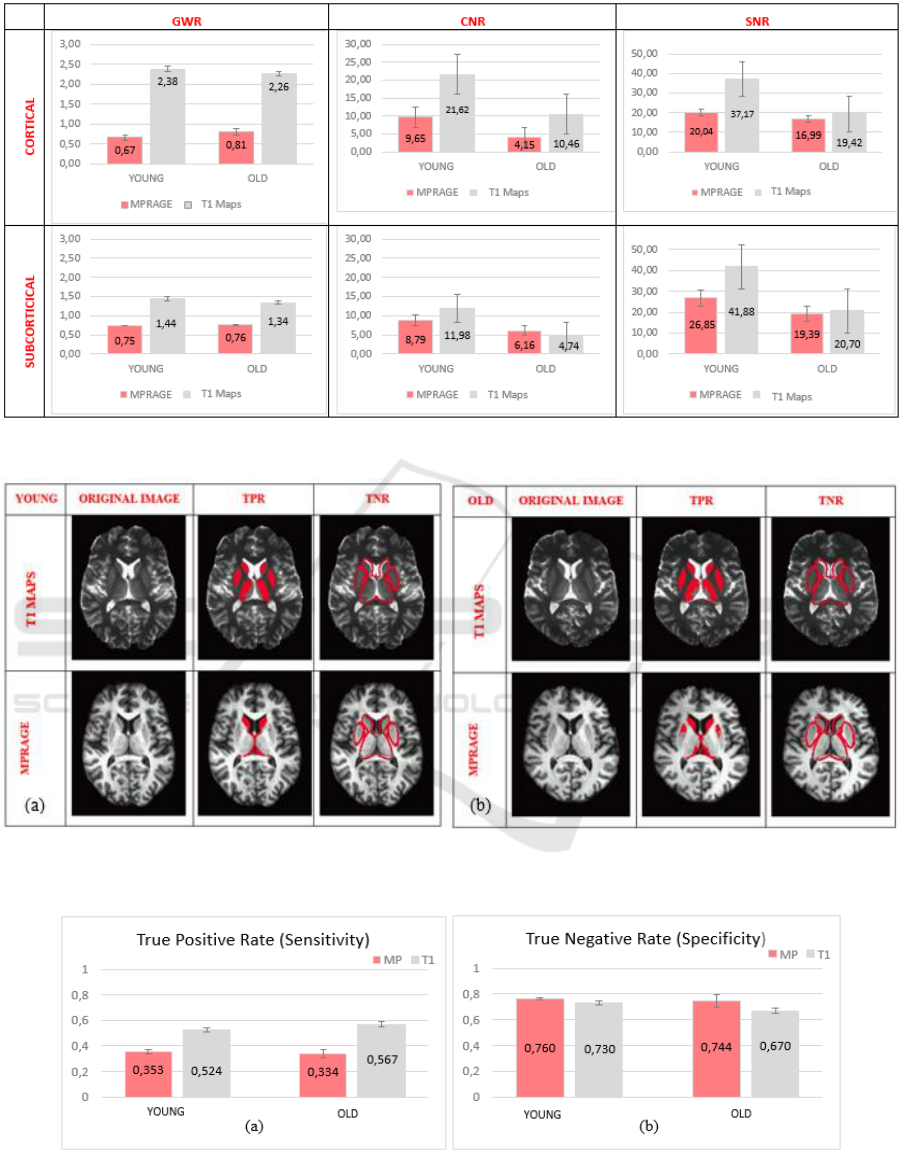
Figure 3: Comparison of GWR, CNR and SNR of young and old population as well as image type (MPRAGE vs T
1
maps).
Figure 4: Comparison of gray matter segmentation performance of MPRAGE and T
1
maps, sensitivity and specificity
measures of a young (a) and old (b) subject.
Figure 5: Sensitivity (a) and Specificity (b) values of both populations and image types (MP: MPRAGE, T1: T
1
map.
An Investigation of Signal Characteristics and T
1
Relaxation Time in Brain MR Images of Young versus Old Healthy Adults
153

REFERENCES
Buxton, R. B. (2009). Introduction to functional magnetic
resonance imaging: principles and techniques.
Cambridge university press.
Cho, S., Jones, D., Reddick, W. E., Ogg, R. J., & Steen, R.
G. (1997). Establishing norms for age-related changes
in proton T1 of human brain tissue in vivo. Magnetic
resonance imaging, 15(10), 1133-1143.
Courchesne, E., Chisum, H. J., Townsend, J., Cowles, A.,
Covington, J., Egaas, B.& Press, G. A. (2000). Normal
brain development and aging: quantitative analysis at in
vivo MR imaging in healthy volunteers. Radiology,
216(3), 672-682.
Davatzikos, C., & Resnick, S. M. (2002). Degenerative age
changes in white matter connectivity visualized in vivo
using magnetic resonance imaging. Cerebral cortex,
12(7), 767-771.
Deoni, S. C., Peters, T. M., & Rutt, B. K. (2005). High‐
resolution T1 and T2 mapping of the brain in a
clinically acceptable time with DESPOT1 and
DESPOT2. Magnetic resonance in medicine, 53(1),
237-241.
Desmond, K. L., Al‐Ebraheem, A., Janik, R., Oakden, W.,
Kwiecien, J. M., Dabrowski, W. & Bock, N. A. (2016).
Differences in iron and manganese concentration may
confound the measurement of myelin from R1 and R2
relaxation rates in studies of dysmyelination. NMR in
Biomedicine, 29(7), 985-998.
Destrieux, C., Fischl, B., Dale, A., & Halgren, E. (2010).
Automatic parcellation of human cortical gyri and sulci
using standard anatomical nomenclature. Neuroimage,
53(1), 1-15.
Ertan, T., & Eker, E. (2000). Reliability, validity, and factor
structure of the geriatric depression scale in Turkish
elderly: are there different factor structures for different
cultures?. International Psychogeriatrics, 12(2), 163-
172.
Fischl, B., Salat, D. H., van der Kouwe, A. J., Makris, N.,
Ségonne, F., Quinn, B. T., & Dale, A. M. (2004).
Sequence-independent segmentation of magnetic
resonance images. Neuroimage, 23, S69-S84.
Ge, Y., Grossman, R. I., Babb, J. S., Rabin, M. L., Mannon,
L. J., & Kolson, D. L. (2002). Age-related total gray
matter and white matter changes in normal adult brain.
Part I: volumetric MR imaging analysis. American
journal of neuroradiology, 23(8), 1327-1333.
Gracien, R. M., Nürnberger, L., Hok, P., Hof, S. M., Reitz,
S. C., Rüb, U. & Baudrexel, S. (2017). Evaluation of
brain ageing: a quantitative longitudinal MRI study
over 7 years. European radiology, 27(4), 1568-1576.
Lu, H., Nagae‐Poetscher, L. M., Golay, X., Lin, D.,
Pomper, M., & van Zijl, P. (2005). Routine clinical
brain MRI sequences for use at 3.0 Tesla. Journal of
Magnetic Resonance Imaging, 22(1), 13-22.
Marques, J. P., Kober, T., Krueger, G., van der Zwaag, W.,
Van de Moortele, P. F., & Gruetter, R. (2010).
MP2RAGE, a self bias-field corrected sequence for
improved segmentation and T 1-mapping at high field.
Neuroimage, 49(2), 1271-1281.
Ogg, R. J., & Steen, R. G. (1998). Age‐related changes in
Brain T1 are correlated with iron concentration.
Magnetic resonance in medicine, 40(5), 749-753.
Okubo, G., Okada, T., Yamamoto, A., Fushimi, Y., Okada,
T., Murata, K., & Togashi, K. (2017). Relationship
between aging and T1 relaxation time in deep gray
matter: A voxel‐based analysis. Journal of Magnetic
Resonance Imaging.
Resnick, S. M., Goldszal, A. F., Davatzikos, C., Golski, S.,
Kraut, M. A., Metter, E. J., ... & Zonderman, A. B.
(2000). One-year age changes in MRI brain volumes in
older adults. Cerebral cortex, 10(5), 464-472.
Saito, N., Sakai, O., Ozonoff, A., & Jara, H. (2009). Relaxo-
volumetric multispectral quantitative magnetic
resonance imaging of the brain over the human lifespan:
global and regional aging patterns. Magnetic resonance
imaging, 27(7), 895-906.
Salat DH, Buckner RL, Snyder AZ, Greve DN, Desikan RS,
Busa E, Morris JC, Dale AM, and Fischl B. (2004).
Thinning of the cerebral cortex in aging. Cereb. Cortex
Salat, D. H., Lee, S. Y., Van der Kouwe, A. J., Greve, D.
N., Fischl, B., & Rosas, H. D. (2009). Age-associated
alterations in cortical gray and white matter signal
intensity and gray to white matter contrast.
Neuroimage, 48(1), 21-28.
Smith, S. M. (2002). Fast robust automated brain
extraction. Human brain mapping, 17(3), 143-155.
Stikov, N., Boudreau, M., Levesque, I. R., Tardif, C. L.,
Barral, J. K., & Pike, G. B. (2015). On the accuracy of
T1 mapping: searching for common ground. Magnetic
resonance in medicine, 73(2), 514-522.
Talairach J, Tournoux P (1988). Co-planar stereotaxic atlas
of the human brain. Thieme, New York.
Tau, G. Z., & Peterson, B. S. (2010). Normal development
of brain circuits. Neuropsychopharmacology, 35(1),
147-168..
Thambisetty, M., Wan, J., Carass, A., An, Y., Prince, J. L.,
& Resnick, S. M. (2010). Longitudinal changes in
cortical thickness associated with normal aging.
Neuroimage, 52(4), 1215-1223.
Van Waesberghe, J. H. T. M., Kamphorst, W., De Groot, C.
J., Van Walderveen, M. A., Castelijns, J. A., Ravid, R.
& Barkhof, F. (1999). Axonal loss in multiple sclerosis
lesions: magnetic resonance imaging insights into
substrates of disability. Annals of neurology, 46(5),
747-754.
Wansapura, J. P., Holland, S. K., Dunn, R. S., & Ball, W.
S. (1999). NMR relaxation times in the human brain at
3.0 tesla. Journal of magnetic resonance imaging, 9(4),
531-538.
Zhang, Y., Brady, M., & Smith, S. (2001). Segmentation of
brain MR images through a hidden Markov random
field model and the expectation-maximization
algorithm. IEEE transactions on medical imaging,
20(1), 45-57.
BIOSIGNALS 2018 - 11th International Conference on Bio-inspired Systems and Signal Processing
154
