
Design and Evolution of an Opto-electronic Device for VOCs
Detection
Ana Carolina Pádua
1
, Susana Palma
1
, Jonas Gruber
2
, Hugo Gamboa
3
and Ana Cecília Roque
1
1
UCIBIO, REQUIMTE, Departamento de Química, Faculdade de Ciências e Tecnologia da
Universidade NOVA de Lisboa, 2829-516 Caparica, Portugal
2
Departamento de Química Fundamental, Instituto de Química da Universidade de São Paulo,
Av. Prof. Lineu Prestes, 748 CEP 05508-000, São Paulo, SP, Brasil
3
Laboratório de Instrumentação Engenharia Biomédica e Física da Radiação (LIBPhys-UNL),
Departamento de Física, Faculdade de Ciências e Tecnologia da Universidade NOVA de Lisboa,
Monte da Caparica, 2829-516 Caparica, Portugal
Keywords: Device, Electronic-nose, Gas Sensing, Volatile Organic Compounds.
Abstract: Electronic noses (E-noses) are devices capable of detecting and identifying Volatile Organic Compounds
(VOCs) in a simple and fast method. In this work, we present the development process of an opto-electronic
device based on sensing films that have unique stimuli-responsive properties, altering their optical and
electrical properties, when interacting with VOCs. This interaction results in optical and electrical signals that
can be collected, and further processed and analysed. Two versions of the device were designed and
assembled. E-nose V1 is an optical device, and E-nose V2 is a hybrid opto-electronic device. Both E-noses
architectures include a delivery system, a detection chamber, and a transduction system. After the validation
of the E-nose V1 prototype, the E-nose V2 was implemented, resulting in an easy-to-handle, miniaturized and
stable device. Results from E-nose V2 indicated optical signals reproducibility, and the possibility of coupling
the electrical signals to the optical response for VOCs sensing.
1 INTRODUCTION
The interest in odours detection is common in several
areas, namely in food quality, environmental
protection, and medical diagnosis. Volatile organic
compounds (VOCs) can be regarded as indicators of
food spoilage, presence of hazardous gases in the air,
and even certain diseases when found in some
biological samples.
Electronic noses (E-noses) can be used to detect
and identify VOCs in a fast and automated manner.
Since their invention (Wilkens and Hartman, 1964),
many were developed and optimized for diverse
applications (Zohora et al., 2016). During the 80s, E-
noses were defined as instruments which included an
array of heterogeneous electrochemical gas sensors
with partial specificity and a pattern recognition
system (Persaud and Dodd, 1982; Llobet et al., 1999).
However, this definition has been broadening along
the time. In the last years, the term E-nose has been
used to mention gas sensors that alter their properties,
in consequence of changes in a gaseous atmosphere.
Generally, the E-noses architecture is similar to
the human olfactory system (Gutierrez and Horrillo,
2014). They comprise of a delivery system that
transfers the air to be analysed from the headspace of
a sample chamber to a detection chamber, like the air
circulating in the nasal cavities; Inside the detection
chamber, an array of heterogeneous gas sensors with
partial specificity and selectivity mimics the odorant
receptors, and their interaction with the VOCs; and a
signal processing unit with pattern recognition
methods have the same function that the olfactory
bulb and the brain have in odours recognition.
Currently, there are some commercial products
based on E-nose technology, suitable for a wide range
of applications. For instance, The eNose company is
mainly focused on applications for medical research,
namely for differentiating head and neck carcinoma
from lung carcinoma (van Hooren et al., 2016), and
for diagnosis of bacterial and viral infections in
obstructive pulmonary disease (van Geffen, Bruins
and Kerstjens, 2016). Breathtec Biomedical, Inc. is
interested in early screening of diseases such
48
Pádua, A., Palma, S., Gruber, J., Gamboa, H. and Roque, A.
Design and Evolution of an Opto-electronic Device for VOCs Detection.
DOI: 10.5220/0006558100480055
In Proceedings of the 11th International Joint Conference on Biomedical Engineering Systems and Technologies (BIOSTEC 2018) - Volume 1: BIODEVICES, pages 48-55
ISBN: 978-989-758-277-6
Copyright © 2018 by SCITEPRESS – Science and Technology Publications, Lda. All rights reserved
as cancer, tuberculosis, and diabetes. Peres offers a
product to evaluate food quality. Sensigent, Sacmi,
and AIRSENSE Analytics developed very versatile E-
noses for environmental protection, security
screening and quality control that benefit from the use
of customizable sensor modules, and pattern
recognition methods based on machine learning
algorithms. Nano Mobile Healthcare is developing a
technology from NASA, not only for aerospace safety,
but also for medical diagnosis and road security. And,
CSIRO is creating a biosensor with numerous
possible applications.
The sizes of commercial E-noses range from
desktop, to laptop or hand size. The sensing materials
also vary, being the most common metal oxides
(Barsan, Koziej and Weimar, 2007; Mirzaei,
Leonardi and Neri, 2016), and polymers (Li, 2009).
Other arrays based on metals (Gutmacher et al.,
2011), nanoporous pigments/dyes (Feng et al., 2010),
nanostructures (Jing Kong et al., 2000) and liquid
crystals (Boden et al., 1999) have also been used for
gas sensing.
2 SENSING MATERIALS
Our research group has developed a new class of
sensing gels for gas sensing. These materials possess
enormous versatility and have unique stimuli-
responsive properties, altering their optical and
electrical properties when interacting with VOCs
(Hussain et al., 2017). The sensing gels are composed
of liquid crystal (LC) droplets self-assembled in the
presence of ionic liquid, dispersed inside a
biopolymer matrix.
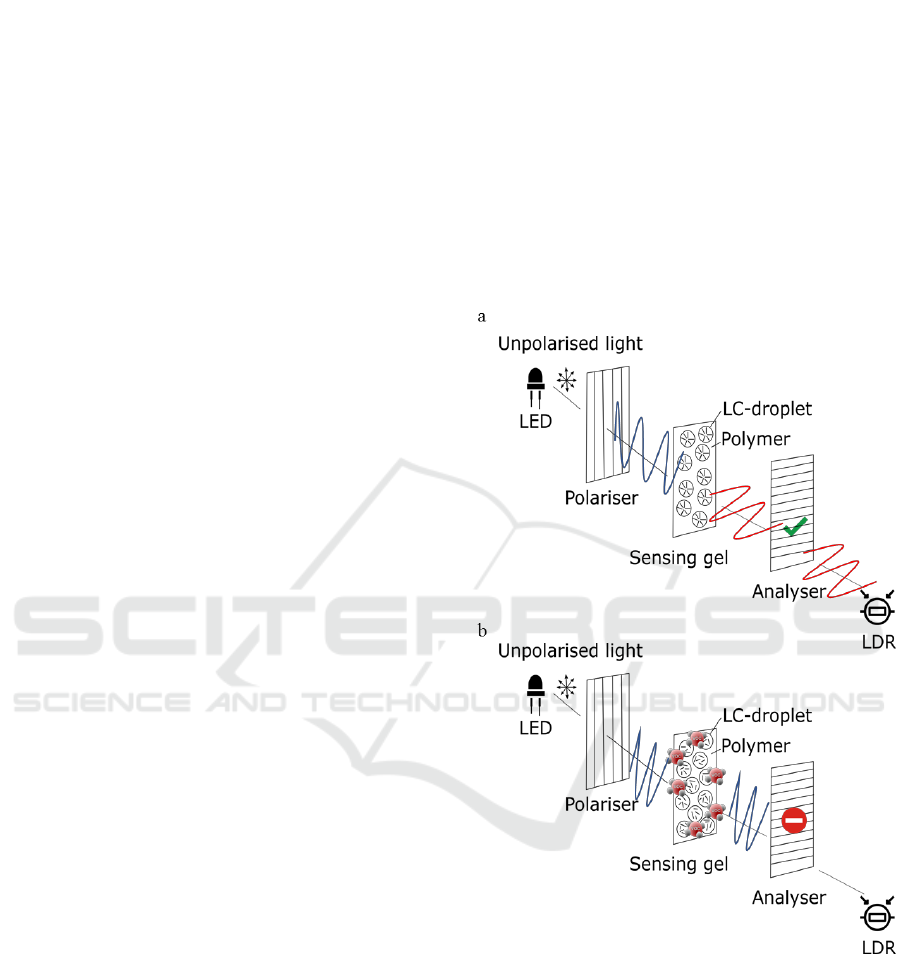
The way the sensing gels alter their optical
properties relies on the way light propagates through
nematic liquid crystals, which typically produce a 90-
degree shift in light polarisation. Hence, having the
sensing films sandwiched between two crossed
polarising filters, it is possible to observe changes in
light polarisation, when in the presence or absence of
VOCs.
Light-emitting diodes (LEDs) are sources of
unpolarised light. When the emitted light passes
through the first polariser, only light polarised along
the y-axis can pass. Next, the light passes through the
second polariser (called the analyser), which only
allows light polarised along the x-axis to pass.
Therefore, the light that pass through the analyser is
minimal, since there is negligible light polarised
along the x-axis emerging from the polariser.
However, if a glass slide with the sensing gel
spread on it (which has nematic LC in its
composition) is placed between the polariser and the
analyser, the anisotropy of the nematic LC, produces
a shift in the light polarised along the y-axis (that
comes from the first polariser). This way, part of that
light becomes polarised along the x-axis. Therefore,
the light can pass though the analyser, and be detected
by the light-dependent-resistor (LDR) - Figure 1 (a).
In the presence of VOCs, the LCs change their
configuration from radial to isotropic. Thus, the light
polarised along the y-axis, even passing through the
gel, maintains the polarisation, and so is blocked by
the analyser - Figure 1 (b). Hence, minimal light
intensity reaches the LDR.
Figure 1: (a) The light emitted by the LED achieves the
LDR when no VOCs are interacting with the sensing gel;
(b) and is blocked when VOCs are interacting with the
sensing gel.
Regarding the electrical effects, the sensing gels
exhibit high conductivity in the absence of VOCs. On
the contrary, when interacting with VOCs their
conductivity decreases (Hussain et al., 2017).
To explore the application of these gels for gas
sensing, our research group is developing an
electronic nose (E-nose). If the interaction dynamics
of distinct VOCs with the sensing gels vary, different
Design and Evolution of an Opto-electronic Device for VOCs Detection
49
optical and electrical signals will be obtained. This
brings the possibility of VOCs detection and
identification in a simple and rapid manner. The final
goal is to achieve an accurate, miniaturized and
scalable device that could run the analysis
automatically.
3 DESIGN AND ASSEMBLY OF
DEVICE VERSIONS
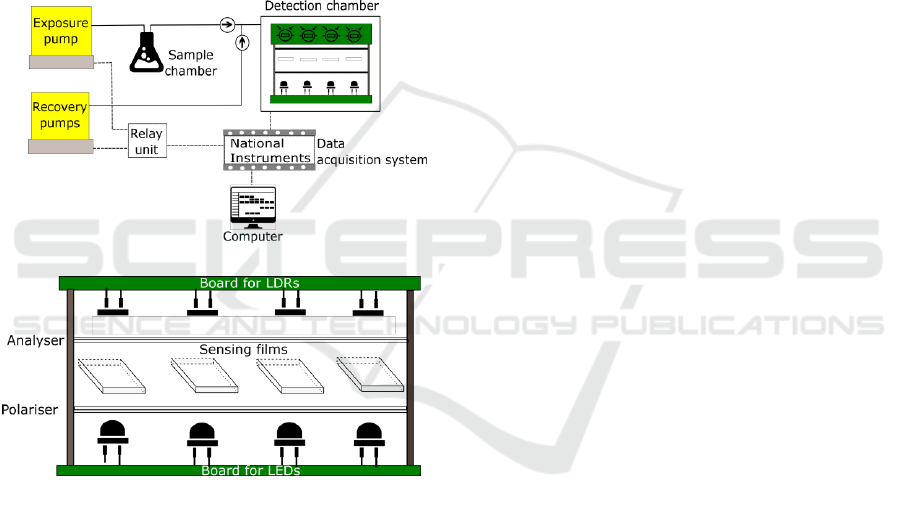
The first prototype of E-nose, called the E-nose V0,
is shown in Figure 2 (a). The apparatus is composed
of a detection chamber, a delivery system, and a
transduction system.
Figure 2: (a) Schematic of E-nose V0 and (b) detection
chamber.
The delivery system includes the air pumps
(exposure and recovery pumps), the sample chamber,
tubes and connectors, and two non-return valves to
prevent back-flow. The Exposure pump is responsible
for carrying the VOCs from the sample chamber
(where is the chemical solution) to the detection
chamber. Therefore, it is ON in the exposure periods
and OFF in the recovery periods. The recovery
system is composed of two air pumps which clean the
detection chamber, making the atmospheric air
circulate through the chamber, and removing the
VOCs. Some tubes were longer than necessary, which
resulted in higher exposure and recovery times
required for the experiments. Moreover, the area of
the liquid-gas surface inside the sample chamber was
changing for different volumes of solvent, due to its
tapered configuration.
The detection chamber – Figure 2 (b) - is the E-
nose component where the VOCs interact with the
sensing materials. It contains an array of four optical
sensors able to detect those interactions. For each
optical sensor, the unpolarised light emitted by the
LED pass through a sensing film sandwiched between
two crossed polarising filters (polariser and analyser),
and finally reaches the photo detector. Photo resistors,
photo diodes or photo transistors could have been
used as photo detectors. Our choice was the use of
light dependent resistors (whose resistance decrease
with increasing incident light) because they are the
most commonly used photo detectors, and could be
used in a very simple circuit (based on voltage
dividers). Moreover, LDRs are cheap, readily
available in many sizes and shapes, and need low
power and voltage for operation. Regarding the
electronic components, since the LEDs and LDRs
have some variations inherent to their own
production, signals calibration is an important issue.
Additionally, interference between optical sensors
was observed in the signals response, because the
LDRs of the optical pairs were not only receiving
light from the LED in front, but also from the LEDs
in the surroundings. Variations in the sensing films’
exposed areas to light also resulted in unstable
responses, given that the sensing gels were not
homogeneously spread over all the parts of the glass
slides. The first prototype also suffered difficulties to
handle and it had air leaks in the tube connectors.
The transduction system was based on a National
Instruments board, which acquired the data generated
by the LDRs. The collected signals were sent to a
computer and could be visualized in a LabVIEW
interface. Additionally, the exposure and recovery
times were defined as LabVIEW inputs. The board
used a 5 V to trigger the relay switch unit, which in
turn determined the exposure and recovery pump
states. In some situations, the noise was too high,
inhibiting the observation of the sensor response.
Besides, the hardware and software used were both
expensive. We concluded that the construction of a
new cheaper and controllable transduction system
could help solving these problems.
3.1 Optical E-nose V1
The schematic of the optical E-nose V1, which
resulted from improvements made in E-nose V0, is
represented in Figure 3.
b
a
BIODEVICES 2018 - 11th International Conference on Biomedical Electronics and Devices
50
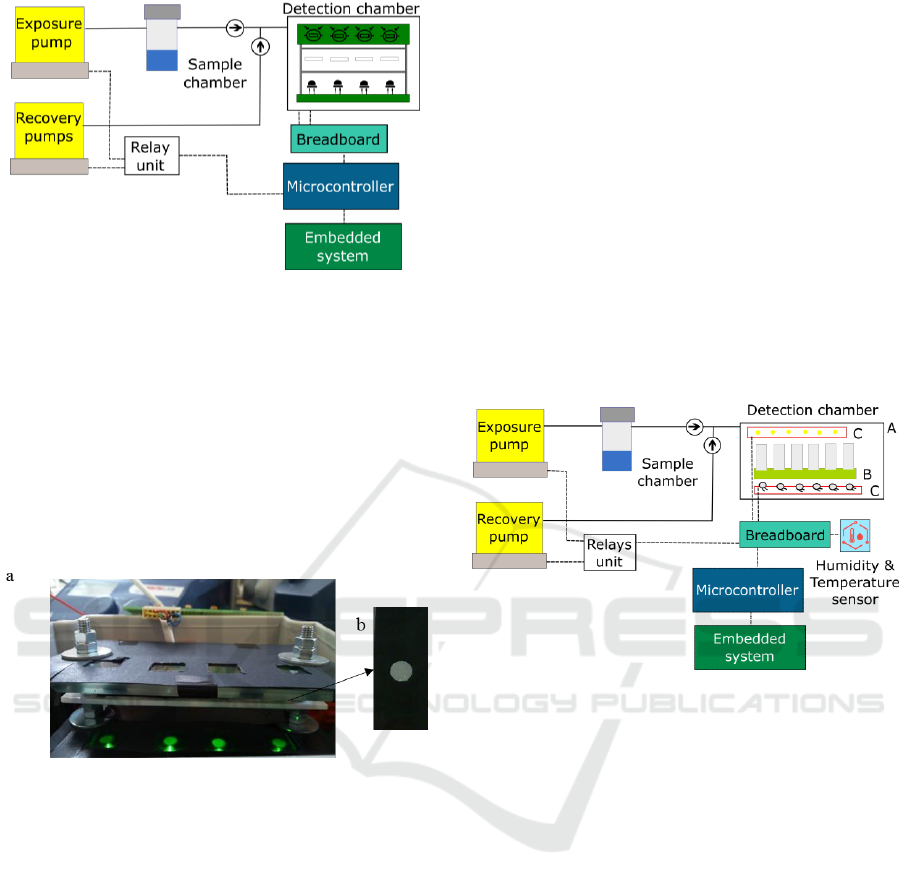
Figure 3: Schematic of E-nose V1.
A new detection chamber, easier to handle, was
assembled for E-nose V1. Inside it, the interference
between optical sensors was minimized.
Opaque mask’s layers – Figure 4 (a) - were
implemented to prevent the interference of dispersed
light from neighbour LEDs with each LDR response.
Given that the sensing gels on the glass slides were
not homogeneously spread, opaque black masks –
Figure 4 (b) - were applied on the back of the glass
slides. This delimitates the area of gel exposed.
Figure 4: (a) Opaque masks layers implemented to prevent
the interference of dispersed light from the LEDs in the
surroundings with the LDRs response. (b) Sensing film
with an opaque mask applied.
A new hermetic sample chamber with a
cylindrical configuration was implemented. This
way, the area of the liquid-gas surface is the same,
independently of the volume used. In the pipelines,
shorter silicone tubes and polypropylene connectors
were used. Having shorter tubes, lower recovery and
exposure periods were required.
The transduction system previously implemented
in E-nose V0 was not scalable, because the data
acquisition system was expensive, and required cable
connection to a computer. Thus, for E-nose V1, the
transduction system was redesigned. The new system
uses an Arduino Uno (a microcontroller) and a
Raspberry Pi 2 Model B (an embedded system), that
can be remotely controlled by a computer. Since the
transduction system was implemented using open-
source hardware and software, it became two orders
of magnitude cheaper than the previous version.
Currently, it is an autonomous unit, the mechanisms
for data visualization and data analysis are faster, and
a scalable architecture was achieved.
3.2 Hybrid E-nose V2
The new E-nose implemented should fulfill some
requirements: it should be stable, miniaturized, and
easy to handle. Moreover, it should enable less time
needed for experiments, and to test more sensing
films simultaneously. Having these goals in mind, the
E-nose V2 was designed according to the schematic
shown in Figure 5. This E-nose is hybrid, since the
optical detection chamber can be easily replaced by
an electrical sensors chamber.
Figure 5: Schematic of the E-nose V2.
The delivery system is composed of an exposure
and a recovery pumps. It has also a sample chamber,
tubes, connectors, and non-return valves similar to the
ones used in E-nose V1.
The transduction system is a replica of the E-nose
V1, based on Arduino Due and Raspberry Pi 2 Model
B. Arduino Due was used, because it has twelve
analog input pins, whereas Arduino Uno has only six.
A humidity and temperature sensor was included
in the E-nose instrumentation to measure the room
conditions. And, the relays switch unit was wired to
the microcontroller and pumps.
3.2.1 Optical Detection Chamber
The optical detection chamber is composed of: an
opaque external box - Figure 5 A) - that protects the
optical sensors from the interference of
environmental light; an internal support for sensing
films with a glass chamber on it to concentrate the
VOCs near the sensing films - Figure 5 B); Printed
Circuit Boards (PCBs) - Figure 5 C) - for the emission
Design and Evolution of an Opto-electronic Device for VOCs Detection
51

circuit – Figure 6 (a) - and for the detection circuit
Figure 6 (b).
Figure 6: Schematic of the (a) emission circuit and (b)
detection circuit of E-nose V2 PCBs.
Inside the E-nose V2 detection chamber, six
LEDs/LDRs were placed in parallel, instead of four
used in E-nose V1. Another difference is that the
LDRs power supply is 3.3 V, because an analog input
value higher than 3.3 V may damage the Arduino
Due. The components used in the PCBs are through-
hole technology mounting type.
3.2.2 Electrical Detection Chamber
For testing the sensing films electrical response, the
detection chamber should be replaced by the
electrical sensors chamber. This consists of a little
box with capacity for an array of 8 interdigitated
electrodes inside. The sensing films exhibit capacitive
effects. To avoid accumulation of charges in the
electrical films, they can be continuously polarised
and depolarised, using alternating current (AC).
The method used to detect the changes that occur
in the electrical sensors while interacting with the
VOCs requires the use of a conductivity meter
installed between the Arduino and the detection
chamber. The conductivity meter implemented is
described in (da Rocha et al., 1997). An oscillator
generates a triangular wave, that is applied to one of
the electrode terminals. The other terminal is wired to
the input of a current-to-voltage converter. After
rectification and filtering, the output voltage becomes
proportional to the conductance in the electrode.
4 RESULTS
4.1 Signals Calibration
The optical sensors were calibrated for each
LED/LDR pair, according to the following equation:
Calibrated signal =
𝑠 − min
max − 𝑚𝑖𝑛
(1)
s – signal values obtained (V). The value is given by
the LDR, when a sensing film is sandwiched between
two crossed polarising filters, in the absence - Figure
1 (a) - or presence of VOCs - Figure 1 (b).
min – average of signal values obtained when two
crossed polarising filters are placed between the LED
and the LDR. Without placing the sensing gel in the
middle, the light intensity that reaches the LDR is
minimal. Therefore, given the LDR response curve,
its resistance will be maximum. Consequently,
according to the Ohm’s law, the voltage drop at the
LDR will be maximum. Yet, taking in account the
LDR schematic shown in Figure 6 (b), the analog
output signal 𝑉
𝑜𝑢𝑡
(detected by the Arduino) is given
by:
𝑉
𝑜𝑢𝑡
= 𝑉
𝑅
= 𝑉
𝑆𝑜𝑢𝑟𝑐𝑒
− 𝑉
𝐿𝐷𝑅
(2)
Thus, if the voltage drop at the LDR is maximum, the
output voltage will be minimum.
max – average of signal values obtained when two
parallel polarising filters are placed between the LED
and the LDR (without sensing gel in the middle). The
light intensity that reaches the LDR is maximum.
Therefore, its resistance will be minimum.
Consequently, the voltage drop will be minimum.
According to equation 2, if the voltage drop at the
LDR is minimum, the output voltage will be
maximum.
The calibration signals, from which the min and
max are calculated, are obtained without placing any
sensing film between the two polarising filters. The
experiments are performed inside the detection
chamber, with the LEDs ON. Each E-nose (V1 or
optical V2) only needs a single calibration, before the
first experiment, and not in the beginning of each
experiment. Each E-nose unit requires its own
calibration, and cannot use calibration values from
other E-noses, because the rationale behind
calibration is to compensate differences among LEDs
and LDRs inherent to their production.
4.2 Optical Signals Evolution
Examples of optical signals obtained in E-nose V0,
V1 and V2 are shown in Figure 7. A significative
BIODEVICES 2018 - 11th International Conference on Biomedical Electronics and Devices
52
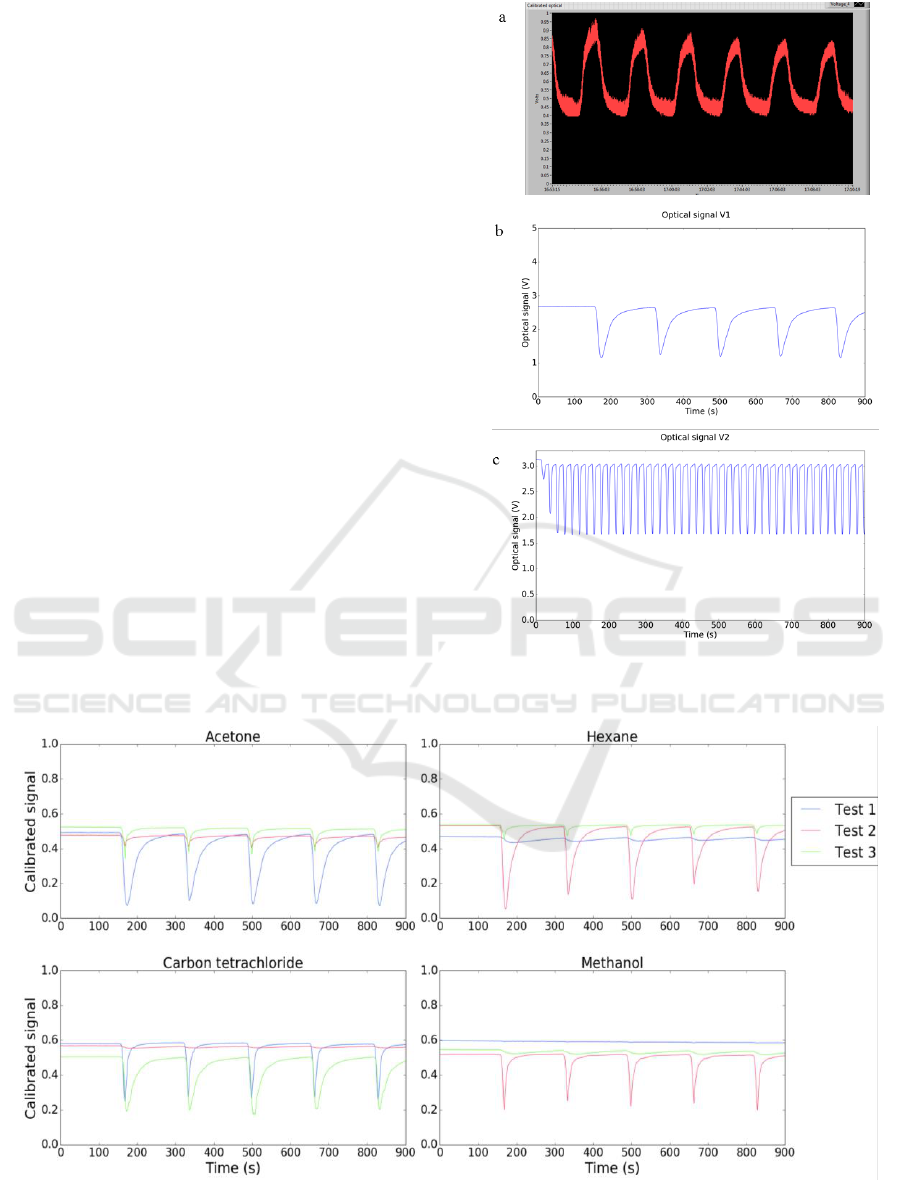
improvement in the signal to noise ratio can be
observed from E-nose V0, to E-noses V1 and V2.
From E-nose V1 to E-nose V2, the exposure and
recovery times were reduced for 1/10. This was
possible due to the miniaturized detection chamber
implemented in E-nose V2. The total chamber
volume was reduced from 1200 mL (in V1) to 20 mL
(in V2). Consequently, the E-nose V2 allows
acquisition of more data in less time.
4.3 Signals Obtained
To evaluate if the E-nose V1 could detect vapors of
different organic solvents, several optical sensing
films were prepared. 60 µL of sensing gel were spread
over microscope glass slides cut with dimensions 40
mm x 15 mm.
3 tests were conducted in the E-nose V1, using the
conditions: 5 mL of organic solvent inside the sample
chamber, heated at 36 °C. The room temperature was
set to 20 °C. The room humidity ranged from 46 % to
87 %. The exposure time was 50 s, and the recovery
time was 150 s. The total duration was 15 min. And,
the sampling rate was 10 Hz.
Test 1, 2 and 3 included 13 experiments, each one
using different organic solvents, namely acetone,
carbon tetrachloride, chloroform, dichloromethane,
diethyl ether, isopropanol, ethanol, ethyl acetate,
heptane, hexane, methanol, toluene and xylene. The
results obtained for acetone, carbon tetrachloride,
hexane, and methanol are shown in Figure 8.
Figure 7: Evolution of optical signals from (a) E-nose V0
to (b) E-nose V1 and (c) E-nose V2. The gas sample used
was atmospheric air saturated in acetone for all the plots.
Figure 8: Optical signals obtained using the same sensing film exposed to different VOCs in test 1, test 2 and test 3, using E-
nose V1. The sensing films were composed of 1-butyl-3-methylimidazolium dicyanamide [BMIM] [DCA], 4-Cyano-4'-
pentylbiphenyl (5CB), Bovine Skin Gelatine (BSG), Sorbitol, and Milli-Q water (Hussain et al., 2017).
Design and Evolution of an Opto-electronic Device for VOCs Detection
53
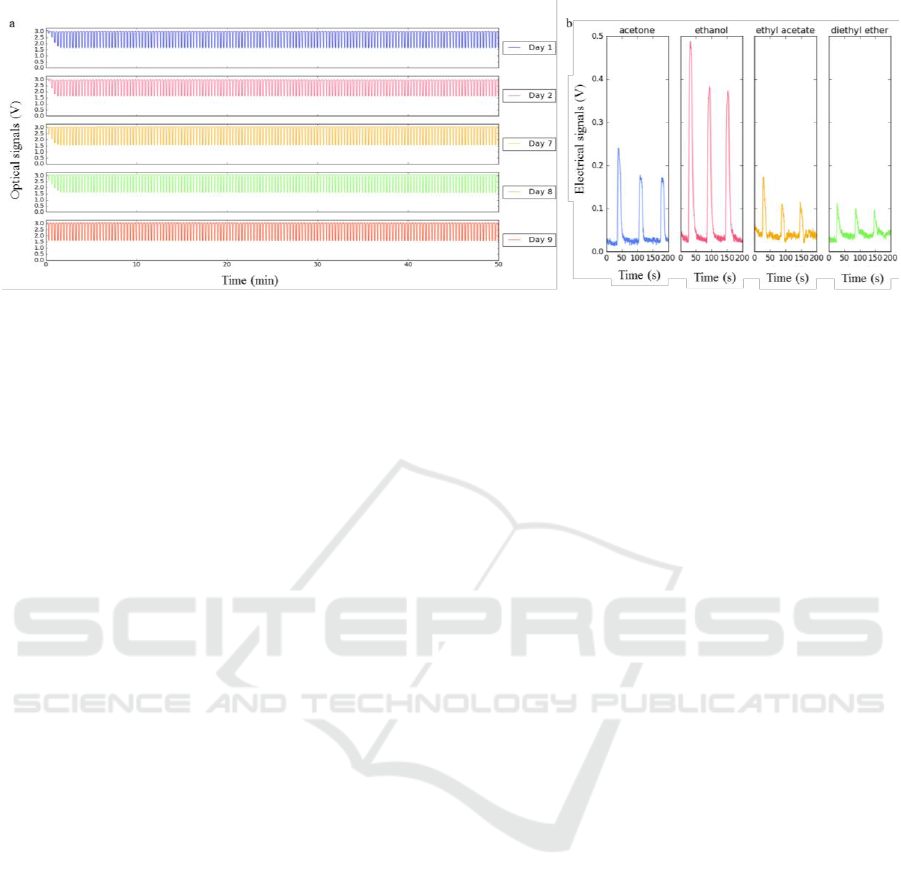
Figure 9: (a) Optical signals obtained using the same sensing film cyclically exposed to acetone along 10 days. The sensing
films were composed of [BMIM] [DCA], 5CB, BSG, and Milli-Q water (Hussain et al., 2017). (b) Electrical signals obtained
using the same sensing film for different VOCs exposure. The electrical films were composed of [BMIM] [DCA], 5CB, BSG,
Sorbitol, and Milli-Q water (Hussain et al., 2017).
One can observe that for the same test (test 1, 2 or
3) the interaction of the sensing gels with different
VOCs originates signals with different features. This
is an indicator that the device might be useful for
VOCs distinction and identification.
However, observing the signals for each VOC, we
can identify significant differences comparing the
results from test 1, test 2 and test 3. Thus, we can
conclude that the results were not reproducible for
different tests. Possible reasons for lack of
reproducibility can be: the sensing films spreading
method was not adequate; the device was not stable
enough, because it was difficult to place the sensing
films at the same position for different tests; and the
LDRs PCB had to be taken out and placed again for
different tests, due to E-nose V1 horizontal
configuration.
To solve these issues, the E-nose V2 was
assembled, and a reproducibility test was conducted.
An array of six sensing films with the same
composition was placed inside the detection chamber,
and kept at the same position for 10 days.
The experimental conditions were: 5 mL of
acetone inside the sample chamber, at 36 °C. The
room temperature was 21-23 °C. The room humidity
ranged from 58 % to 89 %. The exposure time was 5
s, and the recovery time was 15 s. The total duration
was 50 min. And, the sampling rate was 5 Hz.
Two of the six sensing films tested originated
reproducible responses along the 10 days. Figure 9 (a)
shows a reproducible response given by one of them.
To test the electrical response, interdigitated
electrodes 0.2 mm were prepared, spreading 15 µL of
the sensing gel over each one. The sensing gel
composition tested that gave an electrical response for
several VOCs – see Figure 9 (b) - is described in the
caption of this Figure. The conditions used in the
experiment were: 5 mL of the organic solvent inside
the sample chamber, at 37 °C. The exposure time was
10 s, and the recovery time was 50 s. The total
duration was 4 min.
5 CONCLUSIONS
Regarding the device evolution, the E-nose V2 is
more stable, miniaturized, and controllable than E-
nose V1. The detection chamber of E-nose V2 was
miniaturized, and consequently the exposure and
recovery times required for VOCs detection were
reduced. It is easier to handle, because it has a vertical
configuration, while E-nose V1 has a horizontal one.
Thus, in E-nose V2, the sensing films can be easily
placed and removed. Also, the chamber is more stable
because the sensing films are placed in fixed
positions. Nevertheless, more improvements are
needed to get close to a commercial product: a
hermetic detection chamber should be implemented;
and, the LED and photo detector of each optical pair
should be perfectly aligned. This can be achieved
using PCBs with surface-mount technology
components. For future versions, photo diodes or
photo transistors should be tested to substitute the
LDRs, because they might have better performance-
to-cost ratio, sensitivity and stability for this
application. Besides, their response speed is faster.
The humidity and temperature sensors installed in
E-nose V2 might add valuable information about the
influence of the room conditions in the sensing films
response. We intend to study that correlation in detail
soon. For the transduction system, the signals
BIODEVICES 2018 - 11th International Conference on Biomedical Electronics and Devices
54

response must be normalized, and several
classification methods can be explored.
Furthermore, small, lightweight and low-power
pumps can be used in future versions of the device, so
it can achieve portability without the need of an
electric generator.
In what concerns to the electrical part, the
conductivity meter architecture should be re-designed
to be simpler and easily scalable. For instance, the
possibility of generating an input digital wave should
be explored. In addition, the electrodes finishing
surface should be more corrosion-resistant (the use of
nickel and gold, or platinum might be a solution). The
duration of the experiments related to the electrical
signals should be longer, allowing the study of the
response at different measurement intervals, to
improve quantification and interpretation of results.
The studies performed so far intend to
characterize the device, identify its limitations, and
optimize the technology. That is why, the tests were
performed successively in cycles during several
minutes. Nevertheless, our vision is to achieve a
device that gives a response in the range of seconds.
The final goal is to accomplish a portable and
user-friendly device. Accuracy, stability, and
scalability are imperative to get to an E-nose, that can
be explored towards several applications in
environmental protection, security, product quality,
or medical research.
ACKNOWLEDGMENTS
This work was supported by the European Research
Council (SCENT-ERC-2014-STG-639123) and
UCIBIO, financed by FCT/MEC (UID/Multi/
04378/2013) and co-financed by the ERDF under the
PT2020 Partnership Agreement (POCI-01-0145-
FEDER-007728). The authors thank FCT/MEC for
the research fellowship PD/BD/105752/2014 for A.P.
The authors also acknowledge funding from CNPq,
Brazil (400740/2014-1).
REFERENCES
Barsan, N., Koziej, D. and Weimar, U. (2007) ‘Metal oxide-
based gas sensor research: How to?’, Sensors and
Actuators B: Chemical, 121(1), pp. 18–35.
Boden, N. et al. (1999) ‘Device applications of charge
transport in discotic liquid crystals’, Journal of
Materials Chemistry, 9, pp. 2081–2086.
Feng, L. et al. (2010) ‘A colorimetric sensor array for
identification of toxic gases below permissible
exposure limits’, Chemical Communications, (12), pp.
2037–2039.
van Geffen, W. H., Bruins, M. and Kerstjens, H. A. M.
(2016) ‘Diagnosing viral and bacterial respiratory
infections in acute COPD exacerbations by an
electronic nose: a pilot study.’, Journal of breath
research. IOP Publishing, 10(3), p. 36001.
Gutierrez, J. and Horrillo, M. C. (2014) Advances in
artificial olfaction: Sensors and applications, Talanta.
doi: 10.1016/j.talanta.2014.02.016.
Gutmacher, D. et al. (2011) ‘Comparison of gas sensor
technologies for fire gas detection’, Procedia
Engineering. Elsevier B.V., 25, pp. 1121–1124.
van Hooren, M. R. A. et al. (2016) ‘Differentiating head
and neck carcinoma from lung carcinoma with an
electronic nose: a proof of concept study’, European
Archives of Oto-Rhino-Laryngology, 273(11), pp.
3897–3903.
Hussain, A. et al. (2017) ‘Tunable Gas Sensing Gels by
Cooperative Assembly’, Advanced Functional Mate-
rials, 27(27), pp. 1–14. Available at: http://dx.doi.org/
10.1002/adfm.201700803.
Jing Kong, author et al. (2000) ‘Nanotube Molecular Wires
as Chemical Sensors’, 287(5453 OP-Science.
287(5453):622-625), p. 622.
Li, S. (2009) Overview of Odor Detection Instrumentation
and the Potential for Human Odor Detection in Air
Matrices. MITRE Nano.
Llobet, E. et al. (1999) ‘Fuzzy ARTMAP based electronic
nose data analysis’, Sensors & Actuators: B. Chemical,
61(1 OP), pp. 183–190.
Mirzaei, A., Leonardi, S. G. and Neri, G. (2016) ‘Detection
of hazardous volatile organic compounds (VOCs) by
metal oxide nanostructures-based gas sensors: A
review’, Ceramics International. Elsevier, 42(14), pp.
15119–15141. doi: 10.1016/j.ceramint.2016.06.145.
Persaud, K. and Dodd, G. (1982) ‘Analysis of discrimina-
tion mechanisms in the mammalian olfactory system
using a model nose.’, Nature, 299(5881), pp. 352–5.
da Rocha, R. T., Gutz, I. G. R. and do Lago, C. L. (1997)
‘A Low-Cost and High-Performance Conductivity
Meter’, Journal of Chemical Education. American
Chemical Society, 74(5), p. 572. Available at:
http://dx.doi.org/10.1021/ed074p572.
Wilkens, W. F. and Hartman, J. D. (1964) ‘An electronic
analog for the olfactory processes’, Annals New York
Academy of Sciences, (512), pp. 608–612.
Zohora, S. E., Srivastava, A. K. and Dey, N. (2016) ‘Gas
Sensing Techniques in Electronic Nose and its
Applications : A Review’, EEECOS, pp. 178–183.
Design and Evolution of an Opto-electronic Device for VOCs Detection
55
