
Measuring Identity and Access Management Performance - An Expert
Survey on Possible Performance Indicators
Matthias Hummer
1,2
, Sebastian Groll
2
, Michael Kunz
1,2
, Ludwig Fuchs
2
and G
¨
unther Pernul
1
1
Department of Information Systems, University of Regensburg, Regensburg, Germany
2
Nexis GmbH, Regensburg, Germany
Keywords:
Identity and Access Management, Performance Indicators, Survey.
Abstract:
Currently existing digital challenges such as securing access, proof of compliance with regulations and im-
provement of business performance are urging companies to implement structured Identity and Access Man-
agement (IAM). Over the past decades, the introduction of IAM represented a critical task for companies
trying to get their complex IT infrastructures comprising hundreds of systems, thousands of accounts and
millions of access right assignments under control. However, once introduced, the identification of potential
IAM malfunctions remains an unsolved challenge. Within this paper, we want to provide a first step into the
direction of sustainable IAM maintenance, by introducing indicators that are able to capture the efficiency of
a rolled-out IAM. We firstly derive IAM performance indicators via a structured scientific approach and later
evaluate their relevance by surveying IAM experts.
1 INTRODUCTION
Identity and Access Management (IAM) has become
one of the core topics to tackle insider misuse of ac-
cess, complying with regulations and achieving trans-
parent management of digital identities and entitle-
ments in enterprises. Complexity and the so called
identity explosion (Fuchs and Pernul, 2008) forces
companies to tackle the problem of users’ correct ac-
cess to systems, a crucial task in terms of security
and efficiency (Hovav and Berger, 2009). While tra-
ditionally system-specific administration of accounts
and permissions was conducted, nowadays companies
centralize their user management to provision, con-
trol and analyze their digital identities throughout all
connected systems. However, newly arising technolo-
gies like highly volatile cloud infrastructures or in-
dustry 4.0 require even more sophisticated IAM solu-
tions and demand a steady increase in performance of
an organization’s IAM. Up to now, the measurement
of IAM performance is an issue only attracting little
attention and remains an unsolved problem. While
there are many approaches (Windley, 2005; Royer,
2007; Fuchs et al., 2009; Kunz et al., 2015) that of-
fer guidelines on how to adopt IAM in good practice,
only little notion has been dedicated to judge whether
an existing IAM is able to cope with current require-
ments from business, technology or regulation.
Up to now research offers partial approaches to
estimate the quality of certain IAM capabilities, how-
ever, there is only little support in rating the overall
performance of a specific instance of IAM. Conse-
quently, companies struggle with knowing the gen-
eral maturity of their IAM leading to possibly flawed
decisions on future IAM investments or risking an in-
secure IAM infrastructure not capable of meeting to-
day’s increasing demands. In order to address these
issues, our paper’s main contribution is to suggest but
more importantly to verify performance indicators for
IAM.
The remainder of the paper is structured as fol-
lows. Section 2 presents related work concerning
which approaches exist for measuring the perfor-
mance of specific IAM capabilities. Within Section
3, we outline our overall methodology, before Section
4 introduces the construction of 19 performance indi-
cators by applying the Goal-Question-Metric (GQM)
paradigm (Basili et al., 1994). In order to evaluate
these for relevance, we conducted a survey with 32
participants specialized within the field of IAM, lead-
ing to a generalizable expert opinion on our indicator
candidates, which is described in Section 5. These
results together with other interesting findings of the
expert’s answers are discussed in Section 6. Finally
Section 7 shows limitations of our approach and con-
cludes with future work.
Hummer, M., Groll, S., Kunz, M., Fuchs, L. and Pernul, G.
Measuring Identity and Access Management Performance - An Expert Survey on Possible Performance Indicators.
DOI: 10.5220/0006557702330240
In Proceedings of the 4th International Conference on Information Systems Security and Privacy (ICISSP 2018), pages 233-240
ISBN: 978-989-758-282-0
Copyright © 2018 by SCITEPRESS – Science and Technology Publications, Lda. All rights reserved
233

2 RELATED WORK
Existing IAM research mainly focuses on specific
technical or organizational features of IAM infras-
tructures and does not cover performance indicators
of IAM in general. Literature in research and practice
(Witty, 2003; Bresz et al., 2007; Hermans, 2008; Dell,
2011; Harvard, 2014; Fisher, 2016) underlines that
risk reduction, IT cost reduction, compliance require-
ments, data and process quality and business facilita-
tion are the main drivers for modern IAM in organi-
zations. These drivers can act as starting point for the
development of performance indicators for long-term
IAM maintenance. For instance, Royer et al. mention
the importance of assessing and evaluating IAM sys-
tems within several publications (Royer, 2007; Royer
and Meints, 2008; Royer, 2013). They transfer the
concept of balanced score cards to IAM thus present-
ing a generic methodology for estimating an IAM sys-
tem’s performance. Following similar goals as ours,
they mostly focus on financial aspects to evaluate the
value of IAM systems.We argue that the overall per-
formance of IAM as a cross-cutting enterprise func-
tionality must be taken into consideration.
(H
¨
ollrigl et al., 2008) define several evaluation di-
mensions to compare architectures for access control
in federated environments. In (Schell et al., 2009)
they use these dimensions as a basis to derive met-
rics for an IAM system’s performance evaluation.
However, they mostly focus on architecture and con-
sider performance as a quantifiable measure defined
by how long various systems’ activities are taking.
Performance in our terms is having a broader per-
spective than their focus on an IAM systems’ capa-
bility of timely processing decisions. Staite et al.
(Staite and Bahsoon, 2012) perform a systematic liter-
ature review as well as an architectural trade-of, anal-
ysis method (Kazman et al., 1999) to derive require-
ments and metrics for authentication and user profiles
in Identity Management architectures. These metrics,
however, focus on the technical implementation of an
IAM architecture. Peterson et al. (Peterson, 2006)
provide indicators to measure and manage the risk
within IAM systems. They show some valuable met-
rics that can assist in judging whether the execution
time of requests and the delivery of access rights are
in acceptable condition. Their approach is focusing
only on the fields of risk reduction and process qual-
ity improvement and leaves out other necessary cate-
gories.
An overall perspective and judging from a top-
level goal that IAM centers around has not yet been
addressed. Furthermore, the approaches do not ver-
ify their indicators via conducting a survey, thus not
validating their suggestions in practice.
3 DEVELOPMENT OF IAM
PERFORMANCE INDICATORS
3.1 Overall Methodology
Having outlined the research field that this publication
contributes to, in the following Section our methodol-
ogy for conducting this research is briefly described.
To the best of our knowledge, there exists no com-
parable approach for developing general performance
indicators for IAM in such a focused and structured
way. The overall process follows the five steps de-
picted in Figure 1 and ist based on the GQM paradigm
which is widely respected for its capability to develop
qualitatively or quantitatively measurable factors de-
rived from overall goals. Initially developed for the
field of Software Engineering, its basic assumption
is that measurement must fulfill three goals (as de-
scribed below). Transferred to IAM, measurement
must be:
• Centered around an overall strategy (i.e. various
goals)
• Holistic (i.e. considering all involved organiza-
tional and technical entities such as both, pro-
cesses and resources)
• Interpretable within the IAM context
Generally speaking, GQM is tackling the problem of
metric development via a divide and conquer pro-
cess. According to (Assmann et al., 2002) it com-
prises three layers, namely a goal layer, a question
layer and a metric layer. Each layer deals with a spe-
cific question as (Basili et al., 1994) indicates:
1. Goal: which goals are to be achieved by the mea-
surements?
2. Question: which questions can define these goals
more precisely?
3. Metric: which metrics can answer these ques-
tions?
For executing the GQM paradigm within IAM, we
followed the presented methodology which suggests
a generic six-step approach that can be followed by
answering all three questions above. For a detailed
description of this process please refer to the initial
publication. Note, that in this publication, we treat
the terms metric and IAM indicator synonymously, as
the metrics that are identified via the GQM can be
considered as performance indicating measurements.
3.2 IAM Goals
Following the GQM paradigm, in a first step goals
for IAM have to be formulated as mission statements.
ICISSP 2018 - 4th International Conference on Information Systems Security and Privacy
234
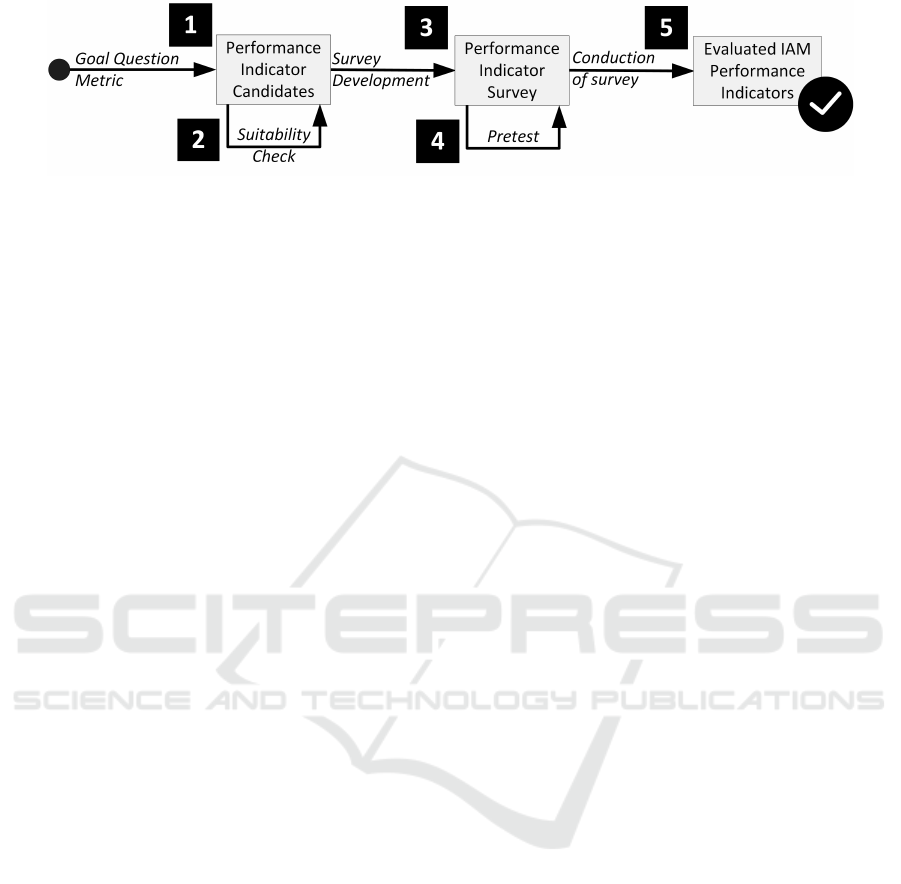
Figure 1: Methodology for Suggesting IAM Indicators.
Goals are structured hierarchically, which raises the
requirement that the GQM goals for IAM have to be
on the same hierarchical level in terms of granular-
ity. The overall goal of IAM, as (Bresz et al., 2007)
summarizes, is to ’initiate, capture, record and man-
age the user identities and related access permissions
to the organization’s proprietary information’. Build-
ing on existing research and practice (cf. Section 2)
this generic goal can be decomposed into the follow-
ing sub goals which are further used in the remainder.
Risk reduction: IAM focuses on preventing re-
sources from unauthorized access. To reduce risks
arising from an unstructured management of identity
data, IAM provides several means, e.g. giving an
overview over the data and allowing inspection and
correction of wrong access privileges (Meier et al.,
2013).
IT cost reduction: Literature (Bresz et al., 2007;
Witty, 2003) and practice (Gartner, 2009; Software
Engineering of America, 2015) indicate, that IT-
Helpdesk costs are mostly connected with password
problems of end users. IAM proposes new techni-
cal measures to tackle these problems. On the one
hand technologies such as SSO are enterprise-wide
and application-wide deployable, and on the other
hand user-friendly portals for self-service can be de-
livered.
Improvement of process and data quality: With
an established IAM, companies are better supported
in maintaining and improving their data quality. With-
out a centralized IAM system multiple error sources
occur while connecting and integrating data from
company-wide systems (Windley, 2005; Bertino and
Takahashi, 2011).
Regulatory compliance: With the ongoing trend
of digitalization, national and international regulato-
ries are imposing the need of auditing and managing
access within a companies’ applications upon enter-
prises. While there are general regulations such as the
Sarbanes Oxley Act (United States Congress, 2002)
or the soon effective EU General Data Protection Reg-
ulation (Council of the European Union, 2016), more
and more industry-specific regulations such as the
HIPAA (United States Congress, 1996) or Basel III
(Basel Committee on Banking Supervision, 2011) are
challenging organizations into presenting audited and
well-proven access infrastructures.
Business facilitation: Lastly, another important
sub-goal of IAM is, similar to all IT-related activities,
allowing a smoother and non-disrupting business ex-
perience. While in traditional scenarios, users have to
order access rights in various forms, centralized IAM
provides a standardized and understandable request
process for identities, user accounts or access rights
(Windley, 2005).
3.3 Abstraction Sheets, Deriving of
Questions and Development of
Performance Indicators
Following the applied methodology for the conduc-
tion of the GQM, in a next step, we created so called
abstraction sheets (Assmann et al., 2002; Basili et al.,
1994) for each of the stated goals. These serve as a
decomposition of the proposed sub-goals into several
parts which can be transferred later into items that can
be questioned within our survey. Abstraction sheets
are composed of two main elements. Firstly, inten-
tion, quality aspect, subject und perspective are sum-
marizing in short what the main components of the
goal are (e.g. compliance with regulations via IAM
as observed by managers). Secondly, for this first as-
pects quality issues (e.g. number of violations of com-
pliance rules) and environmental factors (e.g. auto-
mated reporting) are raised. These quality issues are
further mapped onto our IAM performance indicators.
While this list of questions is not designed to be
exhaustive, we argue that these are the main compli-
ance issues that can be tackled via structured IAM
and suffice for describing the overall objective within
IAM. These questions were developed with respect to
(Assmann et al., 2002)’s eight points for meaningful
survey questions.
Measuring Identity and Access Management Performance - An Expert Survey on Possible Performance Indicators
235

Following these principles for each sub-goal, we
arrived at a set of questions, each indicating a possible
performance indicator that in return can be assigned
to a goal. Note, that the indicators might correlate
with various goals, however we assign them to the
goal that initially raised the respective question.
4 STUDY OF PERFORMANCE
INDICATORS IN IAM
4.1 Development of the Survey
Following the presented methodology we conducted
a survey among IAM experts in order to validate
and evaluate the presented IAM indicators. For this
purpose we created an online questionnaire which is
structured as follows:
Firstly we inquired demographic features (e.g.
project status or company size). Secondly the par-
ticipant was asked for IAM goals relevant to his com-
pany. As a result only questions concerning the se-
lected goals were presented, whereas each question
references an IAM performance indicator. Thirdly
for each indicator we raised two questions. The first
collects if the company did already achieve an im-
provement through IAM regarding the indicator. If
no improvement was achieved up to that point, the
second question relates to if there is an improvement
planned. Before conducting the actual survey we
started a pretest to validate our questions regarding
suitability, interpretability, problems during proces-
sion, question order, possible technical problems and
temporal requirements.
For this initial evaluation we inquired three IAM
experts and lead a short interview afterwards. While
no major issues in length, order, structure and time
were criticized, phrasing of the questions had to be
improved for interpretability. Furthermore, another
major adaption to the sample population was needed:
As one of the three pre-testers was an IAM consultant,
he stressed that answering the questions was hard as
he had various projects in mind and could not guar-
antee replying consistently without getting confused
due to the number of his different clients. In order
to avoid data distortion we reason that IAM consul-
tants involved in several projects should be suspended
from the sample and respected this in the conduction
of the survey as the description of our sample shows
(cf. Section 4.2.1). Having developed the question-
naire, an evaluation method for assessing the validity
of an indicator for IAM is needed before conducting
the study, in order to consistently judge the suitabil-
ity of IAM indicators. Figure 2 shows the process we
applied to each of the candidates in order to evaluate
its applicability in practice: Summing up the process,
we have two main criteria for the validation of an IAM
indicator:
1. Relevancy of an IAM goal
2. Statement of participants of improvement of IAM
through the indicator
The relevancy of the IAM goal (meaning that the IAM
goal was answered as relevant to the participant’s
company) is a filter criterion that justifies whether
the sample is large enough to have significance. As
pointed out, only indicator questions concerning se-
lected IAM goals were raised. The second criteria is
split into two sub-criteria.
Firstly, if at least 50% of the respondents (16
out of 32) consider an indicator as already IAM-
improving, we argue that it is relevant to companies.
Secondly, if the aggregated amount of the partici-
pants’ IAM improvements of the past combined with
planned enhancements through the indicator shows
more than 75% (24 out of 32) response rate, we ar-
gue, that the combined percentage is high enough to
indicate relevance of the investigated indicator.
Additionally, we introduce a category of results
where an indicator is likely to exist, but where the
quantity of answer is not significantly high enough
(aggregated amount of already improved or prospec-
tive planned answers between 50% and 75%). We
reason, that if a company has already achieved better-
ment of their IAM through an indicator, this should
be weighted stronger than if they only expect future
results.
4.2 Results
In alignment with the evaluation process introduced
in Section 4.1 (cf. Figure 2), four of five IAM goals
received a sufficient score of acknowledgement (cf.
Figure 2). IT cost reduction was answered as relevant
only by 11 participants (~34%) which means in our
terms that we cannot make valid statements on this
topic, thereby excluding the corresponding indicator
candidates. However, we will include the indicators
discarded in the discussion in order to reason upon
possible causes for their little impact.
4.2.1 Participants and Demography
We only invited potential participants with dedicated
background in IAM. As already mentioned in Sec-
tion 3.1, they have to judge a single company’s
IAM, therefore preventing the confusion of multiple
ICISSP 2018 - 4th International Conference on Information Systems Security and Privacy
236
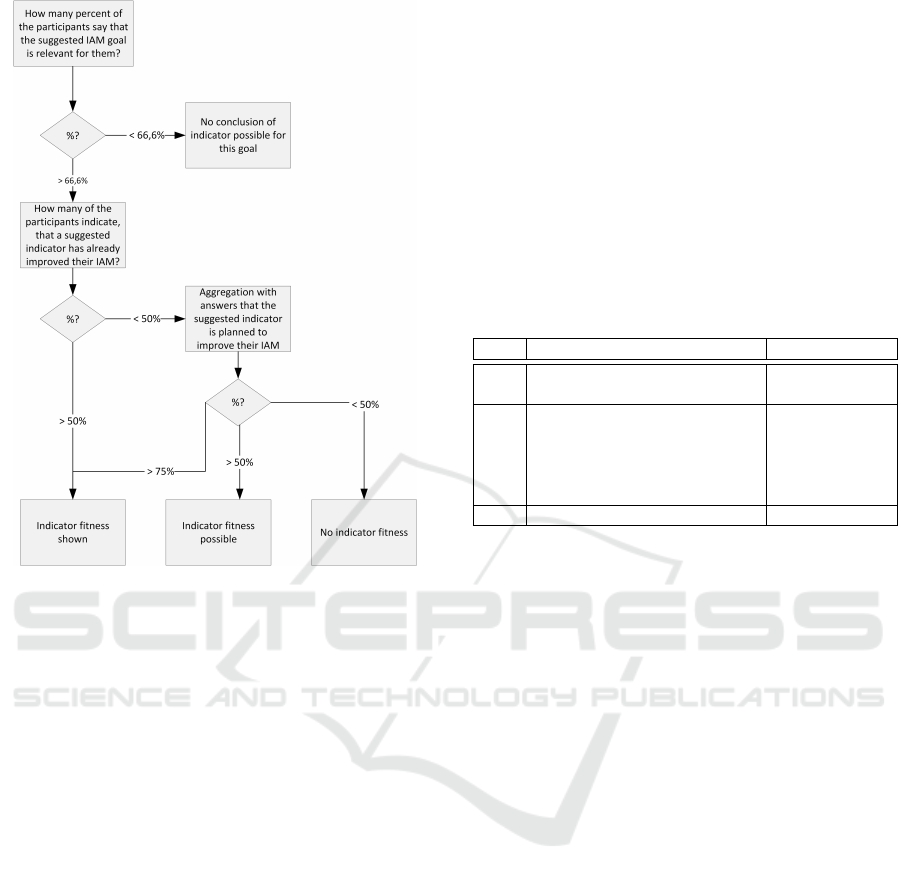
Figure 2: Evaluation Process.
projects. Second, they have to be employed in opera-
tional or strategic IAM. Based on these requirements
we sent out 73 invitations. 32 out of these 73 people
fully conducted the survey (~41%). All participants
are located within the DACH region (Germany, Aus-
tria and Switzerland). The average processing time of
the questionnaire survey was 11 minutes and 30 sec-
onds, the median was 8 minutes and 18 seconds which
matched our expectations.
For our demographic evaluation we analyzed our
respondents in regard of their company’s size, in-
dustry branch, IAM project progress and their job
position within IAM. It showed that the majority
work for companies with more than 5.000 employees,
which matches the fact that IAM is currently a topic
mostly relevant for larger enterprises. The distribu-
tion among industrial sectors is displayed in Table 1.
Eight of our participants did not make a statement re-
garding industry, thus their answers can not be applied
in the discussion. However, the given sectors can be
divided into strongly regulated sectors (rows number
1 and 2) and average regulated sectors (rows number
3 - 8). This fragmentation will later find application
within our discussion.
Within the questionnaire we asked the participants
how far IAM within their company is processed using
a scale from 0% to 100% with steps of 10%. Thus
our interviewees can be divided in ’early project state’
(from 0% to 30%), ’medium project state’ (from 40%
to 70%) and ’advanced project state’ (from 80% to
100%). We determined that eight participants are lo-
cated in an early state, while 12 respectively are ei-
ther at a medium state or have already advanced their
IAM. We further analyzed if there is a connection be-
tween the project state and other demographic fea-
tures like company size or industry sector regulation.
We could not identify any significant connection con-
cerning these characteristics. This leads to the as-
sumption that there seems to be a strong individual
dependency concerning how IAM is focused by en-
terprises.
Table 1: Participant’s Industry Sectors.
# Industry Sector Participants
1 Finance / Insurance 11
2 Pharmacy / Medicine 1
3 Automotive / Supplier 5
4 Metal industry 3
5 Service 2
6 Food 1
7 Software / Hardware 1
8 Others 8
4.2.2 IAM Indicator Evaluation
Generally speaking, the goals risk reduction, im-
provement of data and process quality and compli-
ance requirements achieved highest scores of rele-
vancy in the answers of the participants with 25, 26
and 26 positive answers respectively (out of 32). Nat-
urally, these goals are correlating with the basic func-
tionalities of a company-wide IAM which typically
are implemented first. The protection of internal as-
sets (risk reduction) represents a major goal of com-
panies utilizing IAM to strengthen their IT security
thus avoiding possible malicious activities by allow-
ing unwanted access. Similarly, data and process
quality improvements lead to smoother and less erro-
neous user management workflows therefore present-
ing a highly valuable goal for companies burdened by
challenges in correlating data from various systems.
Compliance achievements are an unwanted but nec-
essary issue in order to allow a company to meet their
industry’s specific requirements.
The goal of business facilitation achieved a high
score as well, indicating that issues such as user sat-
isfaction and less disruption of business are a much
preferred topic that IAM can deliver as well. Such
topics are typically approached once basic IAM func-
tionality is up and running. On the other hand, IT
cost reduction caused by IAM is a goal which is less
in favor as our received responses demonstrate. This
could reason in the fact, that initially, IAM increases
IT costs substantially (Cser, 2017), whereas a later
Measuring Identity and Access Management Performance - An Expert Survey on Possible Performance Indicators
237

Table 2: IAM Goals and IAM Indicator Scores.
IAM Goal IAM Indicator Improved Planned
Risk reduction 25
Number of security incidents due to user
and entitlement management
14 6
Number of security incidents due to critical
role and access right combinations
11 5
Duration until deactivation of employee
access rights
24 1
Duration until emergency deactivation of
employee access rights
18 1
IT cost reduction 11
Costs for entitlement and access management 4 0
Support costs for user management 10 1
Costs for data storage of user data 7 3
Data and process quality 26
Development of data quality 25 0
Error rate within access management 18 3
Error rate within identity and account creation 21 1
Compliance requirements 26
Reduction of compliance violations 18 6
Number of successful audits 21 4
Duration until complete solution of
a compliance incidents
11 8
Business facilitation 22
Reduction of administrational effort 19 3
Improvement of user satisfaction 13 5
Duration until employee readiness 19 2
Duration until access model adjustment 13 4
Number of failed authentication requests 8 2
Processing duration of user requests 13 2
general decrease through e.g. automation is not yet
perceived by our survey participants.
Table 2 displays our proposed IAM goals to-
gether with their indicators. The ’improved’ column
specifies how many participants already achieved
an improvement concerning the indicator while the
’planned’ column expresses how many participants
plan an improvement of the corresponding indicator
in the future. For each IAM goal we present the num-
ber of participants which described the goal as rele-
vant for their company. In accordance with the evalu-
ation process (cf. Figure 2), we define the suggested
indicator candidates for the IAM goal IT cost reduc-
tion as not suitable as it is only relevant to ~34% of
our participants. Thus, 16 possible indicators remain
out of the four suitable IAM goals for further check of
relevancy. Please note that this does not necessarily
mean that the indicators raised for IT cost reduction
do not exist. However on the sample data, we can-
not make a significant statement about the validity of
the candidates. The criteria presented in Figure 2 was
reached by nine IAM indicators.
The next category consists of indicators which
show potential fitness. These do not fully match our
requirements yet do have a score high enough to pos-
sibly represent indicator fitness within certain scenar-
ios or environments. In the field of risk reduction ’du-
ration until emergency deactivation of employee’ and
’security incidents due to critical access right combi-
nations’ fulfill the categories’ demands. Correlations
with the industrial background of participants’ replies
show, that these indicators might mainly be relevant
within the focus of finance and insurance companies
thus not being highly valuable for all of our partici-
pants. Furthermore ’duration until complete solution
of compliance incidents’ and ’user satisfaction’ fall
into this category. This suggests that only some com-
panies focus on topics which do not directly effect the
core IAM or correspond to topics which only occur
with a certain probability.
Finally, five candidates did not show indicator fit-
ness. Apart from the ones within the goal cost reduc-
tion, the two other indicators correspond to the goal of
business facilitation. The first indicator is ’number of
failed authentication attempts’ with only ~31% (score
of 10). The last discarded candidate is the ’duration
until user requests are processed’. This also repre-
sents an interesting finding as from our perspective
this candidate is connected with the indicator ’user
satisfaction’. This could ground in enterprises focus-
ICISSP 2018 - 4th International Conference on Information Systems Security and Privacy
238

ing rather on other issues for increasing user satisfac-
tion such as integrated portal usage.
5 DISCUSSION
In the following we present a discussion of the de-
rived results. Five of our presented IAM indicators
did not show indicator fitness. Firstly, IT cost reduc-
tion does not seem to be within short and mid term
focus of IAM in general which results in three dis-
continued indicators. Secondly, the number of failed
authentication requests did not show any indicator
fitness. This can be explained as this topic can be
handled very well on a technical level by IAM sys-
tems thus it does not receive a lot of attention among
IAM experts. Thirdly the processing time for user
requests has hardly been improved or planned to be
improved in future. This is remarkable as it repre-
sents a main point of contact of users to IAM and
thereby we expected a positive response to this indi-
cator. We tried to find a correlation concerning other
demographic features yet none produced significant
results. Thus we conclude that this topic is already
handled very well by today’s companies as the nega-
tive impact might strongly impact the overall perfor-
mance of the company itself.
Influence of project status on IAM indicators:
The presented indicators show different performance
regarding the IAM project state. As expected not all
indicators can be developed on an equal speed. For
example the number of successful audits strongly in-
creases at beginning IAM projects. So ~75% of our
participants within an early project state, ~75% within
a medium project state and ~90% within an advanced
project state have increased this indicator. However
indicators like user satisfaction increase at a later
project state. Only 25% of our participants within
an early project state could improve this issue while
~45% within a medium project state achieved an im-
provement and ~63% within an advanced project state
increased this indicator. This firstly shows that com-
panies in general begin with issues concerning core
IAM indicators during their project and secondly that
the presented indicators can further be split up accord-
ing the project state in order to optimally support or-
ganizations.
Influence of industry sector on IAM indicators:
Regarding the presented industry sector partition
(strongly regulated and average regulated) we could
determine further differences. Average regulated
companies perceive IAM as a support function and
thereby focus on indicators which facilitate effort and
business. For example 75% of our participants in av-
erage regulated industry sectors achieved an improve-
ment in the duration it takes to adjust the access model
in place while this was only achieved by ~33% of par-
ticipants within strongly regulated industry sectors.
On the other hand 75% participants in strongly
regulated industry could reduce the number of secu-
rity incidents due to role and access right combina-
tions while this was achieved by only ~30% of partic-
ipants with average regulations. According to these
observations the presented indicator catalog could
further be elaborated regarding industry sectors and
currently available legal requirements.
6 CONCLUSION AND FUTURE
WORK
Having discussed and presented our findings, we want
to briefly outline limitations and summarize our con-
tribution before providing a short outlook for future
work. In general we perceive three limitations of the
conducted survey. Firstly, a response rate higher than
the 41% of our invited candidates would have backed
our results even more. However, for qualitative re-
search such as our study, we argue that our received
responses are high enough. Additionally, a potential
selection bias (e.g. over-representing project man-
agers) might exist, but cannot be suppressed due to
the fact that to the best of our knowledge no research
exists on the general distribution of job profiles for
IAM. Lastly, all of our participants are all located in
the German-speaking countries, however, due to the
international background of most of our participants’
companies operating worldwide, our findings can be
transferred to other nations with similar preconditions
as well.
In a nutshell, within this paper we were able to
demonstrate relevancy and existence of several IAM
indicators that help analyzing an existing IAM. By
evaluating their relevance in practice, we were able
to provide researchers and practitioners with valu-
able results towards how IAM performance can be ex-
pressed either in a quantifiable or qualitative manner.
Utilizing our results, the first step towards a holistic
IAM measurement framework has been taken. Conse-
quently we are planning on establishing such a frame-
work with our suggested and approved indicators as
baseline. By doing so, we aim at delivering a tool for
sustainable IAM measurement and maintenance.
Measuring Identity and Access Management Performance - An Expert Survey on Possible Performance Indicators
239

REFERENCES
Assmann, D., Kalmar, R., and Punter, T. (2002).
Messen und Bewerten Von Webapplikationen Mit der
Goal/Question/Metric Methode: Handbuch. IESE-
Report / Fraunhofer Einrichtung Experimentelles
Software Engineering. Fraunhofer-IESE.
Basel Committee on Banking Supervision (2011). Basel
III - A global regulatory framework for more resilient
banks and banking systems.
Basili, V. R., Caldiera, G., and Rombach, H. D. (1994). Ex-
perience factory. Encyclopedia of software engineer-
ing, pages 470–476.
Bertino, E. and Takahashi, K. (2011). Identity Management:
Concepts, Technologies, and Systems. Artech House.
Bresz, F., Renshaw, T., Rozek, J., and White, T. (2007).
Identity and Access Management. Technical report,
Ernst and Young.
Council of the European Union (2016). EU General Data
Protection Regulation.
Cser, A. (2017). Use Commercial IAM Solutions To
Achieve More Than 100 Percent ROI Over Manual
Processes. Technical report, Forrester.
Dell (2011). Identity and Access Management. Technical
report, Dell Inc.
Fisher, P. (2016). Identity and Access Management in the
Digital Age. Technical report, CXP Group Company.
Fuchs, L. and Pernul, G. (2008). HyDRo–Hybrid Develop-
ment of Roles. Information Systems Security, pages
287–302.
Fuchs, L., Pernul, G., and Broser, C. (2009). Different Ap-
proaches to in-house Identity Management. In Proc of
the 4th International Conference on Availability, Re-
liability and Security (ARES 2009). IEEE Computer
Society, Fukuoka, Japan.
Gartner (2009). MarketScope for Enterprise Single Sign-
On. Technical report, Gartner.
Harvard, U. (2014). Identity and Access Management - Pro-
gram Plan.
Hermans, J. (2008). European Identity & Access Manage-
ment Survey. Technical report, KPMG.
H
¨
ollrigl, T., Schell, F., Suelmann, S., and Hartenstein, H.
(2008). Towards systematic engineering of Service-
Oriented access control in federated environments.
In Congress on Services Part II, 2008. SERVICES-2.
IEEE. IEEE.
Hovav, A. and Berger, R. (2009). Tutorial: Identity Man-
agement Systems and Secured Access Control. Com-
munications of the Association for Information Sys-
tems, 25(1):42.
Kazman, R., Barbacci, M., Klein, M., Carri
`
ere, S. J., and
Woods, S. G. (1999). Experience with performing
architecture tradeoff analysis. In Proceedings of the
21st international conference on Software engineer-
ing. ACM.
Kunz, M., Fuchs, L., Hummer, M., and Pernul, G. (2015).
Introducing dynamic identity and access management
in organizations. In International Conference on In-
formation Systems Security. Springer.
Meier, S., Fuchs, L., and Pernul, G. (2013). Managing the
Access Grid - A Process View to Minimize Insider
Misuse Risks. In 11th International Conference on
Wirtschaftsinformatik (WI2013). University Leipzig.
Peterson, G. (2006). Introduction to identity management
risk metrics. IEEE Security & Privacy, 4(4):88–91.
Royer, D. (2007). Enterprise identity management-what’s
in it for organisations?. In FIDIS.
Royer, D. (2013). Enterprise Identity Management: To-
wards an Investment Decision Support Approach.
Springer Science & Business Media.
Royer, D. and Meints, M. (2008). Planung und Bewertung
von Enterprise Identity Managementsystemen. Daten-
schutz und Datensicherheit-DuD, 32(3):189–193.
Schell, F., Dinger, J., and Hartenstein, H. (2009). Per-
formance evaluation of identity and access manage-
ment systems in federated environments. In Infoscale.
Springer.
Software Engineering of America (2015). Reduce IBM i
Help Desk Costs with Self Service Password Reset.
Technical report, Software Engineering of America.
Staite, C. and Bahsoon, R. (2012). Evaluating identity man-
agement architectures. In Proceedings of the 3rd in-
ternational ACM SIGSOFT symposium on Architect-
ing Critical Systems. ACM.
United States Congress (1996). Health Insurance Portability
and Accountability Act.
United States Congress (2002). Sarbanes-oxley act of 2002,
pl 107-204, 116 stat 745. Codified in Sections 11, 15,
18, 28, and 29 USC.
Windley, P. J. (2005). Digital Identity: Unmasking identity
management architecture (IMA). ” O’Reilly Media,
Inc.”.
Witty, R. J. (2003). Five Business Drivers of Identity and
Access Management. Technical report, Gartner.
ICISSP 2018 - 4th International Conference on Information Systems Security and Privacy
240
