
Integrating Fuzzy Cognitive Mapping and Bayesian Network
Learning for Supply Chain Causal Modeling
Behnam Azhdari
Department of Management, Khark Branch, Islamic Azad University, Shohada St. Khark Island, Boushehr, Iran
Keywords: Integrated Method, Supply Chain Management, Supply Chain Performance, Causal Bayesian Network.
Abstract: In this study, by integrating fuzzy cognitive mapping (FCM) and causal Bayesian network (CBN) learning, a
model of causal links among supply chain enablers, supply chain management practices and supply chain
performances is developed. For FCM development, fuzzy causal knowledge of a panel of experts in SCM is
elicited. Also, an industry survey data used in a Bayesian learning process to create a CBN. By applying
analytical modifications, the resultant CBN model is modified to reach better fit indices, suggesting a new
approach in Bayesian learning. Integrating FCM and CBN models, resulted in more valid causal relations that
are based on these two different methodologies. The findings of this study support the notion that SC enablers,
especially IT technologies, don't have direct impact on SC performance. Also it is revealed that in any tier of
supply chain concepts; there may be some important intra-relations which worth further studies.
1 INTRODUCTION
Although organizational performance is important,
today's business competition is mostly among supply
chains and not just between individual organizations.
Supply chain enablers are required tools to practice
effective supply chain management. So, to improve
SC performance, it is necessary to study the impact of
SC enablers and SCM practices on SC performance.
In recent years the investigation to find out the
relation between these concepts of supply chains is at
the heart of interest of many academics and SCM
practitioners. Despite the role of SC enablers and
SCM practices, there is a scarcity in literature about
effects of these SC elements on SC performance,
especially in developing countries.
The goal of this research is to develop an approach
based on causal Bayesian networks (CBN) modeling
to model the causal relations between SC enablers,
SCM practices and SC performance in some Iranian
supply chains. Iran is now at a challenging path to free
itself from the sanctions and oil based economy, so
any improvement in its supply chains may be vital to
this path. This model has been developed for a local
case.
The reminder of this paper is as follows. In section
2, influential papers about relations between SC
enablers, SCM practices and performance will be
reviewed. In section 3, the research constructs and
fuzzy cognitive mapping methodology are described.
Afterwards, data gathering and measurement
instrument are discussed. In section 4, causal
Bayesian network modelling is deliberated. Finally,
FCM and CBN models will be integrated in order to
reach a more valid causal model. In section 5, the
results and implications will be discussed.
Conclusions and study limitations and also future
research suggestions are discussed in Section 6.
2 RELATIONSHIPS BETWEEN
SC ENABLERS, SCM
PRACTICES AND SC
PERFORMANCE
Studying the relations between SC enablers and SCM
practices and their effect on performance is matter of
interest to many academics and SCM practitioners. A
review of these works is depicted in Table 1. As this
table shows, the authors of these studies were more
focused on organizational performance (Narasimhan
and Jayanth, 1998; Frohlich and Westbrook, 2001;
Tan et al., 2002; Li and Lin, 2006).
In one of the first papers in this context that
considers SC performance, Shin et al., (2000) worked
Azhdari, B.
Integrating Fuzzy Cognitive Mapping and Bayesian Network Learning for Supply Chain Causal Modeling.
DOI: 10.5220/0006556900590070
In Proceedings of the 7th International Conference on Operations Research and Enterprise Systems (ICORES 2018), pages 59-70
ISBN: 978-989-758-285-1
Copyright © 2018 by SCITEPRESS – Science and Technology Publications, Lda. All rights reserved
59

on the effect of supply chain management
orientations on SC performance. They concluded that
improvement in supply chain management
orientation, including some SC practices, can
improve both the suppliers’ and buyers’ performance.
In other study, Lockamy and McCormack (2004)
investigated the relationships between SCOR model
planning practices with SC performance. According
to the results of this paper, planning processes are
critical in all SCOR supply chain planning decision
areas and collaboration is the most important factor in
the plan, source and make planning decision areas.
Lee et al., (2007) also studied the relationships
between three SC practices, including supplier
linkage, internal linkage and customer linkage, and
SC performance. They concluded that internal
linkage is a main factor of cost-containment
performance and supplier linkage is a crucial
indicator of performance reliability as well as
performance. In another work, Sezen (2008)
investigated the relative effects of three SCM
practices including supply chain integration, supply
chain information sharing and supply chain design on
supply chain performance. He concluded that the
most important effect on resource and output
performances belongs to supply chain design. In
addition he concluded that information sharing and
integration are correlated with performance, but their
effect strength are lower than supply chain design. In
one of the newest works in this area, Ibrahim and
Ogunyemi (2012) tested the effect of information
sharing and supply chain linkages on supply chain
performance. Their results showed that supply chain
linkages and information sharing, positively related to
flexibility and efficiency of supply chain.
Seemingly the first article, in which authors
consider the effects of both SC enablers and SCM
practices on SC performance, is the study of Li et al.,
(2009). They investigated the relations between three
factors including IT implementation as an important
SC enabler, supply chain integration as an SCM
practice, and SC performance. As a result, they
suggested that IT implementation has no direct
impact on SC performance, but it improves SC
performance through its positive impact on SC
integration. Zelbst et al., (2010) theorized and
assessed a structural model that includes RFID
technology utilization and supply chain information
sharing as antecedents to supply chain performance.
The results of aforementioned study indicates that
although RFID technology does not directly affect SC
performance, its utilization leads to improve
information sharing among supply chain members,
which in turn leads to improve SC performance.
Qrunfleh and Tarafdar (2015) examine alignment
between supply chain management (SCM) practices
and information technology (IT) utilization and its
impact on supply chain performance and firm
performance by using structural equation modeling.
Table 1: Relationships between SC Enablers, SCM practices and SC performance in the literature.
References
Scope of SC
enablers
Scope of SCM
practices
Methodology
Scope of performance
measurement
Narasimhan and Jayanth (1998)
-
Narrow
SEM
Organization
Shin et al., (2000)
-
Narrow
SEM
Supply chain
Frohlich and Westbrook (2001)
-
Narrow
ANOVA
Organization
Tan et al., (2002)
-
Wide
Correlation
Organization
Lockamy III and McCormack (2004)
-
Narrow
Regression
Supply chain
Li and Lin (2006)
Wide
Wide
Regression
-
Li et al., (2006)
-
Wide
SEM
Organization
González-Benito (2007)
Narrow
Narrow
SEM
Organization
Sanders (2007)
Narrow
Narrow
SEM
Organization
Zhou and Benton Jr. (2007)
Narrow
Narrow
SEM
-
Li et al., (2007)
-
Narrow
SEM
Organization
Lee et al., (2007)
-
Narrow
Multiple regression
Supply chain
Johnson et al, (2007)
Wide
-
Regression
Organization
Devaraj et al., (2007)
Narrow
Narrow
SEM
Organization
Sezen (2008)
-
Narrow
Regression
Supply chain
Li et al, (2009)
Wide
Narrow
SEM
Supply chain
Bayraktar et al., (2009
(
-
Wide
SEM
Organization
Hsu (2009)
-
Wide
SEM
Organization
Davis-Sramek et al., (2010)
Narrow
-
Regression
Organization
Zelbst et al., (2010)
Narrow
Narrow
SEM
Supply chain
Sundram et al., (2011)
-
Wide
PLS
Supply chain
Hamister (2012)
-
Wide
PLS
Supply chain
Ibrahim
and
Ogunyemi (2012
(
-
Narrow
Regression
Supply chain
Amr Youssef and Islam El-Nakib (2015)
-
Wide
Regression
Organization
ICORES 2018 - 7th International Conference on Operations Research and Enterprise Systems
60

This study shows that inter-firm SCM practices – IT
use external alignment and information SCM
practices – IT use infrastructural alignment are
positively associated with supply chain performance
and firm performance. Tatoglu et al., (2016) study the
impact of supply chain management and information
systems (IS) practices on operational performance of
small and medium-sized enterprises operating in two
neighboring emerging country markets of Turkey and
Bulgaria. They also investigate moderating effects of
both SCM–IS-linked enablers and inhibitors on the
links between SCM and IS practices and operational
performance of SMEs. The results of regression
analyses indicated that SCM and IS practices as well
as SCM–IS-related enabling factors positively
influenced SMEs’ operational performance.
2.1 Conceptual Model
Although there is no doubt about the importance of
the relations between SC enablers, SCM practices and
SC performance, not many studies can be found in the
literature which cover these relations in a whole
model. Thus, this research develops a basic
conceptual model of relationships among SC
enablers, SCM practices and SC performance (Figure
1). As depicted in this model, based on the literature
(Li et al., 2009; Zelbst et al., 2010), this research
suggests that SC enablers have direct impact on SCM
practices and no direct impact on SC performance.
Figure 1: Proposed basic conceptual model.
3 RESEARCH METHODOLOGY
3.1 Identifying Constructs
In this section, the method of identifying the
“constructs” which are required for FCM
questionnaire and also for Bayesian networks survey
instrument has been explained.
3.1.1 Constructs of SC Enablers and SCM
Practices
As discussed in the literature review, not all
researchers have consensus about the definition of SC
enablers and SCM practices. Even, in some instances
one SC enabler is confused with SCM practice and
vice versa. Thus, in order to achieve a valid list of SC
enablers and SCM practices, and eliminating
ambiguous statements for content validity, Q-sort
methodology was used. The Q-sort method is an
iterative process in which the degree of agreement
between judges forms the basis of assessing construct
validity and improving the reliability of the constructs
(Li et al., 2005). To apply Q-sort method, six
researchers and experts were questioned, to classify
the specified initial items into SC enabler and SCM
practice categories. To assess the reliability of the Q-
sort results, the item placement ratios were used
(Boon-itt and Himangshu, 2005).
Q-sort resulted in 20 SC enablers out of 22 and 44
SCM practices out of 54 initial items. The judges'
agreement for these items was more than 70%, which
is above the recommended value of 65% (Li et al.,
2005). Furthermore, information network, advanced
manufacturing technology, and logistic infrastructure
were classified as SC enablers while they are cited in
the literature as SCM practices. This identification
seems rational because it's more consistent with SC
enabler definition.
Towards a final list of SC enablers and SCM
practices, content analysis was used to identify
similar statements and merge some similar items to
definitive ones. As a result, 7 SC enablers and 8 SCM
practices were identified.
3.1.2 SC Performance
One of the most significant factors in measuring SC
performance is its comprehensiveness (Beamon,
1999). According to some authors, (Bhagwat and
Sharma, 2007; Chae, 2009; Shepherd and Günter,
2006), models such as BSC and SCOR can be very
effective for SC performance measurement to
embrace all important supply chain performance
dimensions. Afterwards, to identify important SC
performance measures, supply chain management
processes from SCOR model was used, which
includes plan, source, make and deliver. The return
process was excluded, due to its limited
implementation in many cases which we were
involved.
3.2 Fuzzy Cognitive Mapping
Fuzzy cognitive maps are fuzzy-graph structures for
representing causal reasoning. Their fuzziness allows
hazy degrees of causality between hazy causal objects
(Kosko, 1986). A fuzzy causal map composed of
nodes that represent concepts of interest and weighted
arrows indicating different causal relationships with
different strengths among these concepts. Fuzzy
Integrating Fuzzy Cognitive Mapping and Bayesian Network Learning for Supply Chain Causal Modeling
61

cognitive map models can be developed by experts
and/or computationally (Stach et al., 2010).
To integrate the qualitative knowledge of SCM
experts and practitioners with quantitative Bayesian
network model from field data, expert-based FCM
was used to develop the initial model of interest. To
achieve this goal, a group of 14 participating experts
were selected, half of them with good experience in
managing supply chains and the other half with good
academic background. These experts were asked to
fill out a matrix questionnaire regarding the impacts
of SC enablers on SCM practices as well as the
impacts of SCM practices on SC performance with
linguistic terms of "none", "weak", "moderate",
"strong" and "very strong". Each of these linguistic
terms treated as fuzzy triangular number with
membership functions as depicted in Figure 2.
Figure 2: Linguistic term set of five labels with its
semantics.
3.2.1 Aggregated Fuzzy Cognitive Map
The average of each fuzzy relationship weight
correspondent to all experts was calculated, with the
assumption that all experts are equally credible. The
final combined connection matrix had fuzzy
triangular numbers. Thus, for a fuzzy cognitive map
with linguistic weights, a simple procedure was used,
in which fuzzy numbers of the matrix were compared
to fuzzy number of "weak". If any fuzzy numbers of
this matrix was identified as strongly greater than
"weak", its corresponding relation in FCM
connection matrix was labeled as "strong" and if
identified as moderately greater than "weak", its
corresponding relation in FCM connection matrix
was labeled as "moderate". For comparing fuzzy
numbers, a fuzzy ranking method was used based on
possibility and necessity theory (Dubois and Prade,
1983) as follows:
A
p
and A
n
has been defined as auxiliary functions for
comparing two fuzzy numbers (Menhaj, 2006):
)()( uAuA
xu
P
(1)
( ) 1 ( )
n
ux
A u A u
(2)
Therefore A
p
is a fuzzy set which is possibly greater
than or equal to fuzzy number A. Also, A
n
is a fuzzy
set which is necessarily greater than or equal to A. So
for a fuzzy triangular number A(l, c, r), A
p
and A
n
are computed as:
0
( ) ( ) ,
1
p
ul
A u A u l u c u U
uc
(3)
0
( ) 1 ( ) ,
1
n
uc
A u A u c u r u U
ur
(4)
For comparing two fuzzy numbers A and B, П
B
(A
p
)
and П
B
(A
n
) were used:
( ) ( ( ) ( ))
( ) ( ( ))
pp
B
v
v
uv
A B v A v
B v A u
(5)
( ) ( ( ) ( ))
( ) ( (1 ( )))
nn
B
v
v
uv
A B v A v
B v A u
(6)
П
B
(A
p
) indicates the possibility that the maximum
value of V (the reference set of B) is greater than or
equal to the minimum value of U (reference set of A).
Also, the value of П
B
(A
n
) indicates the possibility that
the maximum value of V (reference set of B) is
greater than or equal to the maximum value of U
(reference set of A). So two rules can be developed
for comparing fuzzy numbers of A and B (Menhaj,
2006):
Rule 1. If
)(
pB
A
is greater than
)(
pA
B
then B is greater than A.
Rule 2. If
)(
nB
A
is greater than
)(
nA
B
then
B is greater than A.
A simple combination of Rules 1 and 2 can be used
to compare two fuzzy numbers of A and B:
• If B was identified as greater than A, based on
both above rules, it will be suggested that B is
strongly greater than A.
• If B was identified as greater than A, based on just
one of above rules, it will be suggested that B is
moderately greater than A.
• If B was identified as less than or equal to A,
based on both above rules, it will be suggested that
B is not greater than A.
ICORES 2018 - 7th International Conference on Operations Research and Enterprise Systems
62
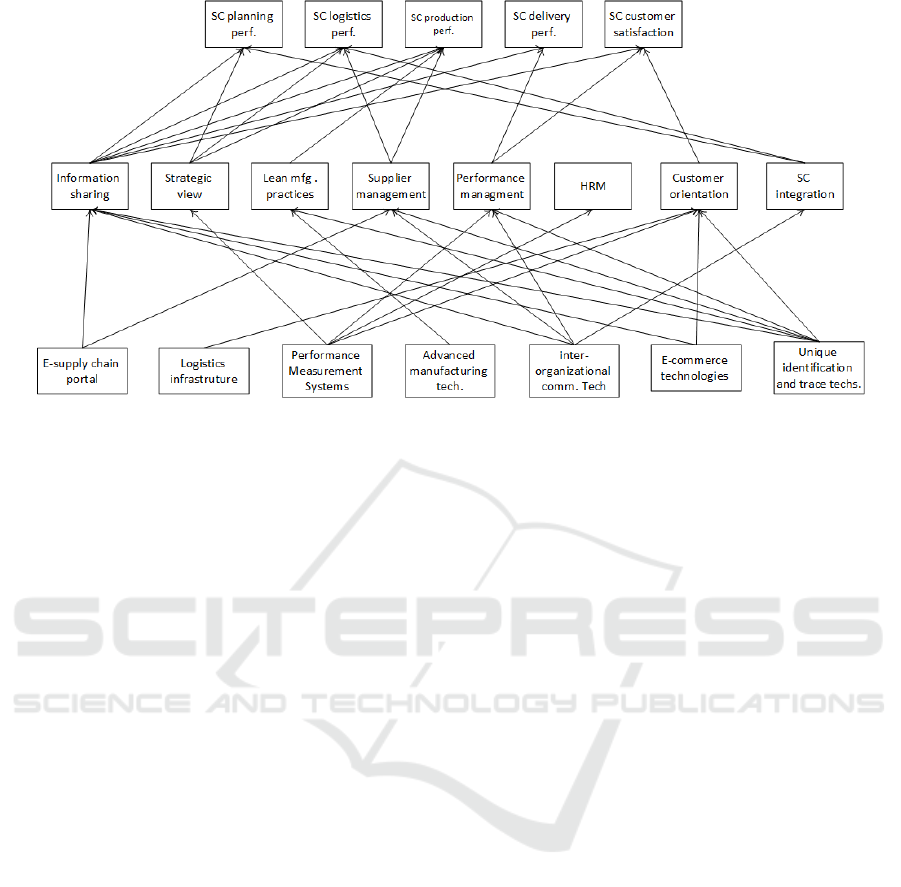
Figure 3: Aggregated FCM model of strong causal effects.
By using above procedure, the final FCM
connection matrix was reached with linguistic terms
and final FCM graph based on this matrix was
acquired, depicted in Figure 3. For simplicity, only
strong relations are shown.
3.3 Data Collection
Prior to data collection, an initial survey instrument
was pre-tested for content validity. A panel of 4
researchers' participated in FCM phase were asked to
evaluate the questionnaire, regarding ambiguity,
appropriateness, and completeness. By reviewing a
few resulted comments, the survey questionnaire was
modified and finalized.
Our target sample was collected from
manufacturers of 10 products classes, covered by
IranCode® products classification system. It was
suggested that the firms with more products are
suitable to be selected as the sample. Herein the firms
were sorted, based on the number of their registered
products in IranCode®. Then, by using stratified
random sampling, a sample of 2000 firms was
selected and they were asked to fill out the
questionnaire. In order to make the submissions as
convenient as possible, participants were offered
several options for returning the questionnaire (via
email, via mail, or via fax). After four weeks, for
following up the procedure, personalized reminder e-
mails were sent to potential participants. Finally, out
of 2000 surveys mailed, 199 valid responses were
received, resulting in a response rate of 11.63%,
which is acceptable as some other studies in this field
(Ou et al., 2010; Li and Lin, 2006).
Non-response bias was assessed by performing a
t-test on the scores of early and late responses. The
responses were divided into two groups: 142
responses (71.4%) received within 3 weeks after
mailing, and 57 ones (28.6%) received four weeks
later and even more. The result of t-test between early
and late respondents indicated no significant
difference between the two groups.
As this study relied on single respondents and
perceptual scales to measure dependent and
independent variables, the presence of common
method variance was assessed (Kim et al., 2012). A
model was run without the method factor and it was
compared to the one with method factor added
(Bagozzi, 2011). Since the method factor failed to
change substantive conclusions, it was concluded that
the amount and extent of method variance is not a
threat to the validity of the measurement model.
Sample responses included 24% food products
manufacturers, 19.8% road making machinery and
construction materials manufacturers, 12.8%
chemical manufacturers, 11.2% medical and
cosmetic manufacturers, 9.6% industries general
necessities manufacturers, 8.6% auto parts
manufacturers and 13.8% other manufacturers. Of all
respondents, 28% were CEO, President, Vice
President or Director, 22% were production managers
and RandD managers, 19% were sales managers,
procurement managers and supply managers, and
remaining 17% of respondents were other manager.
So this composition reveals that most of respondents
were knowledgeable about firm’s supply chain
management.
Integrating Fuzzy Cognitive Mapping and Bayesian Network Learning for Supply Chain Causal Modeling
63

3.4 Measurement of Variables
3.4.1 Measures of SCM Practices and SC
Enablers
Eight SCM practices were identified and seven SC
enablers to include in survey instrument, as
mentioned in Table 3. The scale items for measuring
these constructs are derived from past studies and
applying Q-sort methodology as described in
previous sections. In case of SCM practices the
respondents were asked to indicate that what extent
these scale items were implemented in SCM of their
core products, relying on five-point scales ranging
from 1 = ‘not at all implemented’ to 5 = ‘fully
implemented’. In case of SC enablers, the
respondents were asked to indicate their perceptions
of relative importance of these enablers in SCM of
their core products on five-point scales ranging from
1= ‘of no importance’ to 5 = ‘of major importance’.
3.4.2 SC Performance
As mentioned in FCM part of this study, the measures
of SC performance was used according to supply
chain management processes of SCOR model,
including scale items for measuring ‘SCM planning’,
‘logistics performance’, ‘supply chain production
performance’, ‘supply chain delivery performance’,
and ‘customer delight performance’. The respondents
were asked to indicate on a 6-point scale, ranging
from 1= ‘definitely worse’ to 6= ‘definitely better’,
on how their core products supply chain had
performed relative to their major competitors or their
overall industry on each of these supply chain
performance criteria.
3.5 Reliability and Validity
In addition to content validity, mentioned in previous
sections, the adequacy of a measure requires that
three essential components be established:
unidimensionality, reliability and validity (O'Leary-
Kelly and Vokurka, 1998). Validity itself includes
convergent validity and discriminant validity. So
CFA was used for measurement model relevant tests.
As the measurement model had more than four-point
scales, based on Bentler and Chou (1987)
recommendation, the maximum likelihood method of
LISREL was used for calculating model fit indexes,
that is a more common and reliable method (Bentler
and Chou, 1987). For assessing model fitting, two
critical indexes of CFI and SRMR was used as
recommended by Hu and Bentler (1999) for less than
250 samples. The models were identified with CFI ≥
0.95 and SRMR ≤ 0.09 as acceptable (Hu and Bentler,
1999).
In the first stage, unidimensionality was tested,
that involves establishes a set of empirical indicators
relates to one and only one construct (O'Leary-Kelly
and Vokurka, 1998). A single factor LISREL
measurement model was specified for any construct.
If a construct had less than four items, two-factor
model were tested by adding the items of another
construct, making model fit indexes obtainable (Li et
al., 2005). A CFA was conducted to separate
measurement models of each construct, such as
information sharing, strategic view in supply chain
management and lean manufacturing practices. It was
found that fitting indexes of some constructs were
unsatisfactory. Then, the standardized residuals
matrix of LISREL results were used to identify which
items must be deleted to obtain better fit indexes for
each model. Large standardized residuals indicate
that a particular relationship is not well accounted by
the model (Schumacker and Lomax, 2004). During
this iterative procedure, one item out of measurement
items of strategic view in supply chain management,
lean manufacturing practices, performance
management, general enablers, logistics and supply
performance, and delivery performance were
dropped. Additionally, two items out of eight
measurement items of integration were dropped.
Table 5 shows the analysis results of the final
structural model of all constructs.
In the second stage, the reliability analysis was
conducted by using composite reliability (7) which is
less sensitive to number of items of constructs
(Fornell and Larcker, 1981).
ρ
,
(7)
As depicted in Table 3, all of model constructs have
an acceptable level of reliability, except production
performance which its reliability index (ρ) is less than
0.7 cut-off criteria. SCP31 item was dropped from SC
production performance construct to improve its
reliability. So this construct finally reached the value
of 0.9, which is a good level.
In the third stage for analysing construct validity,
the convergent validity and discriminant validity
were assessed. Convergent validity relates to the
degree to which multiple methods of measuring a
variable provide the same results (O'Leary-Kelly and
Vokurka, 1998). Based on Fornell and Larcker (1981)
recommendation, the average variance extracted
(AVE) was used to analyse convergent validity. An
ICORES 2018 - 7th International Conference on Operations Research and Enterprise Systems
64

Table 2: Constructs properties for unidimesionality, reliability and convegent validity.
Constructs
χ
2
df
CFI
SRMR
ρ
AVE
General SC enablers
57.70
26
0.97
0.05
0.84
0.65
Information sharing
22.24
8
0.95
0.06
0.78
0.73
Strategic view in supply chain management
6.47
5
0.99
0.03
0.76
0.62
Lean manufacturing practices
0.57
2
1.00
0.01
0.82
0.72
Supplier management
22.24
8
0.95
0.07
0.70
0.66
Performance management
7.43
2
0.96
0.05
0.70
0.59
SC Human resources management
33.45
8
0.96
0.04
0.72
0.75
Customer orientation
33.45
8
0.96
0.04
0.89
0.82
Supply chain integration
31.84
9
0.97
0.05
0.89
0.75
SC planning performance
41.12
10
0.96
0.04
0.90
0.95
SC logistics and supply performance
41.12
10
0.96
0.04
0.80
0.82
SC production performance
41.12
10
0.96
0.04
0.42
0.51
SC delivery performance
41.12
10
0.96
0.04
0.90
0.95
SC customer delight performance
41.12
10
0.96
0.04
0.86
0.89
AVE greater than 0.5 is desirable because it suggests
that on average, the latent construct accounts for a
majority of the variance in its indicators (MacKenzie
and Podsakoff, 2011). Based on this criterion, as
shown in Table 5 all research constructs have
acceptable convergent validity.
For a measure to have discriminant validity, the
variance in the measure should reflect only the
variance attributable to its intended latent variable
and not to other latent variables (O'Leary-Kelly and
Vokurka, 1998). In analysing discriminant validity
for SC management practices, as recommended by
Shiu et al. (2011) both procedures of Fornell and
Larcker (1981), and Bagozzi and Phillips (1982) were
used. Based on the first procedure, the average
variance extracted (AVE) of any construct must be
bigger than the correlation between that construct and
any other constructs of the model. On the basis of the
second procedure, the difference in chi-square value
between the unconstrained CFA model and the nested
CFA model was examined where the correlation
between the target pair of constructs is constrained to
unity. Based on these two procedures it was found out
that all constructs have discriminant validity except
the constructs of “Human resources management”
and “Supplier management” which is one of
limitations of this study.
3.6 Building Causal Bayesian Network
Because of its descriptive and practical power, causal
modelling approaches, like structural equation
modelling, are being used to model inter-relationships
of SCM concepts in many researches (Narasimhan
and Jayanth, 1998; Bayraktar et al., 2009; Zelbst et
al., 2010). In this study Bayesian network learning
algorithms was used. Because as stated by
Heckerman (1997), a Bayesian network is an efficient
way for learning causal relationships, and hence can
be used to gain deeper understanding about a problem
domain and to predict the consequences of
intervention, which is not available in other
approaches like SEM or PLS. Furthermore, a
Bayesian network model has both causal and
probabilistic semantics, which is an ideal
representation for combining prior knowledge and
data (Anderson and Vastag, 2001).
To build a Bayesian network the data needs to be
categorical. This way, the categorical measurements
for each concept can be obtained by applying k-
means cluster analysis (McColl-Kennedy and
Anderson, 2005).
In this study, Two-state categorization for the
constructs of SC enabler and SCM practices, and
three-state categorization for the constructs of SC
performance were applied. For Bayesian causal
modelling, TETRAD IV was used which is a package
that created by Spirtes et al., (1993) at Carnegie
Mellon University. This software offers a remarkable
graphical user interface and facilitates building,
evaluating, and searching for causal models
(Landsheer, 2010).
In causal modelling process, first the categorical
data was entered to TETRAD IV package. In next
step, by using its knowledge module, the order of
variables was specified. In Figure 4, SC enablers are
specified at first order and SCM practices at second
and SC performance measures at last. In addition, it
was specified that in each group of SC enablers and
SCM practices, no inter-relationships be allowed by
software, avoiding hyper-complex network.
4 RESULTS
Running the PC algorithm with prior knowledge, as
described in previous section, resulted in the model of
Integrating Fuzzy Cognitive Mapping and Bayesian Network Learning for Supply Chain Causal Modeling
65
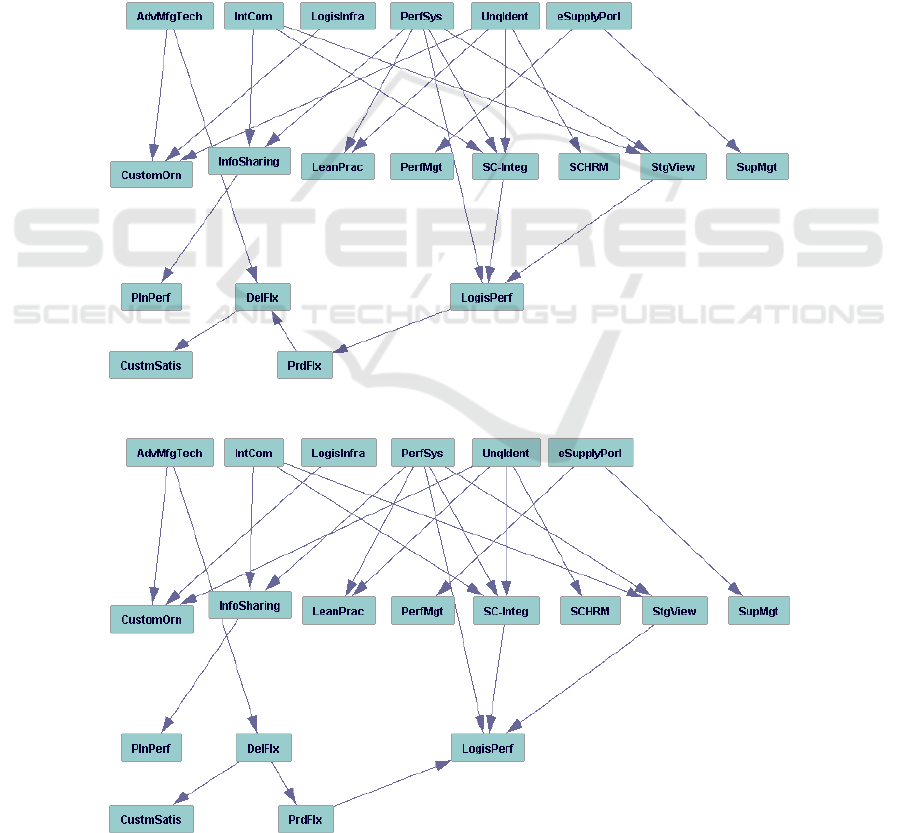
Figure 4. The resulted model (Figure 4) has degree of
freedom of 148, chi-square of 545 and BIC of -238.
At the first glance, it can be seen that advanced
manufacturing technology such as SC enabler has
direct impact on SC performance (delivery
flexibility). In this model, delivery flexibility is
antecedent of production flexibility and customer
satisfaction. In addition, production flexibility is
antecedent of logistics performance. This research
suggests that the production flexibility must be
antecedent of delivery performance, so this relation in
resultant model was modified. The resultant model
(Figure 5) have degree of freedom of 148, chi-square
of 546 and BIC of -236 which are totally better than
previous model fit indices, verifying the
modifications.
4.1 Combining Causal Bayesian
Network with FCM Model
As described earlier, FCM methodology was used to
extract qualitative knowledge of SCM experts and
practitioners about study variables. Therefore it was
concluded that the resulted FCM model depicts the
strengths of causal relations of SCM constructs.
Additionally, a quantitative causal Bayesian network
model was built which is extracted from survey data
of current state of study variables. Furthermore, to
increase more internal validity, these models were
combined into an integrated model. This one is based
on two different methodologies with two different
types of input, one based on causal relations and the
other one based on current state of study variables.
Figure 4: Output of PC algorithm with prior knowledge.
Figure 5: Final Bayesian network model with modified arrows of SC performance indices.
ICORES 2018 - 7th International Conference on Operations Research and Enterprise Systems
66
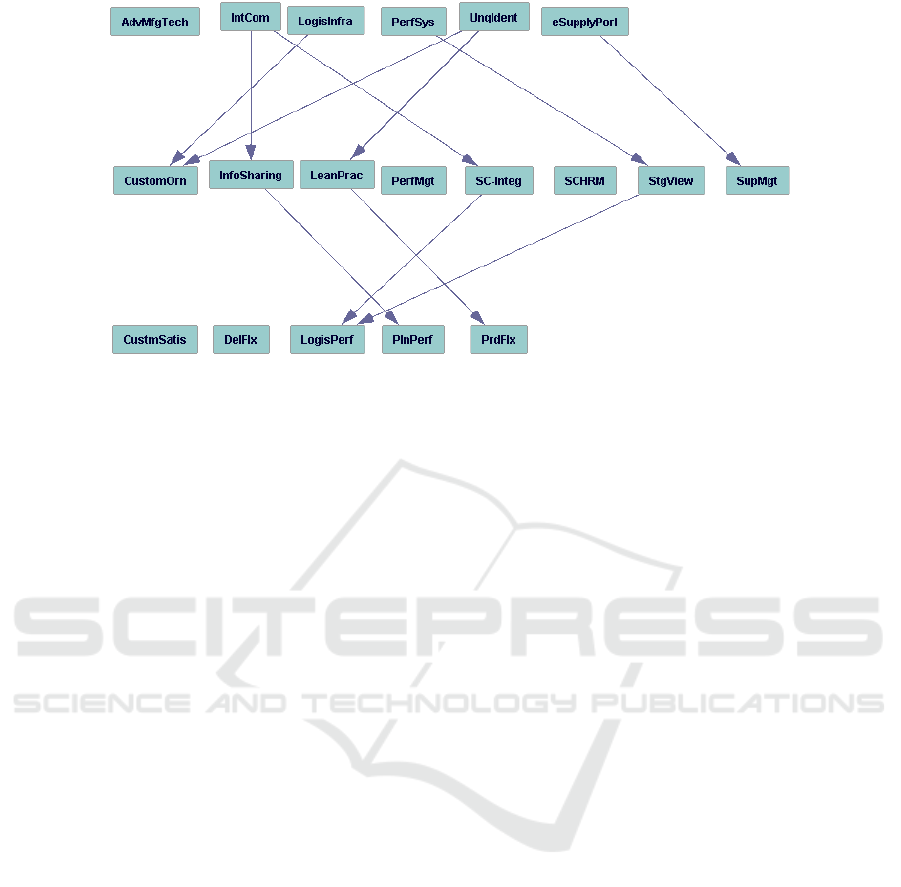
Figure 6: Final integrated causal model.
According to the integrated model, any causal
relations presented in both models were kept while
the others were dropped. The final model, depicted in
Figure 6, is the one which its causal relations are
based on both prescribed methodologies. This final
model has degree of freedom of 160, chi-square of
687 and BIC of -159 which is better than previous
ones from the point of view of BIC fit indexes.
Consequently, it can be claimed that this final model
has more internal validity than the two primary
models.
5 DISCUSSION AND
IMPLICATIONS
Our model contributes to the SCM body of
knowledge by modelling causal relations between SC
enablers, SCM practices, and SC performance. As a
general outcome, the findings of this study support
the notion that SC enablers, especially IT
technologies, don't have direct impact on SC
performance (Li et al., 2009; Zelbst et al., 2010). By
focusing on CBN model (Figure 6), it can be observed
that there may be some exceptions, like direct impact
of advanced manufacturing technologies on SC
delivery performance. However, this needs to be
more investigated. Specific findings and relevant
managerial implications of this research can be
summarized as follows:
The results provide evidence that inter-
organizational communication technologies have
direct impact on information sharing which is in line
with findings of Li and Lin (2006). Also, information
sharing has direct impact on supply chain planning.
Supply chain integration has direct impact on
logistics performance. So it can be suggested that the
impact of inter-organizational communication
technologies on planning performance in supply
chain is depending on level of the information
sharing. Also inter-organizational communication
technologies have causal impact on logistics
performance conditional on the level of supply chain
integration. In the case of unique identification
technologies, it can be seen that this enabler has
causal impact on production flexibility conditional on
the level of lean practices in supply chain. Based on
FCM model it is expected that strategic views have
more effect on SC performances but as a result of
CBN modelling we find out that this SCM practice
direct impact is just on logistics performance.
Although more causal relations in integrated
model are expected, it been observed that many of
extracted relations in FCM are not in the final
Bayesian network and vice versa, but not in the
integrated model. Specially, there is not any
antecedent for SC HRM and performance
management as SCM practice, and customer
satisfaction and delivery flexibility as SC
performance aspects. By comparing the final
Bayesian network model as depicted in Figure 5 and
integrated model of Figure 6, this study can suggest
some explanations that describe why many expected
causal links are absent in final model. First, in fuzzy
cognitive mapping stage of this study, the
questionnaire is limited to inter-relations between SC
enablers and SCM practices and also between SCM
practices and SC performance aspects but not any
intra-relations. As can be seen in Figure 6, intra-
relations in tier of SC performance criteria can reveal
some critical causal relations. In this figure, customer
satisfaction is under impact of delivery flexibility and
Integrating Fuzzy Cognitive Mapping and Bayesian Network Learning for Supply Chain Causal Modeling
67

production flexibility is antecedent of delivery
flexibility. These relations imply that in any tier of
supply chain concepts, there may be important intra-
relations which worth further studies and neglecting
them may blur final results. Second, direct relations
between SC enablers and SC performance aspects
were not considered. It has been witnessed that
advanced manufacturing technology may have direct
impact on delivery flexibility.
6 CONCLUSION AND
LIMITATIONS
This research studied a model of causal relations in
the context of supply chain management, by applying
two different methodologies of FCM and causal
Bayesian network modelling and combing resultant
models in an integrated one. Both models revealed
important causalities between study variables of
interest, and integrating them provide us more valid
causal relations.
This study has some limitations that are the
starting points for further research, regarding
methodologies and scopes. First, the sample
population was drawn from the members of the
IranCode
®
. Although this sample covered a wide
range of firms in terms of industry, size, and
geography, it cannot be claimed that the results of this
research can be generalized, especially because the
response rate was not high and this study was based
on a self-assessment of the single participants from
sample firms. So, further studies can be carried on for
narrower groups of industries with larger sample
sizes. Causal sufficiency is a determinant in
probabilistic causal modelling. Thus, it is needed to
identify any other contributing variable in a study of
causal relation of two variables. This motivates doing
a research of a SCM causal modelling with more
comprehensive list of SCM elements. Moreover, to
avoid burdening of experts, the FCM modelling was
restricted to causal relations between SC enablers and
SCM practices and also between SCM practices and
SC performance indicators. In CBN model, some
important intra-relations of SCM element's tier worth
further study. Particularly studying intra-relations
between SCM practices may reveal many interesting
results which contribute to better understand
dynamics of SCM practices. The set of SC
performance aspects were selected based on
reachable data and some indicators were eliminated
because of measurement model validity. Hereafter,
more definitive and comprehensive SC performance
measurement will contribute to attaining more valid
SCM causal models in future studies. The major
strength of Bayesian networks is that probabilistic
inference can be made directly from the conditional
probabilities (Blodgett and Anderson, 2000). Further
studies that consider these conditional probabilities of
CBN may consists of some valuable contributions to
more detailed understanding of causal relations in
SCM context.
Despite these limitations, this study has the
following contributions to the development of the
literature and practice. The first contribution of this
study is a comprehensive list of supply chain enablers
and supply chain management practices which is
useful for further studies in this area, and as
mentioned by Li et al., (2005), which were not
realized before. Second, an expert-based FCM with
fuzzy ranking methodology was created by using
possibility and necessity theory (Dubois and Prade,
1983) to transform fuzzy numbers to linguistic terms,
which is a new approach in this context. Third, a
causal Bayesian network model was created from
field data of Iranian industries and then using the
TETRAD IV tools, modified this model to reach
better fit indices, such an analytical modification
towards a better model to fit indices is a new approach
in methodology. Forth, a simple rule was used to
combine FCM and CBN models and extract an
integrated model which is a new effort in this context.
At last, with CBN analysis, it was found out that in
any tier of supply chain elements there are some intra-
relations that may have important impact on SCM
study and supply chain design and management.
REFERENCES
Anderson, R. D., and Vastag, G., 2004. Causal modeling
alternative in operations research: overview and
operation. European Journal of Operational Research,
156, 92-109.
Bagozzi, R. P., 2011. Measurement and Meaning in
Information Systems and Organizational Research:
Methodological and Philosophical Foundations. MIS
Quarterly, 35(2), 261-292.
Bagozzi, R. P., and Phillips, L., 1982. Representing and
testing organizational theories: a holistic construal.
Administrative Science Quarterly, 27, 459-489.
Bayraktar, E., Demirbag, M., Koh, S. L., Tatoglu, E., and
Zaim, H. , 2009. A causal analysis of the impact of
information systems and supply chain management
practices on operational performance: Evidence from
manufacturing SMEs in Turkey. Int. J.
ProductionEconomics, 122(1), 133-149.
ICORES 2018 - 7th International Conference on Operations Research and Enterprise Systems
68

Beamon, B. M. , 1999. Measuring supply chain
performance. International Journal of Operations and
Production Management, 19(3), 275-292.
Bentler, P. M., and Chou, C.-P., 1987. Practical Issues in
Structural Modeling. Sociological Methods Research,
16(1), 78-117.
Bhagwat, R., and Sharma, M. K., 2007. Performance
measurement of supply chain management: A balanced
scorecard approach. Computers and Industrial
Engineering, 53(1), 43-62.
Blodgett, J. G., and Anderson, R. D., 2000. A Bayesian
network model of the consumer compliant process.
Journal of Service Research, 2(4), 321-338.
Boon-itt, S., and Himangshu, P., 2005. Measuring Supply
Chain Integration Using the Q-Sort Technique. In
Research Methodologies in Supply Chain Management
(pp. 47-58). Heidelberg: Physica-Verlag.
Chae, B., 2009. Developing key performance indicators for
supply chain: an industry perspective. Supply Chain
Management: An International Journal, 14(6), 422-
428.
Davis-Sramek, B., Germain, R., and Karthik, l., 2010.
Supply chain technology: the role of environment in
predicting performance. Journal of the Academy of
Marketing Science(38), 42-55.
Devaraj, S., Krajewski, L., and Wei, J. C., 2007. Impact of
eBusiness technologies on operational performance:
The role of production information integration in the
supply chain. Journal of Operations Management,
25(6), 1199-1216.
Dubois, D., and Prade, H., 1983. Ranking fuzzy numbers in
the seting of possibility theory. Information Sciences,
30(3), 183-224.
Fornell, C., and Larcker, D. F., 1981. Evaluating structural
equation models with unobservable variables and
measurement error. Journal of Marketing Research,
18(1), 39-50.
Frohlich, M. T., and Westbrook, R., 2001. Arcs of
integration: an international study of supply chain
strategies. Journal of Operations Management, 19(2),
185-200.
González-Benito, J., 2007. Information technology
investment and operational performance in purchasing
The mediating role of supply chain management
practices and strategic integration of purchasing.
Industrial Management and Data Systems, 107(2), 201-
228.
Hamister, J. W., 2012. Supply chain management practices
in small retailers. International Journal of Retail and
Distribution Management, 40(6), 427-450.
Heckerman, D., 1997. Bayasian networks for data mining.
Data Mining and Knowledge Discovery, 1(1), 79-119.
Hsu, C. C., Tan, K. C., Kannan, V. R., and Keong Leong,
G., 2009. Supply chain management practices as a
mediator of the relationship between operations
capability and firm performance. International Journal
of Production Research, 47(3), 835-855.
Hu, L.-t., and Bentler, P. M., 1999. Cutoff criteria for fit
indexes in covariance structure analysis: Conventional
criteria versus new alternatives. Structural Equation
Modeling: A Multidisciplinary Journal, 6(1), 1-55.
Ibrahim, S. E., and Ogunyemi, O., 2012. The effect of
linkages and information sharing on supply chain and
export performance: An empirical study of Egyptian
textile manufacturers. Journal of Manufacturing
Technology Management, 23(4), 441-463.
Johnson, P. F., Klassen, ,. R., Leenders, M. R., and
Awaysheh, A., 2007. Utilizing e-business technologies
in supply chains: The impact of firm characteristics and
teams. Journal of Operations Management, 25(6),
1255-1274.
Kim, D.-Y., Kumar, V., and Kumar, U., 2012. Relationship
between quality management practices and innovation.
Journal of Operations Management, 30(4), 295–315.
King, G., Honaker, J., Joseph, A., and Scheve, K., 2001.
Analyzing Incomplete Political Science Data: An
Alternative Algorithm for Multiple Imputation.
American Political Science Review, 95(1), 49-69.
Kosko, B., 1986. Fuzzy cognitive maps. International
Journal of Man-Machine Studies, 24(1), 65-75.
Landsheer, J. L., 2010. The Specification of Causal Models
with Tetrad IV: A Review. Structural Equation
Modeling: A Multidisciplinary Journal, 17(4), 703-711.
Lee, C. W., Kwon, I.-W. G., and Severance, D., 2007.
Relationship between supply chain performance and
degree of linkage among supplier, internal integration,
and customer. Supply Chain Management: An
International Journal, 12(6), 444-452.
Li, G., Yang, H., Sun, L., and Sohal, A. S. , 2009. The
impact of IT implementation on supply chain
integration and performance. Intnational Journal of
Production Economics, 120(1), 125-138.
Li, S., Rao, S. S., Ragu-Nathan, T. S., and Ragu-Nathan, B.,
2005. Development and validation of a measurement
instrument for studying supply chain management
practices. Journal of Operations Management, 23, 618-
641.
Lockamy III, A., and McCormack, K., 2004. Linking
SCOR planning practices to supply chain performance:
An exploratory study. International Journal of
Operations and Production Management, 24(12),
1192-1218.
MacKenzie, S. B., and Podsakoff, P. M., 2011. Construct
measurement and validation procedures in mis and
behavioral research: integrating new and existing
techniques. MIS Quarterly, 35(2), 293-334.
McColl-Kennedy, J. R., and Anderson, R. D., 2005.
Subordinate-manager gender combination and
perceived leadership style influence on emotions, self-
esteem and organizational commitment. Journal of
Business Research, 58, 115-125.
Menhaj, M. B., 2006. Fuzzy computations. Tehran, Iran:
Amirkabir University of Technology.
Narasimhan, R., and Jayanth, J., 1998. Causal Linkages in
Supply Chain Management: An Exploratory Study of
North American Manufacturing Firms. Decision
Sciences, 29(3), 579-605.
Integrating Fuzzy Cognitive Mapping and Bayesian Network Learning for Supply Chain Causal Modeling
69

O'Leary-Kelly, S. W., and Vokurka, R. J., 1998. The
empirical assessment of construct validity. Journal of
Operations Management, 16, 387-405.
Ou, C. S., Liu, F. C., Hung, Y. C., and Yen, D. C., 2010. A
structural model of supply chain management on firm
performance. International Journal of Operations and
Production Management, 30(5), 526-545.
Qrunfleh, S., and Tarafdar, M., 2015. Supply chain
management practices–IT utilization alignment: impact
on supply chain performance and firm
performance. International Journal of Business
Information Systems 5, 18(4), 364-389.
Sanders, N. R., 2007. An empirical study of the impact of
e-business technologies on organizational collaboration
and performance. Journal of Operations Management,
25 (6), 1332-1347.
Schumacker, R. E., and Lomax, R. G., 2004. A beginner's
guide to structural equation modeling (2nd ed.).
Mahwah: Lawrence Erlbaum Associates.
Sezen, B., 2008. Relative effects of design, integration and
information sharing on supply chain performance.
Supply Chain Management: An International Journal,
13(3), 233-240.
Shepherd, C., and Günter, H., 2006. Measuring supply
chain performance: current research and future
directions. International Journal of Productivity and
Performance Management, 55(3), 242-258.
Shin, H., Collier, D. A., and Wilsom, D. D., 2000. Supply
management orientation and supplier/buyer
performance. Journal of Operations Management, 18,
317-333.
Shiu, E., Pervan, S. J., Bove, L. L., and Beatty, S. E., 2011.
Reflections on discriminant validity: Reexamining the
Bove et al. (2009) findings. Journal of Business
Research, 64, 497-500.
Stach, W., Kurgan, L., and Pedrycz, W., 2010. Expert-
Based and Computational Methods for Developing
Fuzzy Cognitive Maps. In M. Glykas (Ed.), Fuzzy
Cognitive Maps Advances in Theory, Methodologies,
Tools and Applications (Vol. 247, pp. 23-41). Berlin
Heidelberg: Springer-Verlag.
Sundram, V. P., Ibrahim, A. R., and Govindaraju, V. C.,
2011. Supply chain management practices in the
electronics industry in Malaysia: Consequences for
supply chain performance. Benchmarking: An
International Journal, 18(6), 834-855.
Tan, K. C., Lyman, S. B., and Winser, J. D., 2002. Supply
chain management: a strategic perspective.
international journal of operations and productions
management, 22(6), 614-631.
Tatoglu, E., Bayraktar, E., Golgeci, I., Koh, S. L.,
Demirbag, M., and Zaim, S., 2016. How do supply
chain management and information systems practices
influence operational performance? Evidence from
emerging country SMEs. International Journal of
Logistics Research and Applications, 19(3), 181-199.
Zelbst, P. J., Green Jr, K. W., Swer, V. E., and Baker, G.,
2010. RFID utilization and information sharing: the
impact on supply chain performance. Journal of
Business and Industrial Marketing, 25(8), 582-589.
Zhou, H., and Benton Jr., W. C., 2007. Supply chain
practice and information sharing. Journal of Operations
Management, 25, 1348-1365.
Zhu, B., He, C., and Liatsis, P., 2012. A robust missing
value imputation method for noisy data. Applied
Intelligence, 36(1), 61-74.
ICORES 2018 - 7th International Conference on Operations Research and Enterprise Systems
70
